

In this blog, let's explore how to set up Black Box Exporter on VM(virtual machine). By the end, you'll have a clear understanding of the process.
The working nature of the Black Box exporter is a little different than other exporters, if you require to monitor the endpoint of a server then the Blackbox exporter is useful.
This exporter will probe the metrics based on monitoring the health of the server and whether the endpoint is available or not, using protocols such as HTTP, HTTPS, ICMP, TCP, gRPC, and DNS.
Blackbox Exporter Workflow
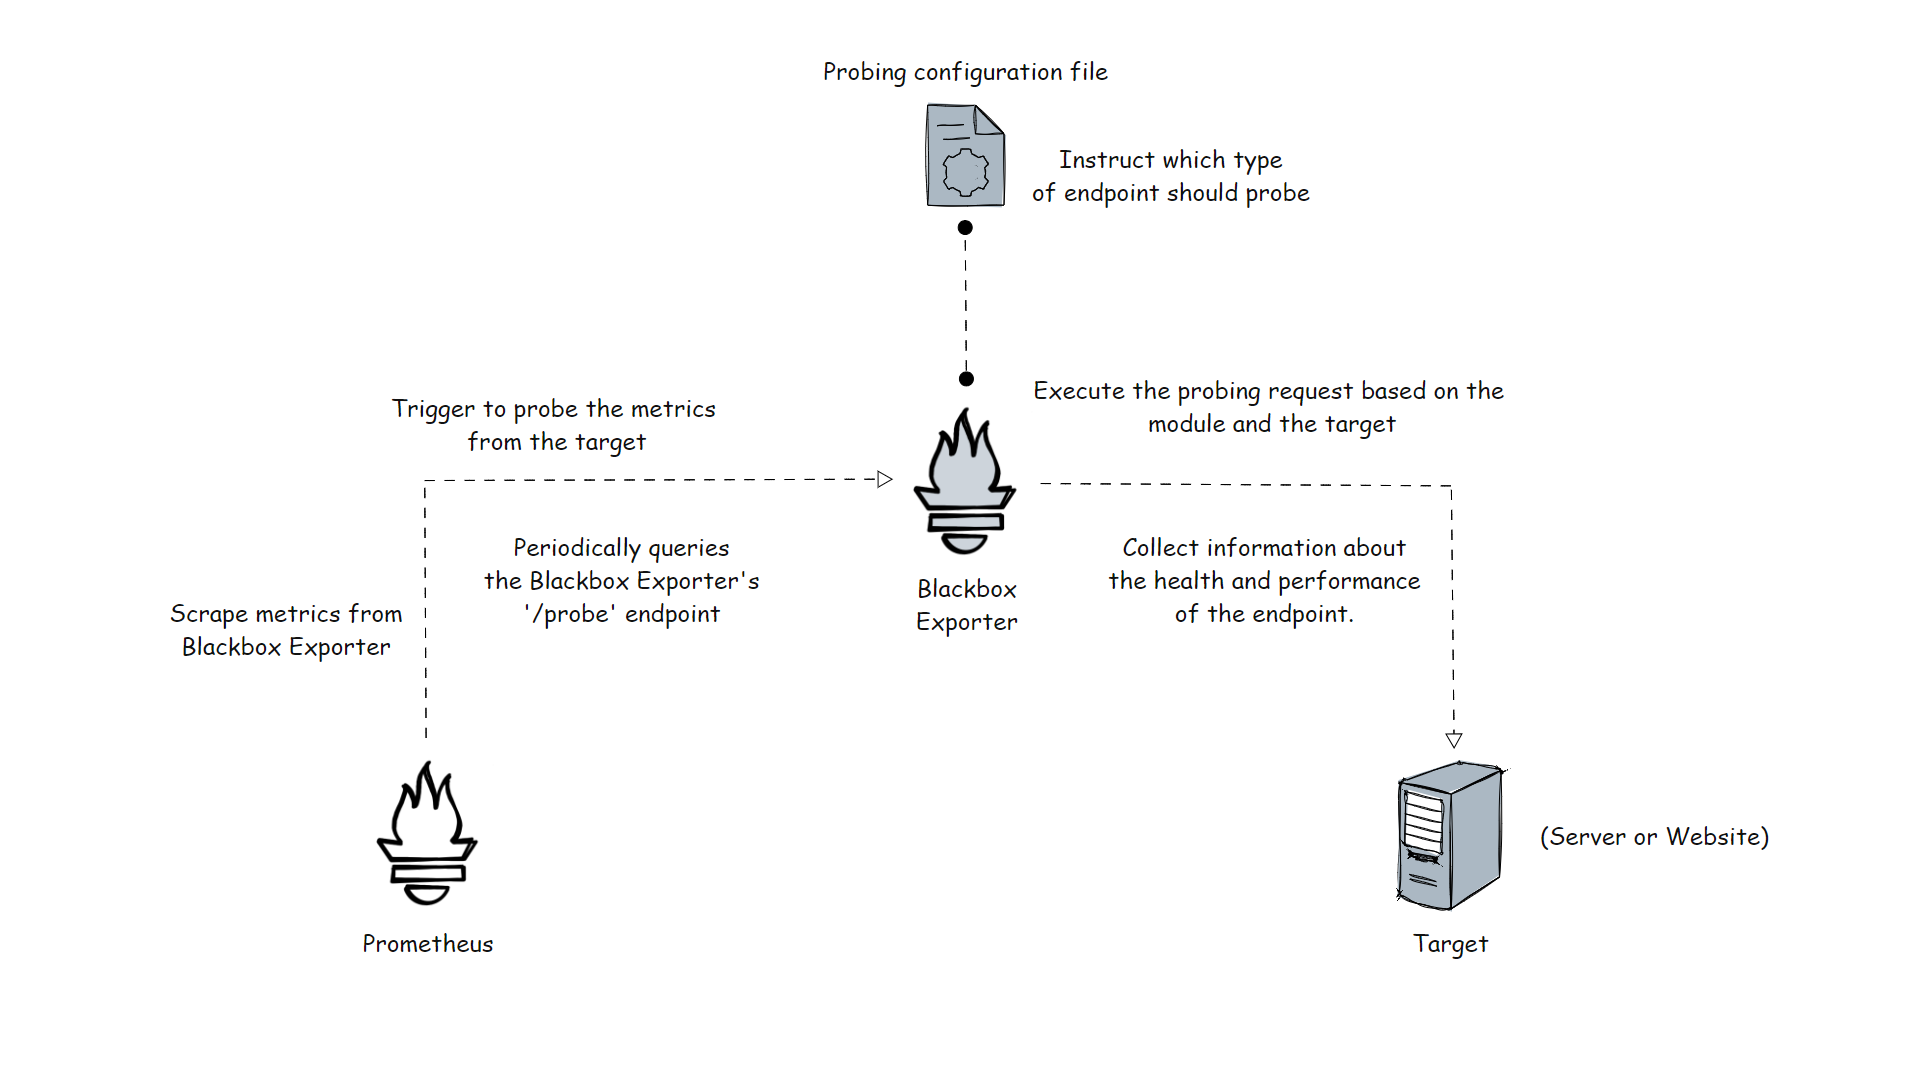
In this setup, we use two separate servers for Prometheus and Blackbox Exporter, but if you want, you can install both utilities on the same server.
After installing the Blackbox Exporter, we have to configure it for probing the metrics from the target, the configuration is a YAML formatted file, which contains modules, and modules are responsible for choosing the endpoint type.
Blackbox itself doesn't collect the information from the target, so for that we need Prometheus.
We have to modify the configuration in Prometheus about the scraping interval, and target information. Also, we have to link the Blackbox Exporter to the Prometheus.
Based on the scrape interval, Prometheus tries to scrape the metrics from the Blackbox Exporter, once that response reaches the Blackbox, Blackbox will be triggered to collect the information from the target.
Blackbox Exporter collects the information and stores it in /probes the directory, from there. Prometheus pulls them and stores them in the Time Series Data Base (TSDB).
Setting Up Prometheus Blackbox Exporter on Virtual Machine(VM)
I am using two servers in AWS for this tutorial.
Server 1: The instance type is t2.medium and the utilities in this server are Prometheus and Grafana.
Server 2: This instance type is t2.micro and the utilities are Prometheus Blackbox Exporter.
I assume you have the server 1 setup already, so I am skipping that installation part, and let's begin to install Blackbox Exporter on the server.
Download Blackbox Exporter binaries from the official repository. I am using the latest version v0.24.0 for this setup.
https://github.com/prometheus/blackbox_exporter/releases/download/v0.24.0/blackbox_exporter-0.24.0.linux-amd64.tar.gzUnzip the files.
tar -xvf blackbox_exporter-0.24.0.linux-amd64.tar.gzThis will contain the Blackbox executable file and the configuration file.
Open the directory
cd blackbox_exporter-0.24.0.linux-amd64Create a user for Blackbox with no shell access.
sudo useradd -rs /bin/false blackboxCreate a directory in the /etc directory to store the configuration file.
sudo mkdir -p /etc/blackboxMove the configuration blackbox.yml file to the directory
sudo mv blackbox.yml /etc/blackboxMove the executable file blackbox_exporter to the /usr/local/bin directory
sudo mv blackbox_exporter /usr/local/binChange the ownership to the executable file and configuration file to the Blackbox user.
sudo chown blackbox:blackbox /usr/local/bin/blackbox_exporter
sudo chown -R blackbox:blackbox /etc/blackbox/*
Create a service file for the Blackbox Exporter blackbox.service
sudo cat <<EOT > /lib/systemd/system/blackbox.service
[Unit]
Description=Blackbox Exporter Service
Wants=network-online.target
After=network-online.target

[Service]
Type=simple
User=blackbox
Group=blackbox
ExecStart=/usr/local/bin/blackbox_exporter \
  --config.file=/etc/blackbox/blackbox.yml \
  --web.listen-address=":9115"

Restart=always

[Install]
WantedBy=multi-user.target
EOT
Enable and start the blackbox.service
sudo systemctl enable blackbox.service
sudo systemctl start blackbox.service
To check the status of the service, use the following command.
sudo systemctl status blackbox.serviceThe port number of the Blackbox Exporter is 9115, by default, the external probe metrics will be saved in the /probe directory and the internal metrics will be stored in /metrics the directory.
If you want to check it from inside the instance, use the following method.
curl http://localhost:9115/metricsIf you want to access it over the internet, in the browser, use your instance public IP with the port number <Public IP>:9115. Then you will get this output.
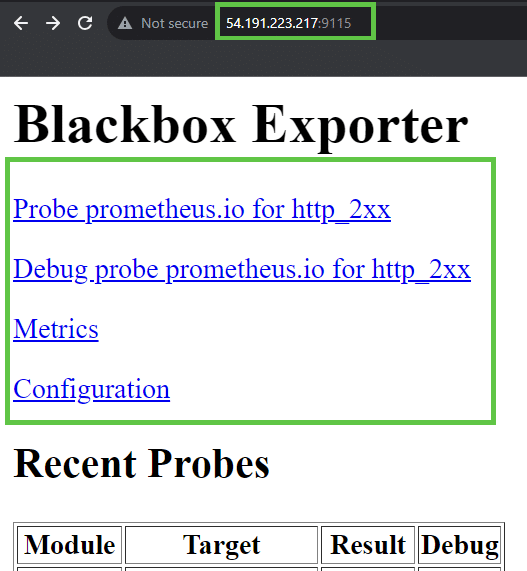
Based on modules, the probe data will be stored here.
Prometheus Blackbox Exporter Probe Module
We have to create modules in Blackbox, then we will get the probe metrics. Fundamentally, we have to know which type of endpoint we are going to monitor because the module should be related to the endpoint.
A simple example module for an HTTP endpoint is
http_endpoint:
  prober: http
  timeout: 10s
  http:
    valid_http_versions: ["HTTP/1.1", "HTTP/2.0"]
    valid_status_codes: [200, 204]
    no_follow_redirects: false
    preferred_ip_protocol: "ip4"
This module will be configured in the Blackbox Exporter configuration file, which is /etc/blackbox/blackbox.yml.
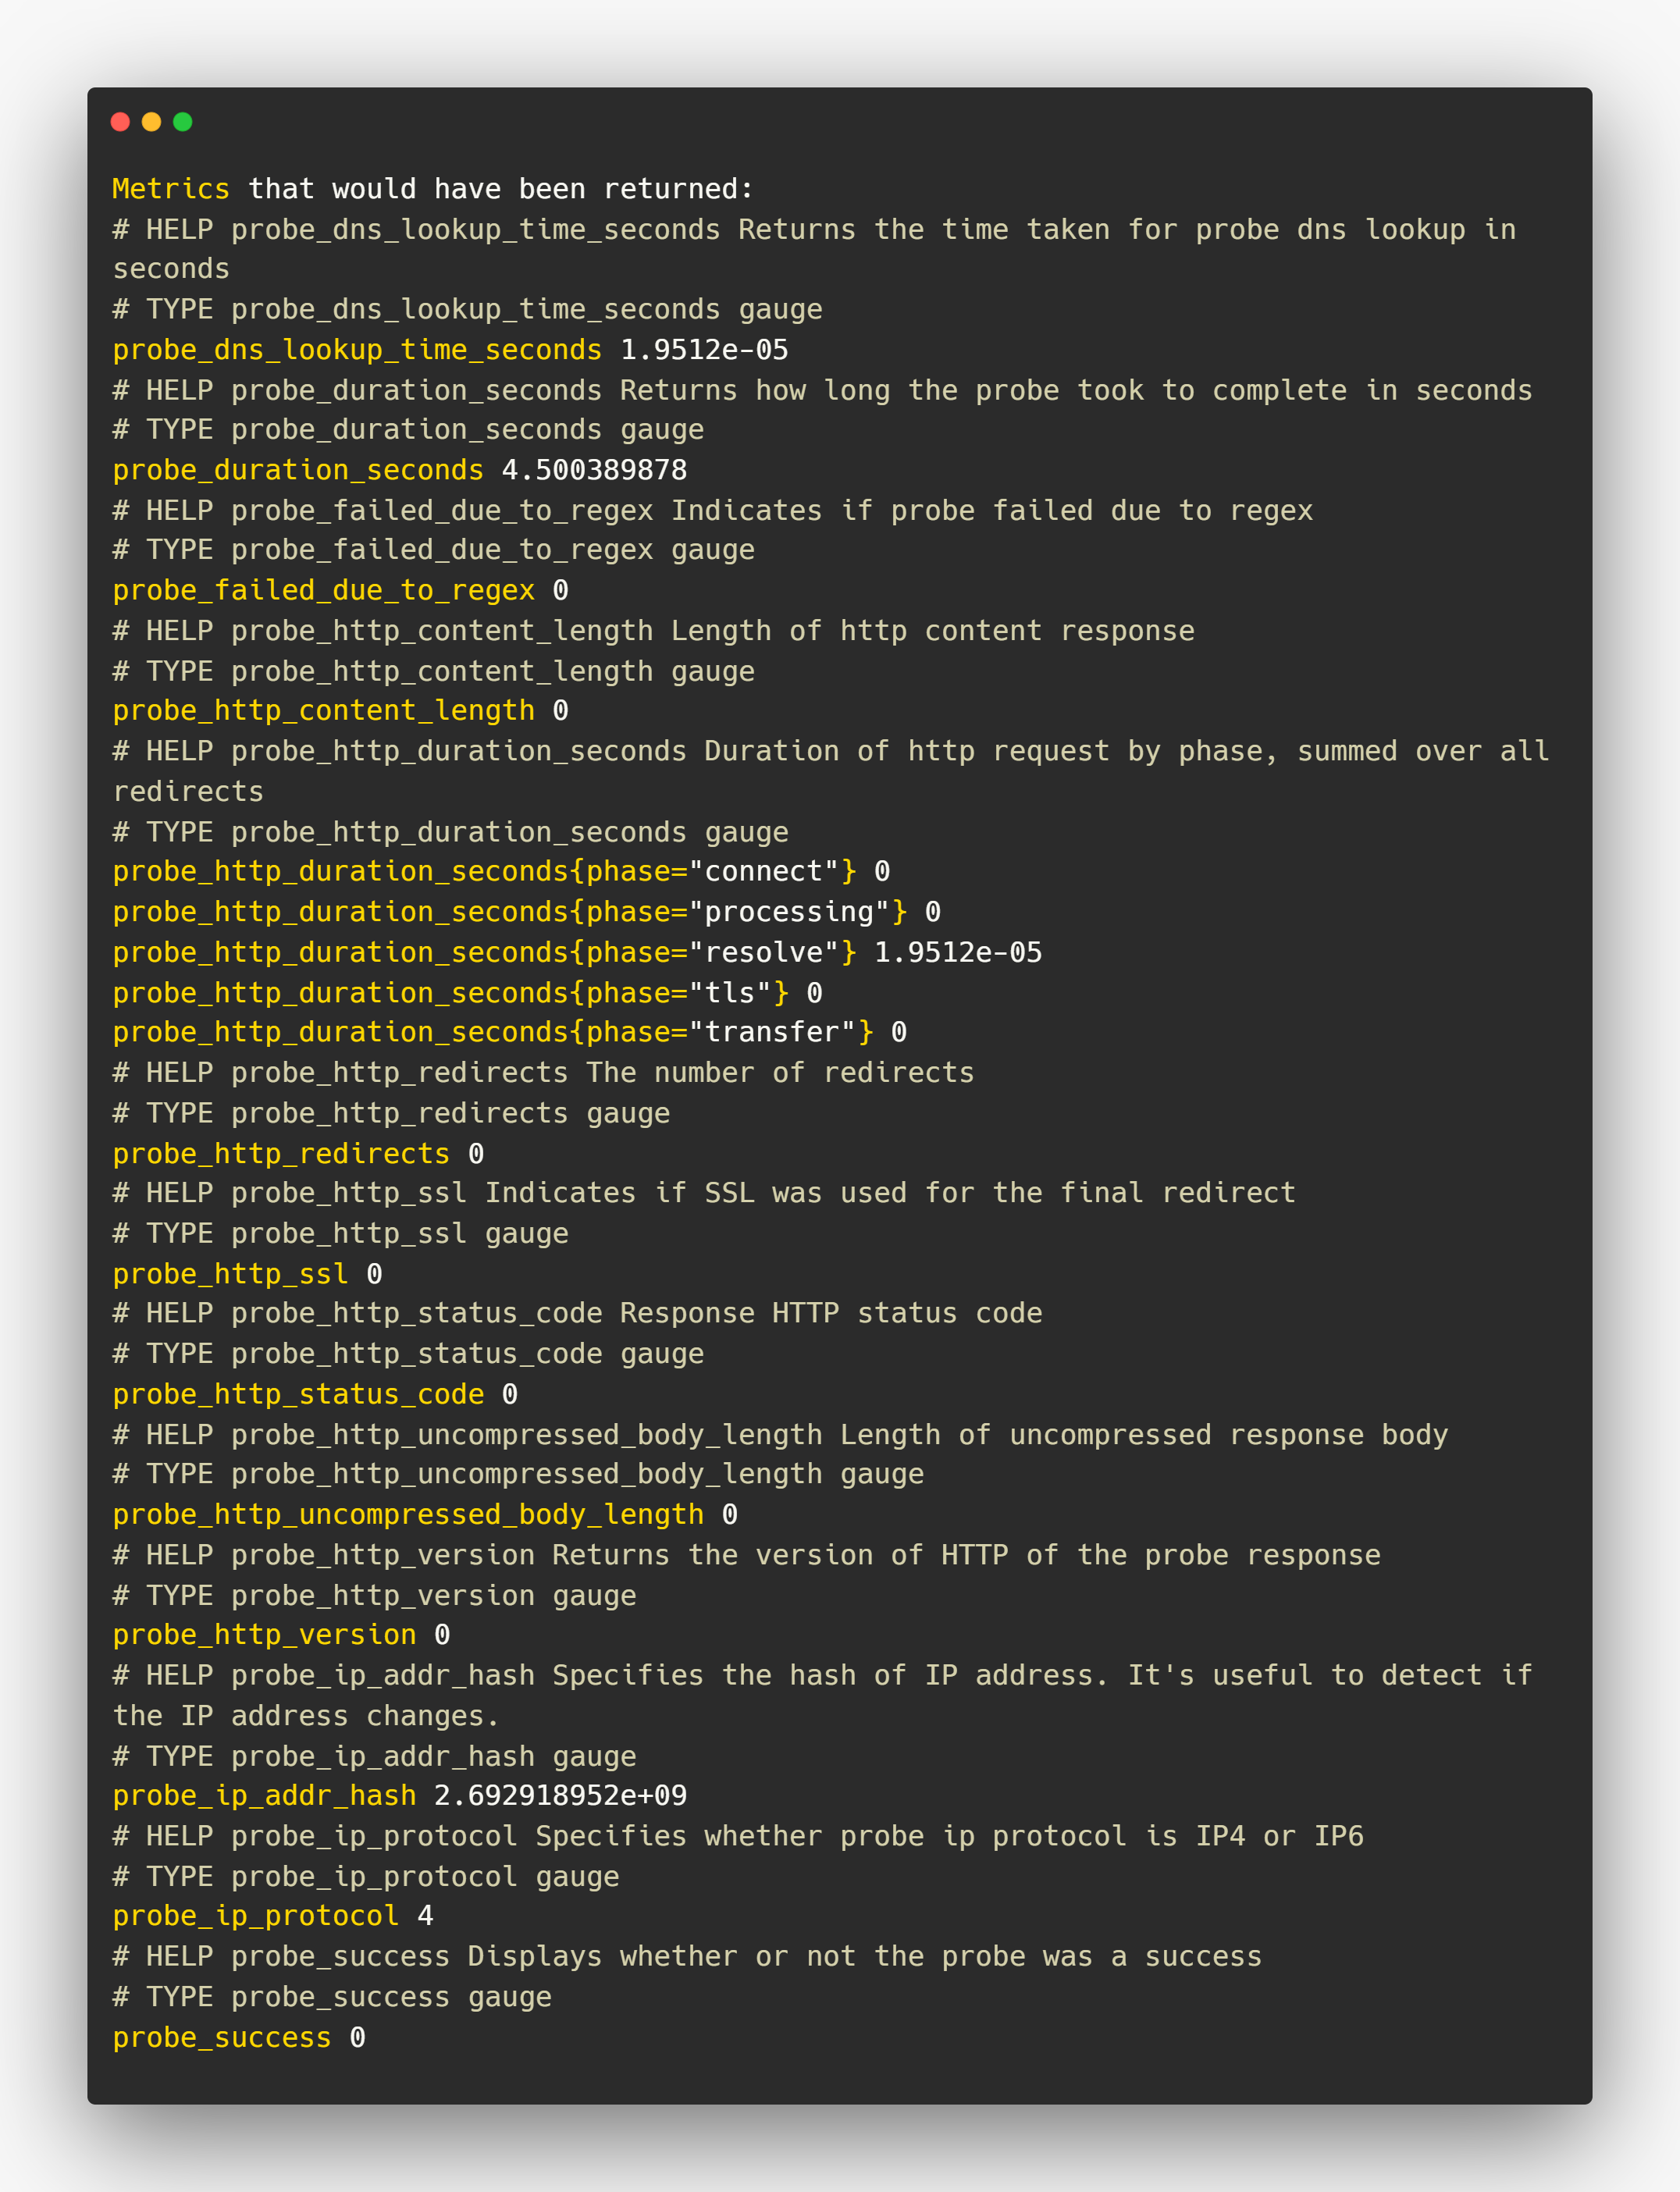
The collected probe metrics by this particular module are this
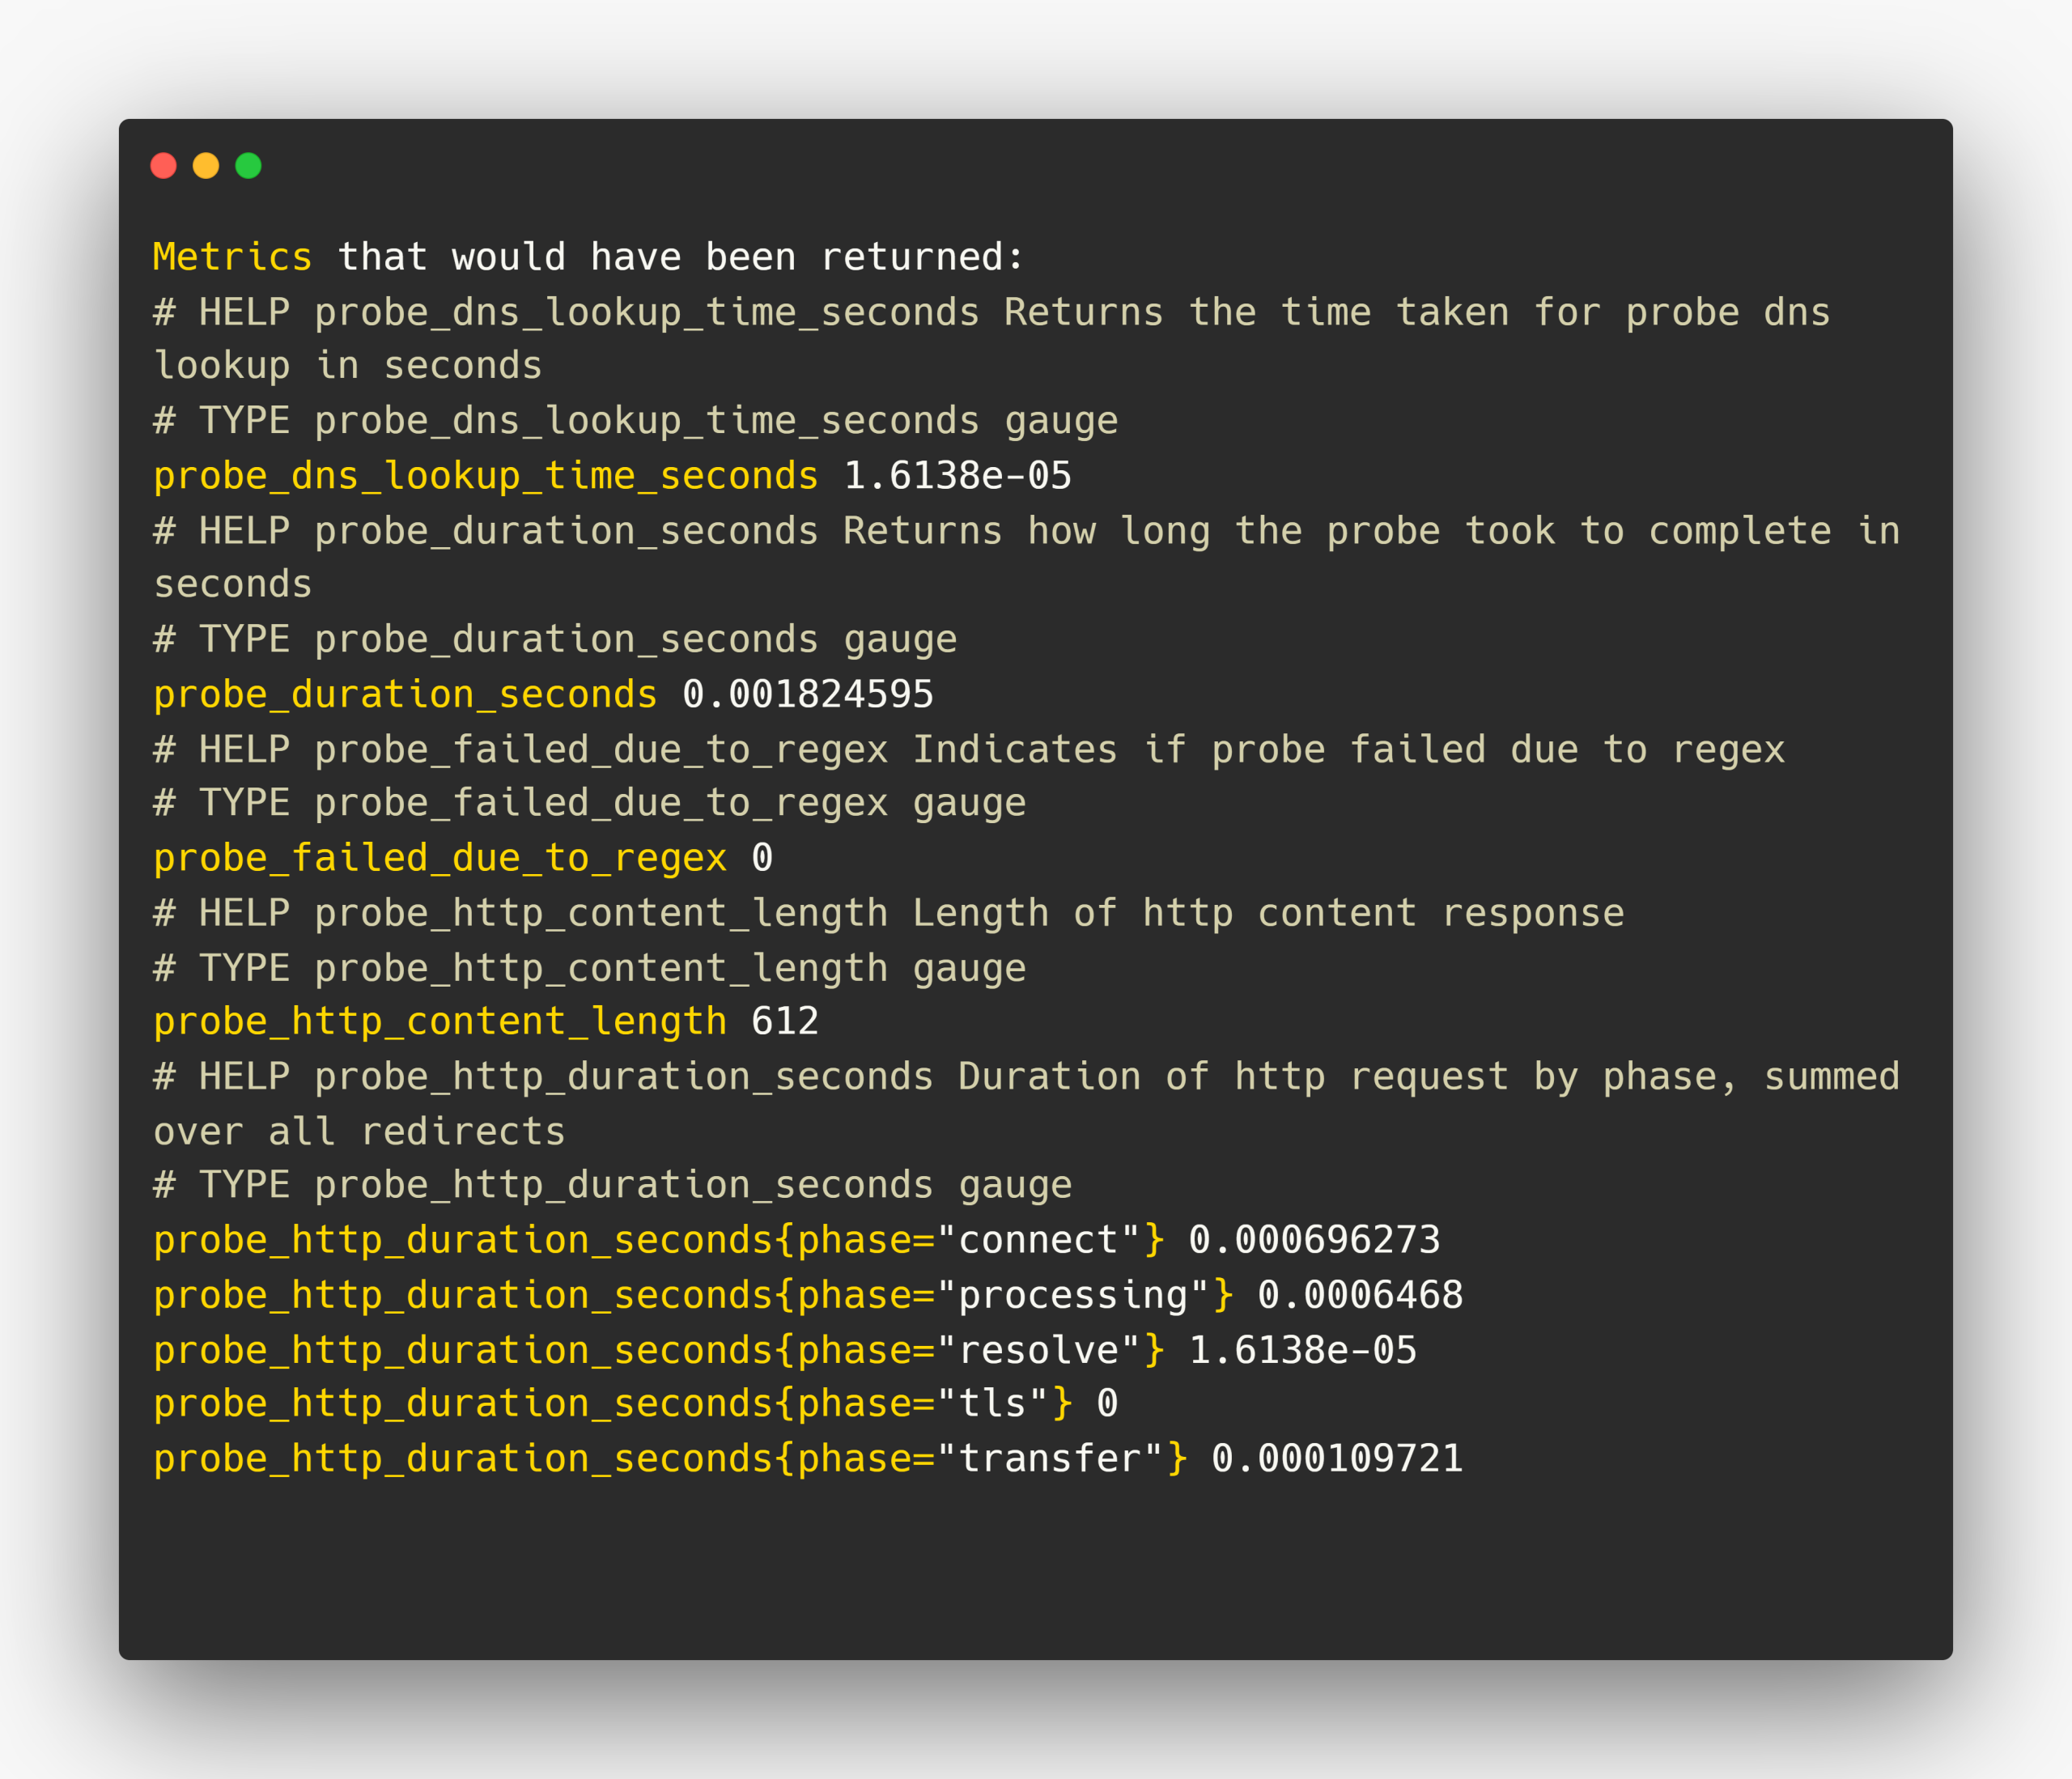
We can further filter and visualize these metrics using Prometheus and Grafana utilities.
Prometheus Blackbox Exporter Endpoint
The Blackbox Exporter probes the metrics using responses from the endpoint, protocol defining the endpoint types and the supporting protocols,
- HTTP
- HTTPS
- ICMP
- TCP
- DNS
- gRPC
We should choose one of the protocols to create a module, for example, if I am taking the DNS protocol to create a module, I could get the probe metrics like DNS query failure counts, query duration, query count, response size, etc
Prometheus Blackbox Exporter Real-World Examples
Create a module using HTTP(S) protocol
HTTP(S) module can track the SSL/TLS certificate validation and expiration, so I am creating this module to know that the target web server has a valid SSL/TLS certificate.
Add this configuration to your Blackbox Exporter configuration file /etc/blackbox/blackbox.yml.
modules:
  https_endpoint:
    prober: http
    timeout: 15s
    http:
      method: GET
      valid_http_versions:
        - HTTP/1.1
        - HTTP/2.0
      fail_if_not_ssl: true
      no_follow_redirects: false
      ip_protocol_fallback: false
      preferred_ip_protocol: ip4
Here, you can see that the prober is HTTP, which indicates this module is meant to be an HTTP endpoint, also I am passing another argument fail_if_not_ssl: true so that if the web server doesn't have an SSL/TLS certificate, the status would fail.
Restart and check the status of the Blackbox Exporter.
sudo systemctl restart blackbox.service
sudo systemctl status blackbox.service
Update the Prometheus configuration file
Open the Prometheus configuration file /etc/prometheus/prometheus.yml, and append the Blackbox configuration with your existing Prometheus configuration.
In the global section, I have given the scrape_interval time as 5s, which means Prometheus will pull the metrics from the exporters every 5 seconds. you can modify with your required value.
Under the scrape_configs section, we have to create a new job for Blackbox Exporter and have to give the metrics_path, we already know that the probe metrics will be stored in the/probe directory.
I am giving the module value https_endpoint, which is my module name, and modifying the replacement value with your Blackbox Exporter servers private (if same network) or public IP with port number.
global:
  scrape_interval: 5s
  evaluation_interval: 5s

scrape_configs:
  - job_name: "blackbox"
    metrics_path: /probe
    params:
      module: [https_endpoint]
    static_configs:
      - targets:
        - 35.80.157.25
        - devopscube.com
    relabel_configs:
      - source_labels: [__address__]
        target_label: __param_target
      - source_labels: [__param_target]
        target_label: instance
      - target_label: __address__
        replacement: 172.31.19.73:9115
I have given two targets in this configuration file, which are 35.80.157.25 and devopscube.com. The first one has a Nginx web server and doesn't have an SSL/TLS certificate, but the second one has a valid certificate.
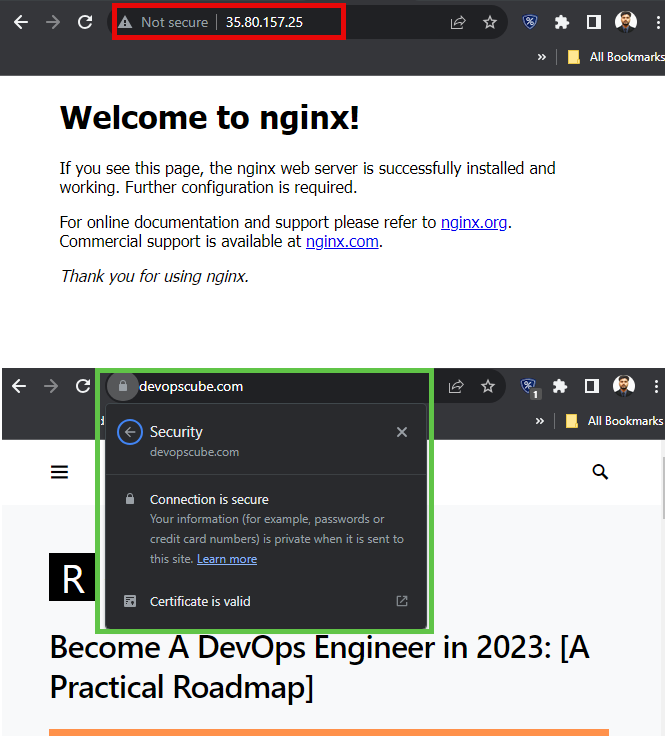
Let's see if our setup identifies that, before that, we have to restart the Blackbox service and ensure the configurations are properly done.
sudo systemctl restart blackbox.service
sudo systemctl status blackbox.service
Check the Blackbox Exporter directly. For that open any browser, and paste your Blackbox Exporter public IP and the port number.
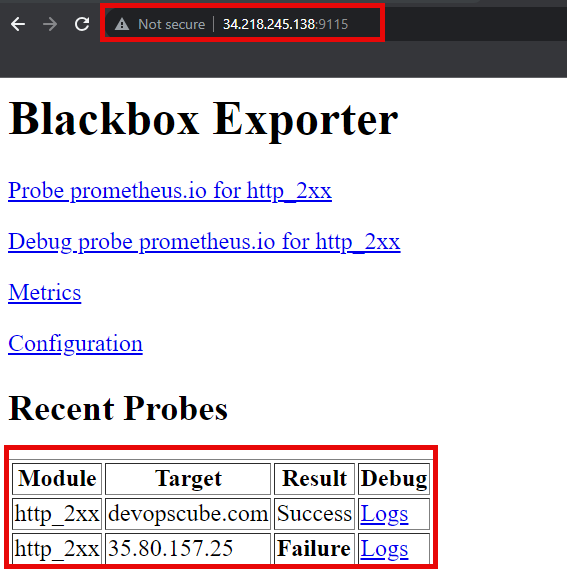
Here it shows that the result of the devopscube.com is successful and the 35.80.157.24 is failed.
If you click the logs, you can view all the probe metrics, which is related to the target.
Now I am picking one of the metrics from that to see the results in Prometheus.
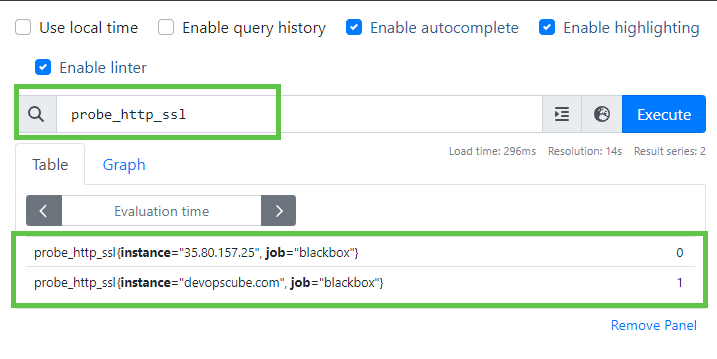
To see the presence of the SSL/TLS certificate, we can use probe_http_ssl metrics.
probe_http_sslPrometheus output
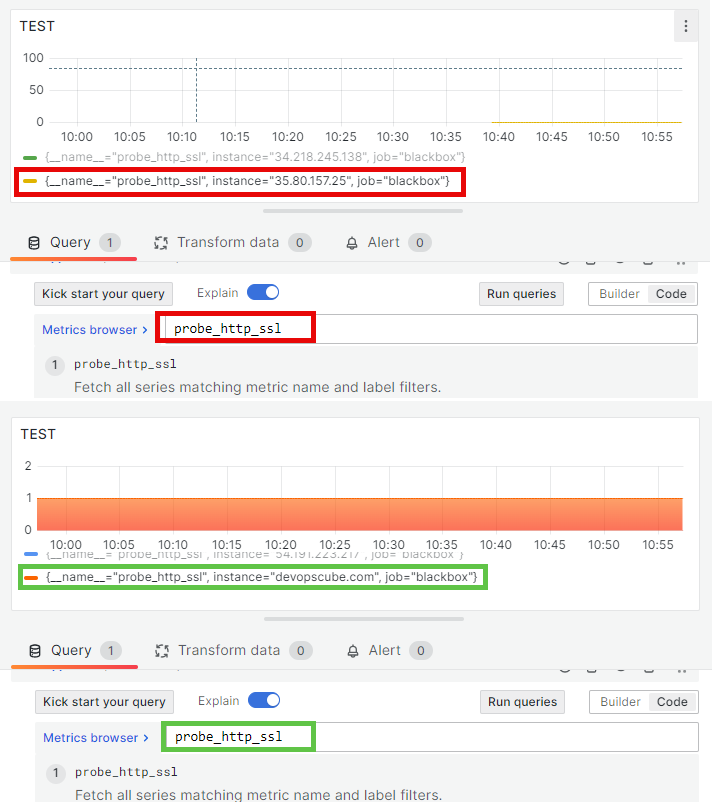
Grafana output
Create a module using TCP protocol
The main use case of the TCP the based module is used to identify whether a user can reach the target over TCP or not also we can check some SSL-related metrics.
Add this to the Blackbox configuration file /etc/blackbox/blackbox.yml
modules:
  tcp_module:
    prober: tcp
    timeout: 10s
    tcp:
      preferred_ip_protocol: "ip4"
      tls: true
      tls_config:
        insecure_skip_verify: false
tcp_module is the module name, you can modify it if you want, and the prober value should be tcp.
Don't forget to restart and view the status of the black-box service blackbox.service, this will ensure the configurations are properly done.
Update the Prometheus configuration file /etc/prometheus/prometheus.yml. Add another job or replace it with the existing job if you want.
scrape_configs:
  - job_name: "blackbox-tcp"
    metrics_path: /probe
    params:
      module: [tcp_module]
    static_configs:
      - targets:
        - 35.80.157.25:443
        - devopscube.com:443
    relabel_configs:
      - source_labels: [__address__]
        target_label: __param_target
      - source_labels: [__param_target]
        target_label: instance
      - target_label: __address__
        replacement: 172.31.19.73:9115
After updating the configuration file, restart and check the status of the Prometheus service prometheus.service
Providing target with the port number is necessary for the TCP module.
The Blackbox Exporter output is
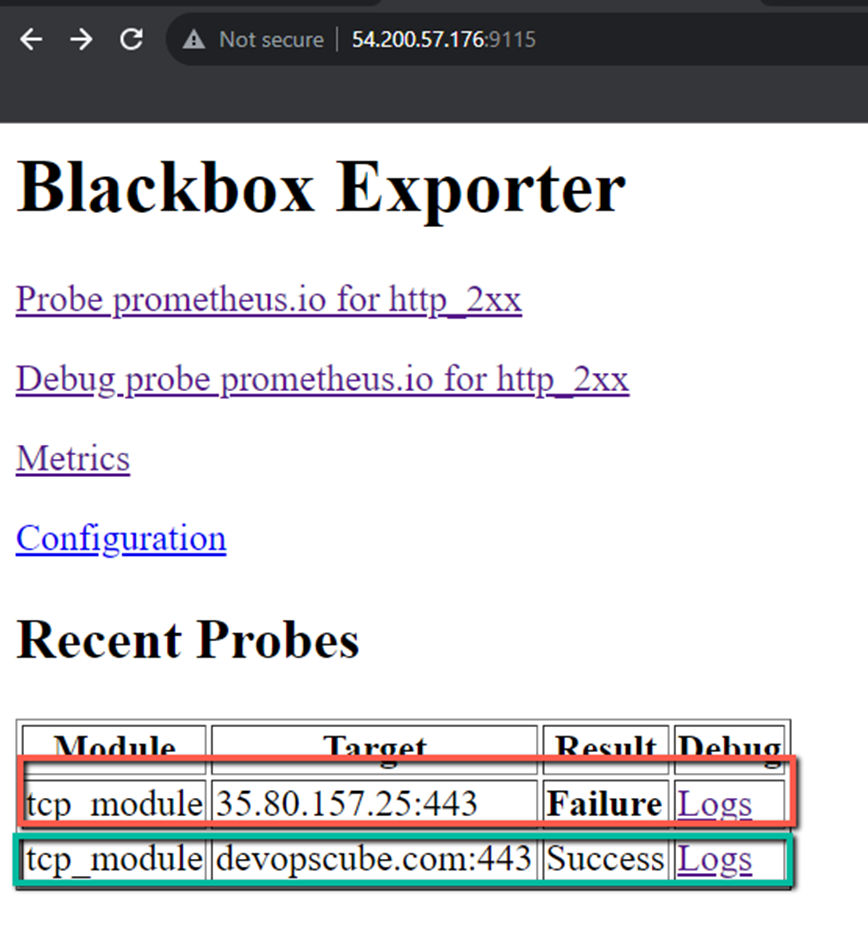
Here, the first server doesn't have the Transport Layer Security, so it fails and we can view the probe metrics of the second server.
This tcp_module module collects the probe metrics.
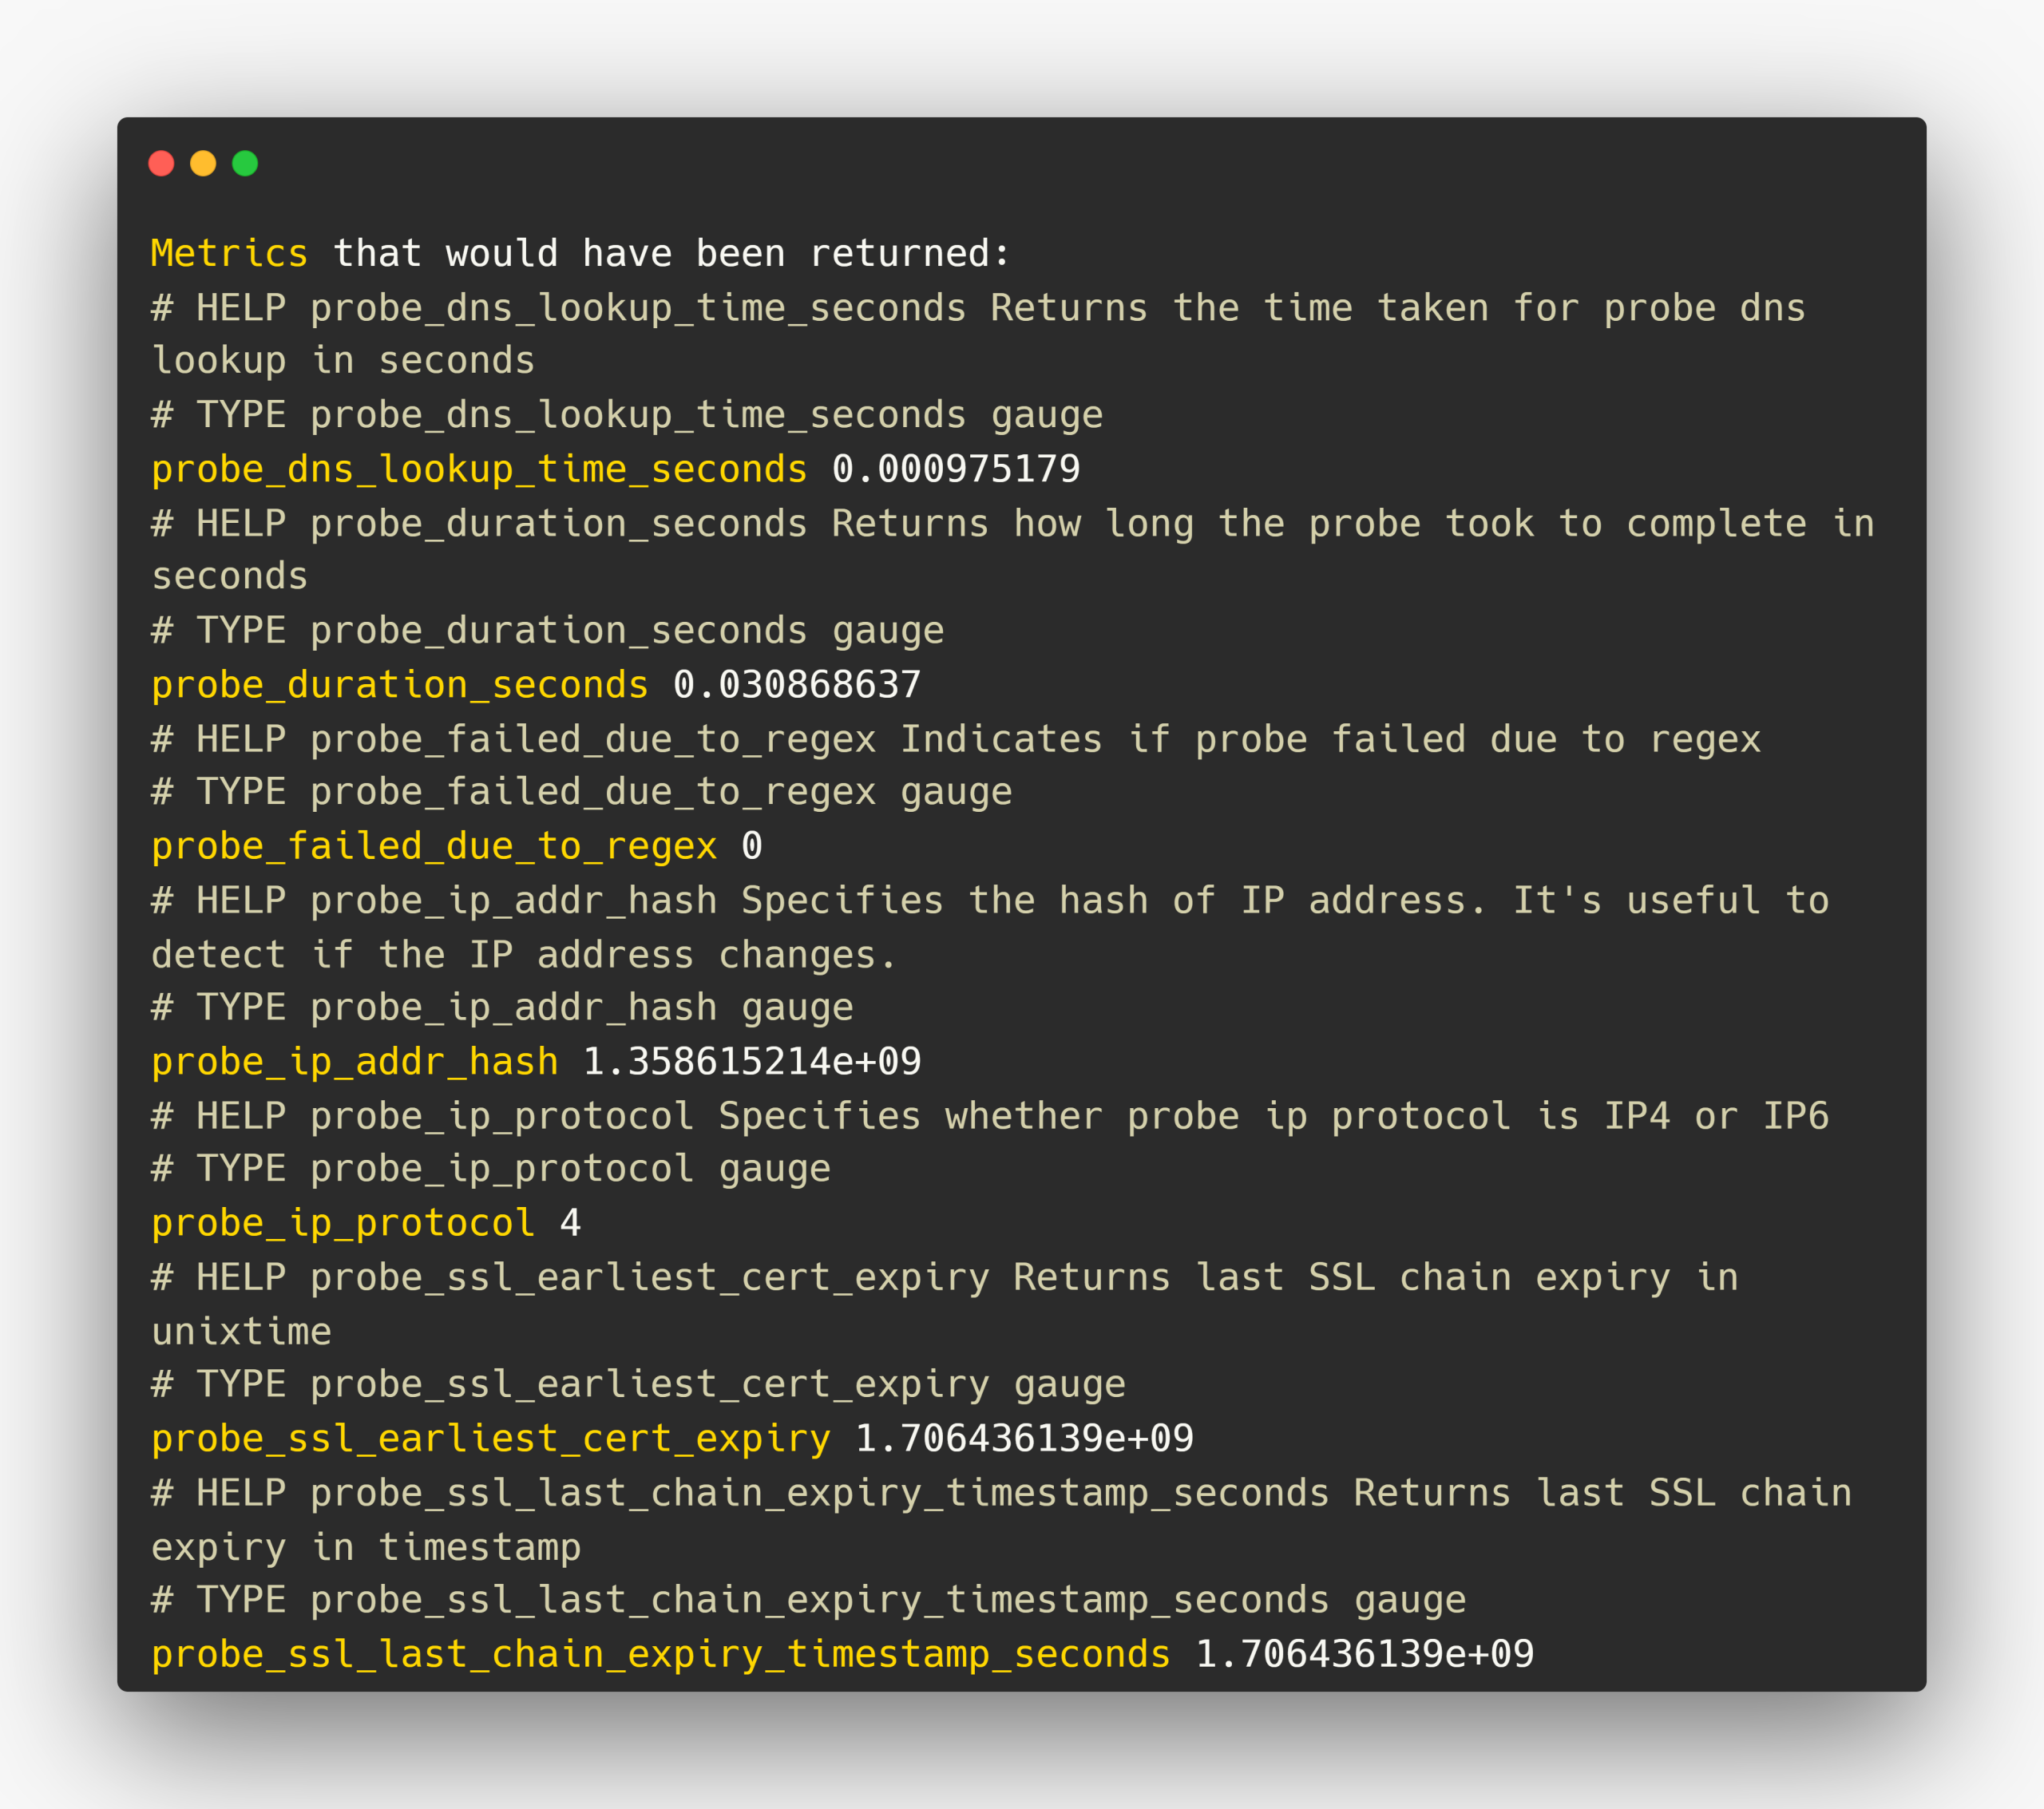
I want to know the SSL/TLS certificate expiry date of the server, for that, I am using probe_ssl_last_chain_expiry_timestamp_seconds metrics.
probe_ssl_last_chain_expiry_timestamp_secondsPrometheus output
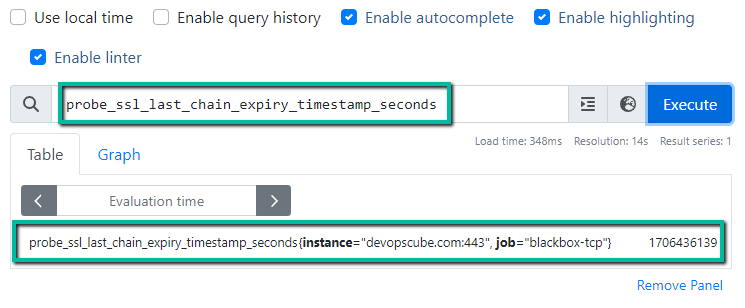
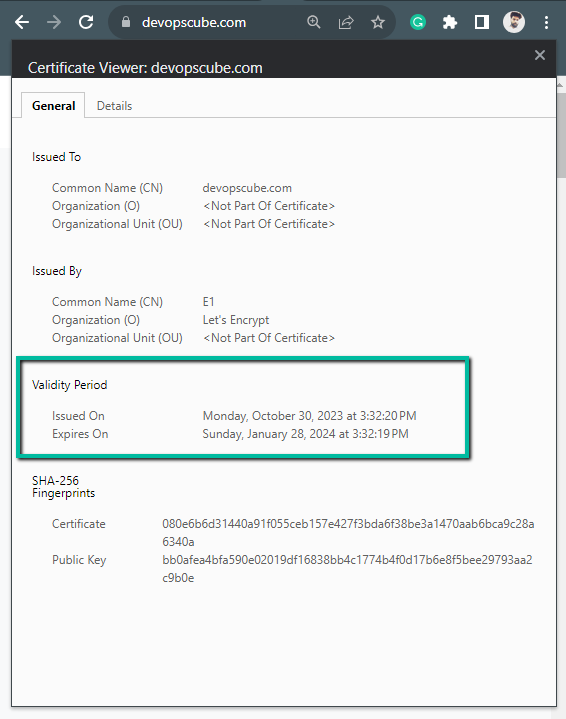
Let's calculate this value 1706436139 to find the actual date and time of the expiration.
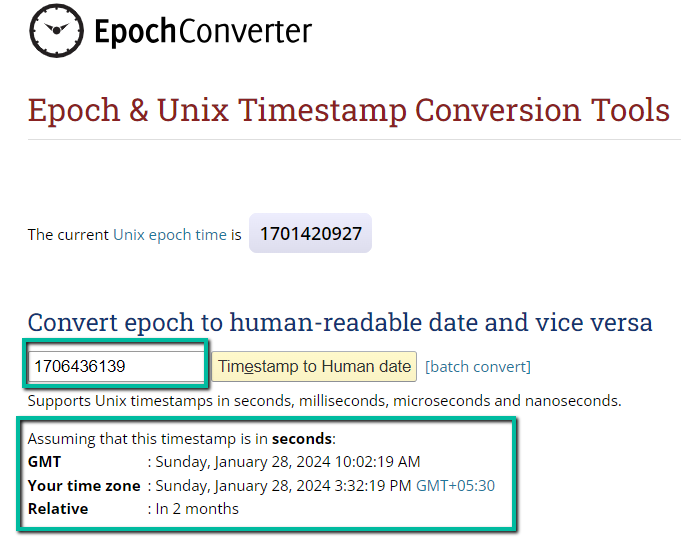
We can cross-verify this by searching the website on Google and viewing the certificate details.
Create a Module Using ICMP the Protocol
Example for the ICMP module in Blackbox configuration file /etc/blackbox/blackbox.yml.
modules:
  ping:
    prober: icmp
    timeout: 5s
    icmp:
      preferred_ip_protocol: "ip4"
With this module, we can able to know whether the particular web server or network is reachable or not.
Update the Prometheus configuration file with this module /etc/prometheus/prometheus.yml
scrape_configs:
- job_name: "blackbox-icmp"
metrics_path: /probe
params:
module: [ping]
static_configs:
- targets:
- 35.80.157.25
- devopscube.com
relabel_configs:
- source_labels: [__address__]
target_label: __param_target
- source_labels: [__param_target]
target_label: instance
- target_label: __address__
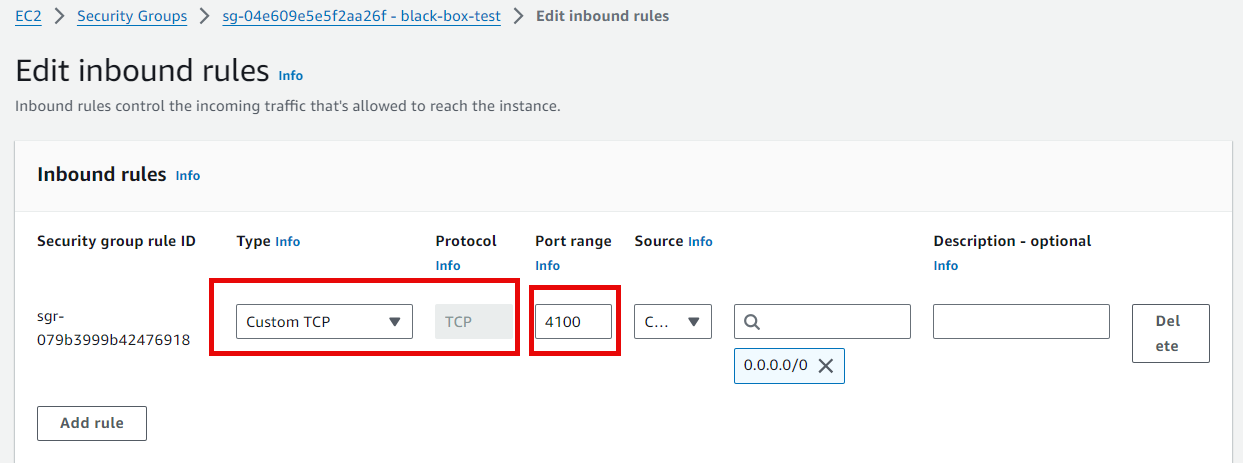
replacement: 172.31.19.73:9115Before starting testing, I am blocking the port for ICMP protocol in my EC2 instance so that the result should fail.
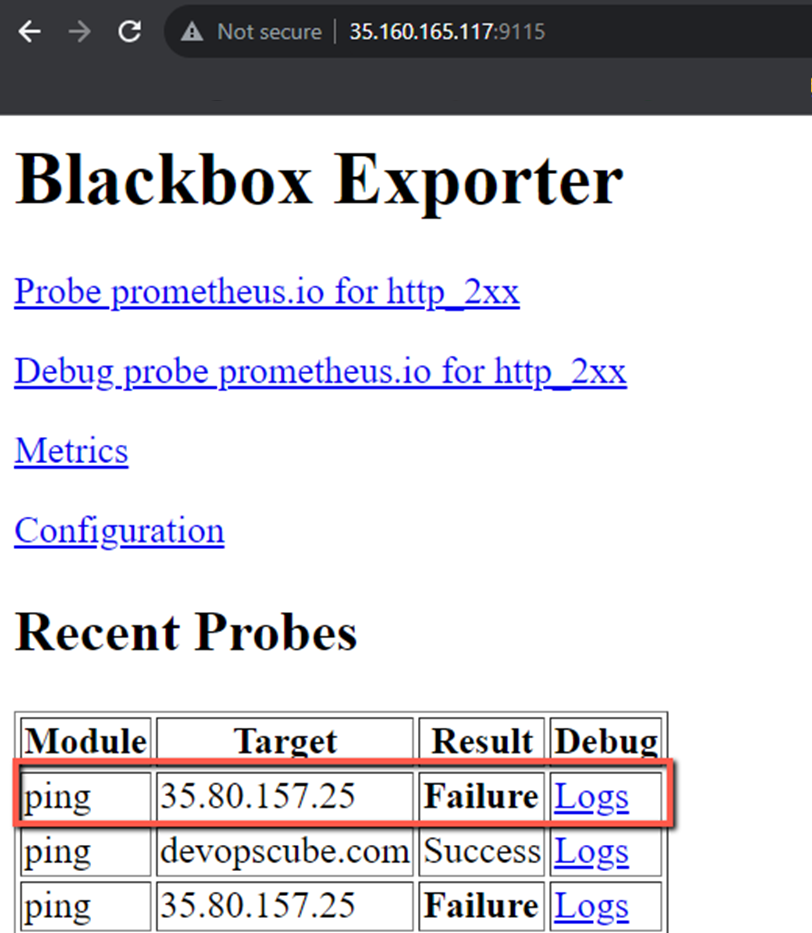
In the Blackbox Exporter, you can see the failure result
I am enabling the ICMP protocol in the target EC2 instance.
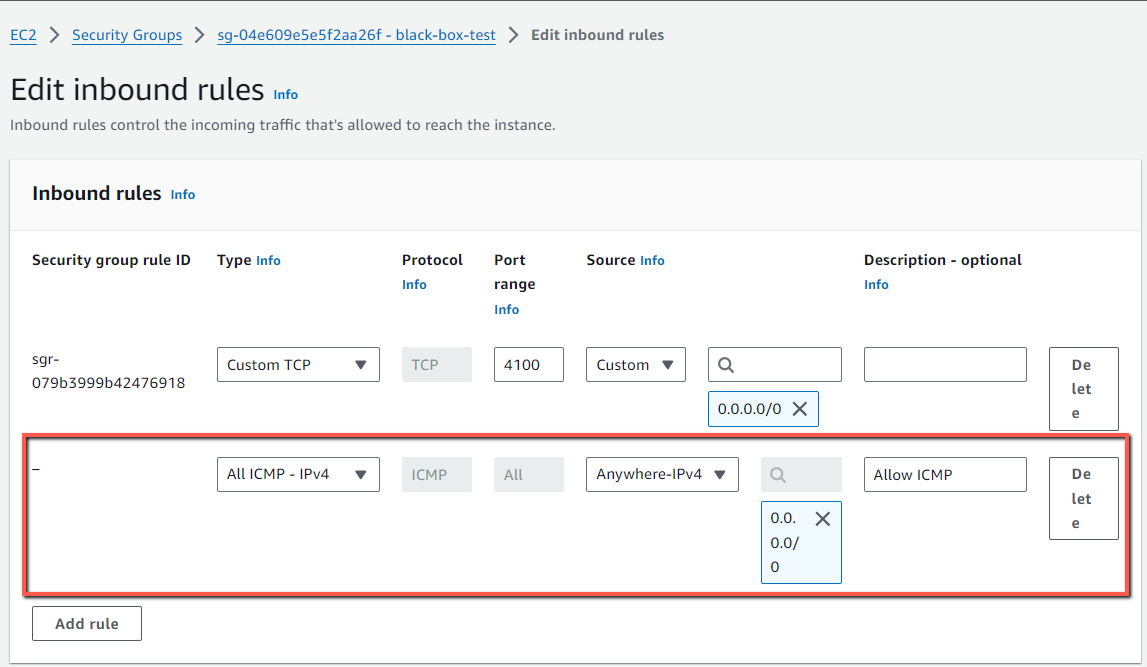
Now the result is Success, this ensures that the target server is reachable.
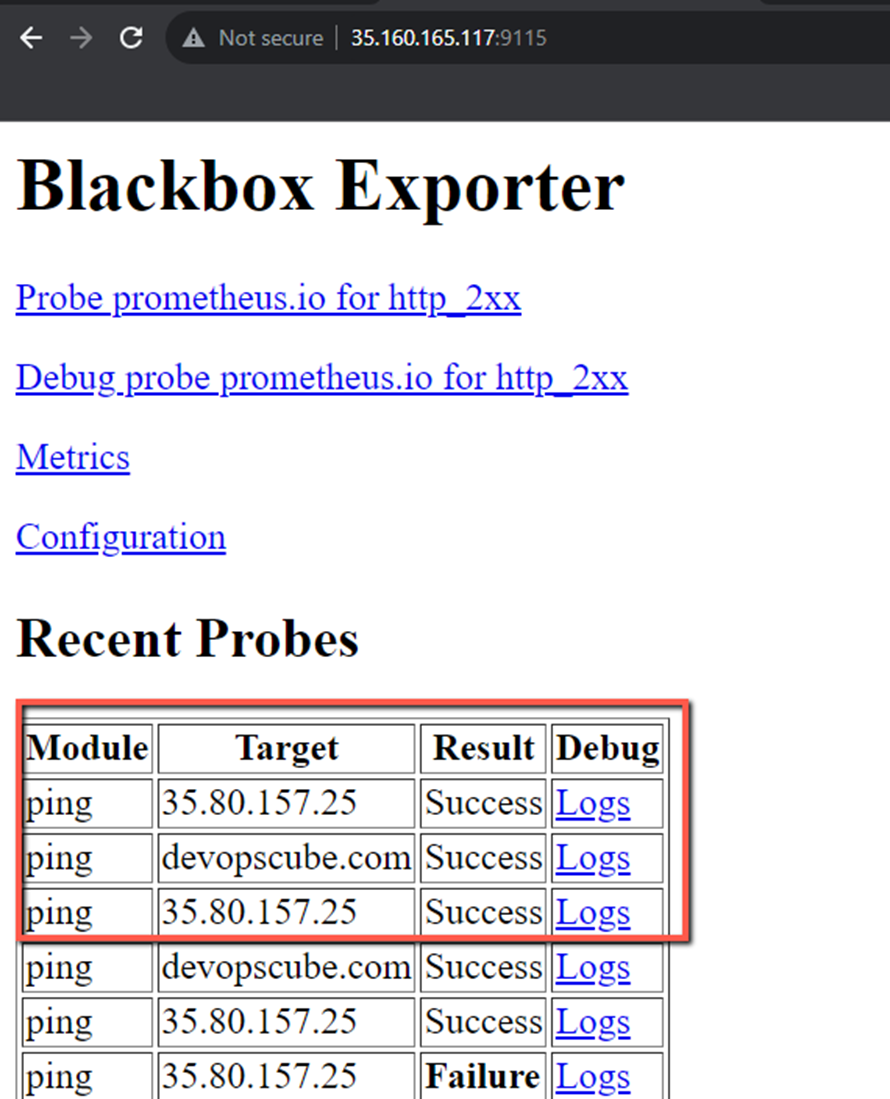
If you click the Logs, you can able to see what are the probe metrics this module collects.
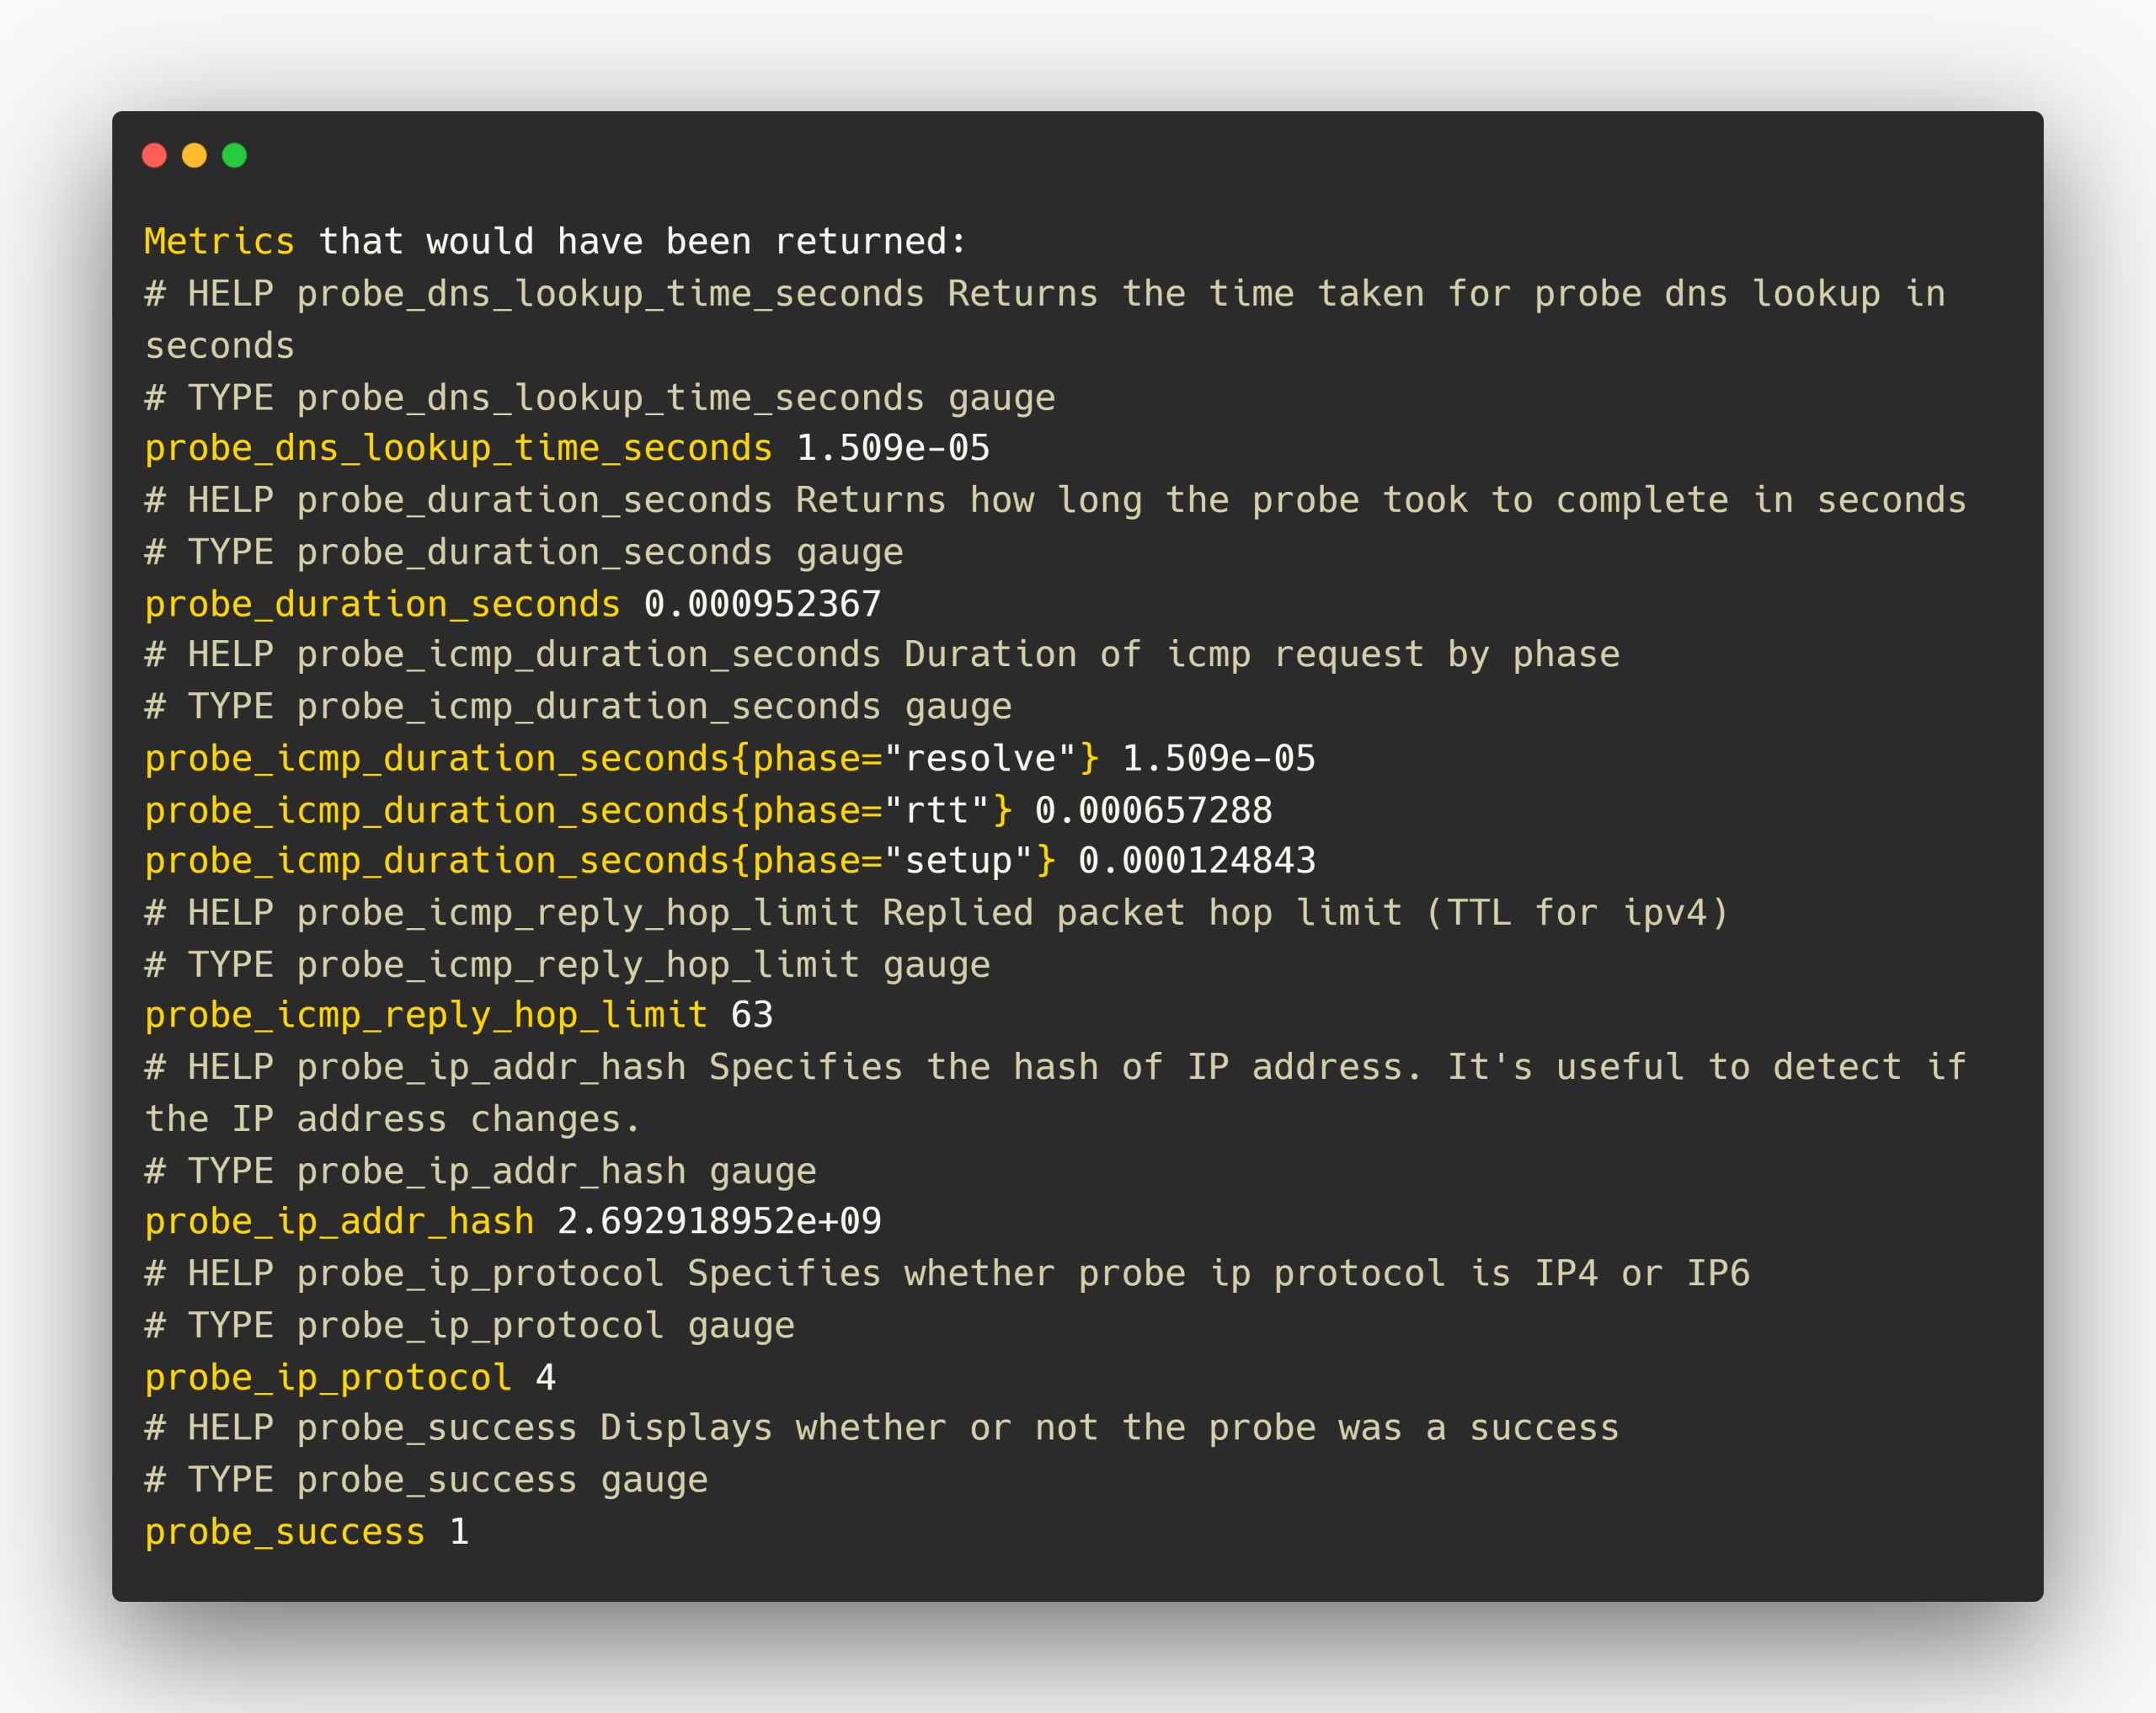
Let's take one of the metrics from this and make a query in Prometheus to see the results, also we can visualize them with Grafana.
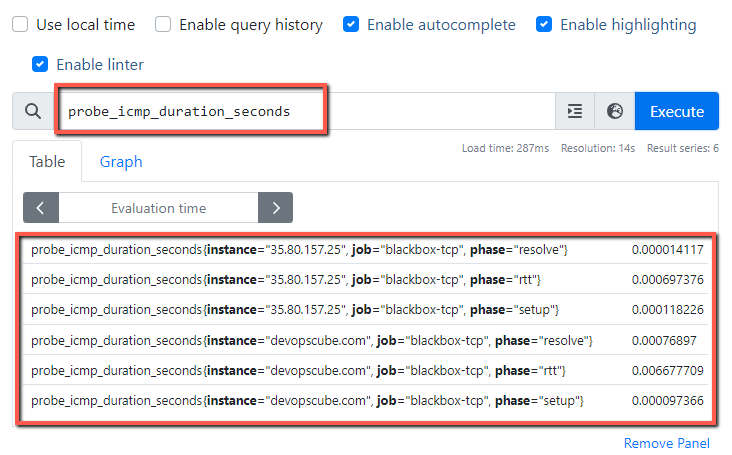
I am choosing the probe_icmp_duration_seconds metric.
Prometheus output
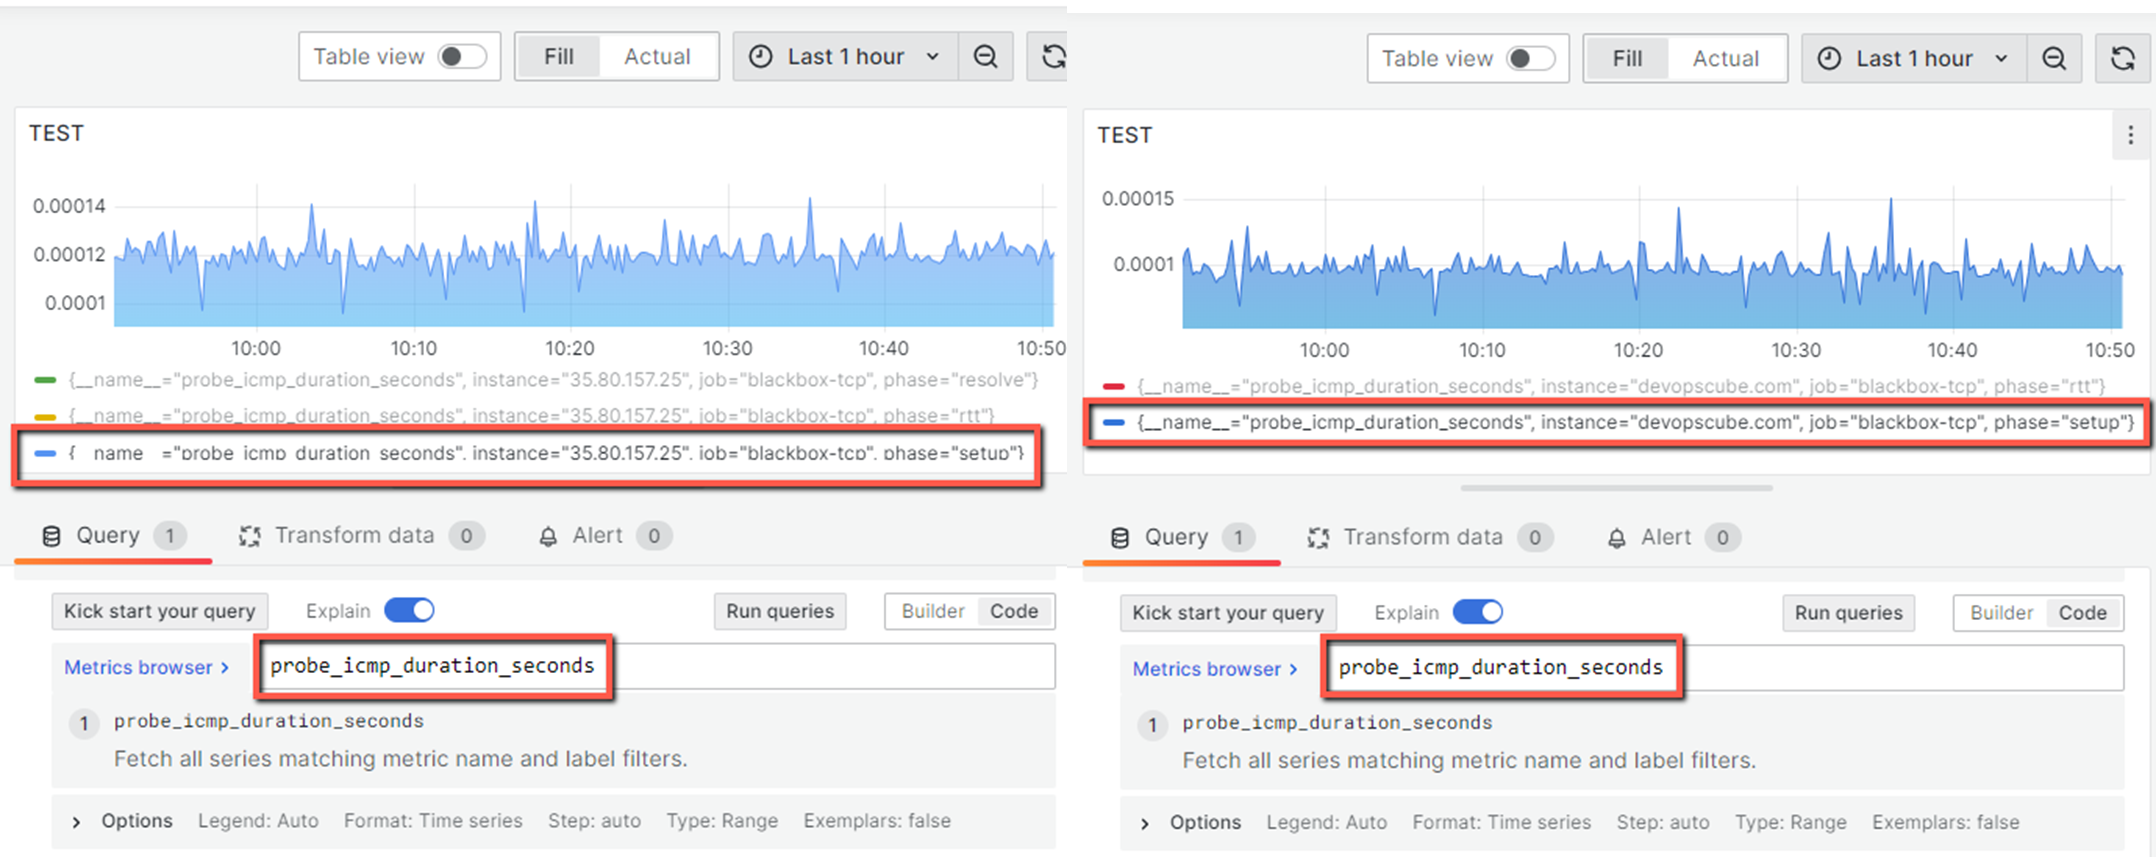
Grafana output
Prometheus Blackbox Exporter Use Cases
- We can know whether a particular website or server is currently reachable or not and also analyze how much time it takes to reach it.
- Create alerts based on the server's health, for example, if the server is not reachable or it is taking too much time to respond, we will get alerts.
- SSL/TLS certificate is one of the essential security components of our servers, we can track whether the certificate is present in the server or is valid.
- We all know, that the DNS resolution should be very fast, only then can we access a website real quick, if it is taking too much time, that will kill the user experience, this exporter can check the DNS-related responses.
Conclusion
This setup gives you an overall idea about, what is Blackbox Exporter and how this utility works with Prometheus.
Here, I have created modules, only for testing purposes, but you can create modules with a lot of customization because the requirements will differ from person to person.
I am attaching the official documentation with this for your further customization.
