

This blog covers the step-by-step guide to setting up the Prometheus Stack, which contains Prometheus, Grafana, and Alert Manager, using Docker and Docker Compose.
It is a learning project that is part of the DevOps projects initiative.
To understand the basics of observability, please read the Observability guide.
DevOps Tools / Service Used
In this setup, we have used the following open-source DevOps tools.
- Docker
- Prometheus
- Alert Manager
- Grafana
- Prometheus Node Exporter
- Terraform
The following are the AWS services used.
- ec2
The following are the Linux concepts covered as part of the setup
- Makefile: Used to modify the server IP address in Prometheus config.
- Linux SWAP: To add swap to the EC2 instance.
- Shell Scripts: To install Docker, Docker compose and add swap as part of ec2 system startup.
Setup Prerequisites
To deploy the Prometheus stack using Docker Compose, we have the following prerequisites:
- AWS Account with a key pair.
- AWS CLI configured with the account.
- Terraform is installed on your local machine.
Prometheus Stack Architecture & Workflow
Here is the high-level overview of our setup architecture and workflow.
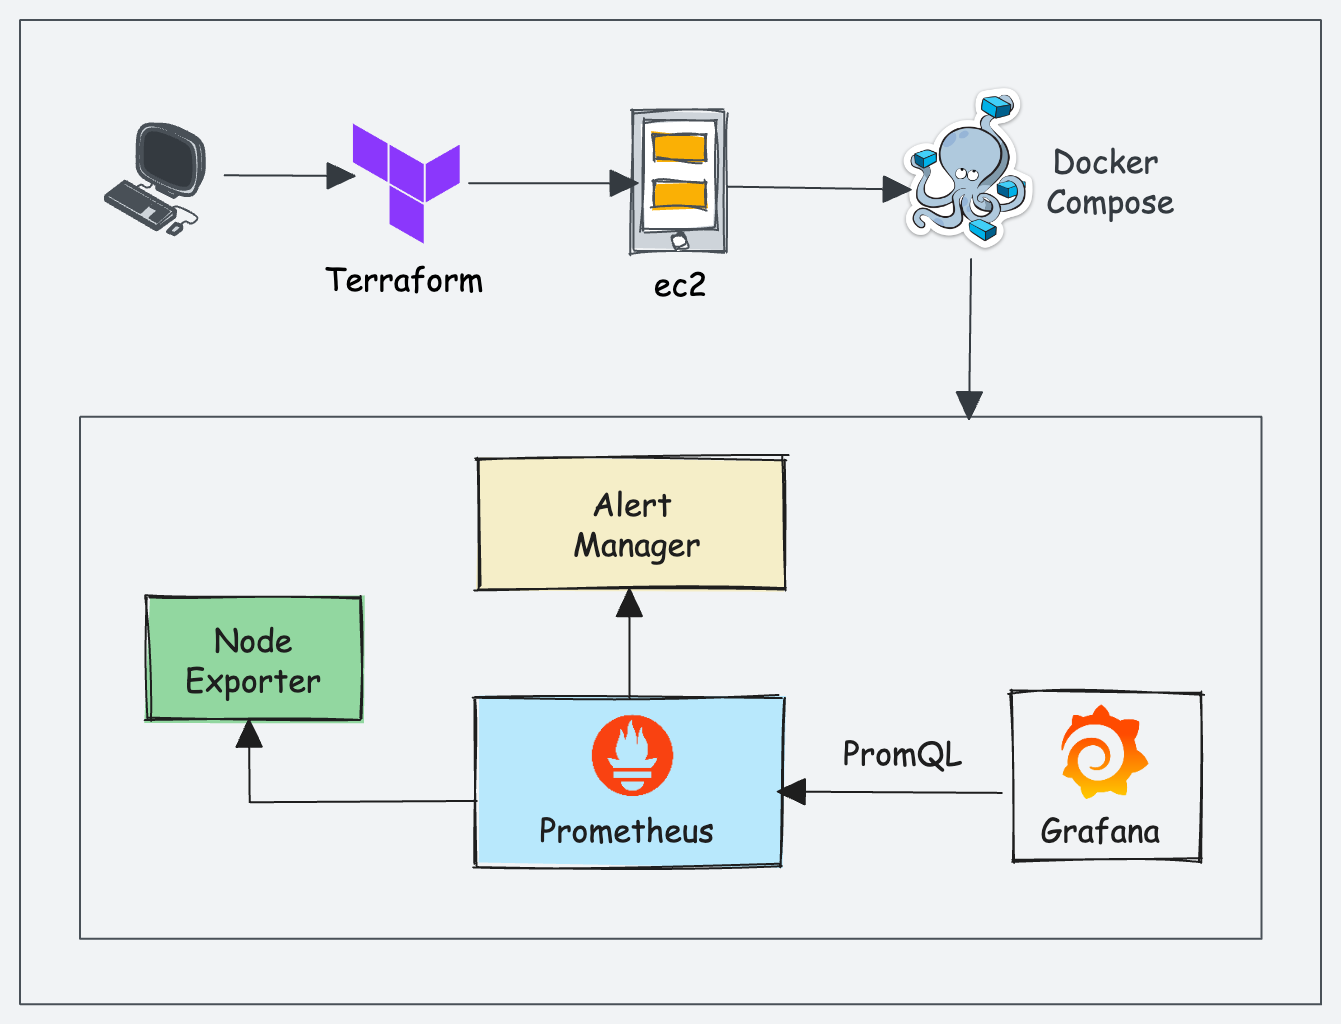
In our setup, we will be using the following components.
1. Prometheus
Prometheus is used to scrape the data metrics, pulled from exporters like node exporters. It used to provide metrics to Grafana. It also has a TSDB(Time series database) for storing the metrics. For more info please visit the Prometheus Documentation.
2. Alert Manager
Alert manager is a component of Prometheus that helps us to configure alerts based on rules using a config file. We can notify the alerts using any medium like email, Slack, chats, etc.
With a nice dashboard where all alerts can be seen from the prometheus dashboard. For more info, please visit alert manager documentation
3. Node Exporter
Node exporter is the Prometheus agent that fetches the node metrics and makes it available for Prometheus to fetch from /metrics endpoint. So basically node exporter collects all the server-level metrics such as CPU, memory, etc.
While other custom agents are still available and can be used for pushing metrics to prometheus. For more info, please visit Node Exporter Documentation
4. Grafana
Grafana is a Data visualization tool that fetches the metrics from Prometheus and displays them as colorful and useful dashboards.
It can be integrated with almost all available tools in the market. For more info please visit Grafana Official Documentation
To deploy the Prometheus stack, we will be using the following DevOps Tools
1. Terraform
Terraform is one of the most popular Infrastructure as a Code tools created by HashiCorp. It allows developers to provide the entire infrastructure with code. Please refer to this terraform-archives for more related blogs.
We will use Terraform to provision the EC2 instance required for the setup.
2. Docker
Docker is a tool for packaging, deploying, and running applications in lightweight. If you want to learn about the basics of Docker, refer to the Docker basics blog.
We will deploy Prometheus components and Grafana on Docker containers.
3. Docker Compose
A Docker-based utility to run a multi-container Docker application. It allows you to define and configure the application's services, networks, and volumes in a simple, human-readable YAML file.
Project IaC Code Explained
All the IaC codes and configs used in this setup are hosted on the DevOps Projects Github repository.
Clone the DevOps projects repository to your workstation to follow the guide.
git clone https://github.com/techiescamp/devops-projectsThe project code is present in the 04-prometheus-observability-stack folder. cd into the folder.
cd 04-prometheus-observability-stackNote: Use visual studio code or relevant IDE to understand the code structure better.
Here is the project structure and config files.
.
├── LICENSE
├── Makefile
├── README.md
├── SECURITY.md
├── alertmanager
│   └── alertmanager.yml
├── docker-compose.yml
├── prometheus
│   ├── alertrules.yml
│   ├── prometheus.yml
│   └── targets.json
└── terraform-aws
    ├── README.md
    ├── modules
    │   ├── ec2
    │   │   ├── main.tf
    │   │   ├── outputs.tf
    │   │   ├── user-data.sh
    │   │   └── variables.tf
    │   └── security-group
    │       ├── main.tf
    │       ├── outputs.tf
    │       └── variables.tf
    ├── prometheus-stack
    │   ├── main.tf
    │   ├── outputs.tf
    │   └── variables.tf
    └── vars
        └── ec2.tfvars
Let's understand the project files.
The alertmanager folder contains the alertmanager.yml file which is the configuration file. If you have details of the email, slack, etc. we can update accordingly.
The Prometheus folder contains alertrules.yml which is responsible for the alerts to be triggered from Prometheus to the alert manager.
The prometheus.yml config is also mapped to the alert manager endpoint to fetch, and Service discovery is used with the help of a file `file_sd_configs` to scrape the metrics using the targets.json file.
terraform-aws directory allows you to manage and isolate resources effectively. Modules contain the reusable Terraform code. These contain the Terraform configuration files (main.tf, outputs.tf, variables.tf) for the respective modules.
The EC2 module also includes user-data.sh script to bootstrap the EC2 instance with Docker and Docker Compose. The security group module will create all the inbound & outbound rules required.
Prometheus-stack contains the configuration file main.tf required for running Terraform. Vars contains an ec2.tfvars file which contains variable values specific to all the files for the terraform project.
The Makefile is used to update the provisioned AWS EC2's public IP address within the configuration files of prometheus.yml and targets.json located in the Prometheus directory.
The docker-compose.yml file incorporates various services Prometheus, Grafana, Node exporter & Alert Manager. These services are mapped with a network named 'monitor' and have an 'always' restart flag as well.
Docker Images
We are using the following latest official Docker images available from the Docker Hub Registry.
Now that we have learned about the tools and tech and IaC involved in the setup, lets get started with the hands-on installation.
Provision Server Using Terraform
Modify the values of ec2.tfvars file present in the terraform-aws/vars folder. You need to replace the values highlighted in bold with values relevant to your AWS account & region.
If you are using us-west-2, you can continue with the same AMI ID.
# EC2 Instance Variables
region         = "us-west-2"
ami_id         = "ami-03fd0aa14bd102718"
instance_type  = "t4g.micro"
key_name       = "techiescamp"
instance_count = 1
volume-size = 20

# VPC id
vpc_id  = "vpc-0a5ca4a92c2e10163"
subnet_ids     = ["subnet-058a7514ba8adbb07"]

# Ec2 Tags
name        = "prometheus-stack"
owner       = "techiescamp"
environment = "dev"
cost_center = "techiescamp-projects"
application = "monitoring"
Now we can provision the AWS EC2 & Security group using Terraform.
cd terraform-aws/prometheus-stack/
terraform fmt
terraform init
terraform validate
Execute the plan and apply the changes.
terraform plan --var-file=../vars/ec2.tfvars
terraform apply --var-file=../vars/ec2.tfvars
Before typing 'yes' make sure the desired resources are being created. After running Terraform, the Output should look like the following:
Apply complete! Resources: 2 added, 0 changed, 0 destroyed.

Outputs:

instance_public_dns = [
  "ec2-34-216-95-97.us-west-2.compute.amazonaws.com",
]
instance_public_ip = [
  "34.216.95.97",
]
instance_state = [
  "running",
]
Now we can connect to the AWS EC2 machine just created using the public IP. Replace the key path/name and IP accordingly.
ssh -i ~/.ssh/techiescamp.pem ubuntu@34.216.95.97We will check the cloud-init logs to see if the user data script has run successfully.
tail /var/log/cloud-init-output.logBelow is an example output. It should show the Docker and Docker Compose versions highlighted in the image.
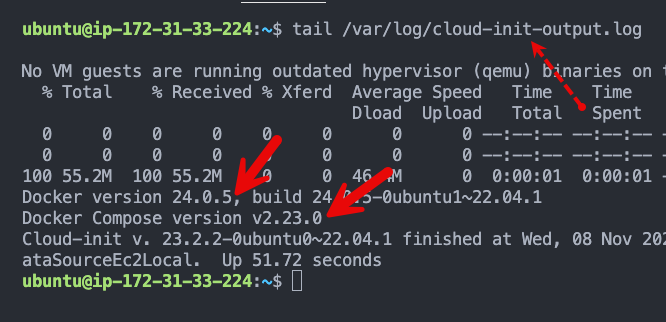
Let's verify the docker and docker-compose versions again.
sudo docker version
sudo docker-compose version
Now that the instance is ready with the required utilities, let's deploy the Prometheus stack using Docker Compose.
Deploy Prometheus Stack Using Docker Compose
First, clone the project code repository to the server.
git clone https://github.com/techiescamp/devops-projects
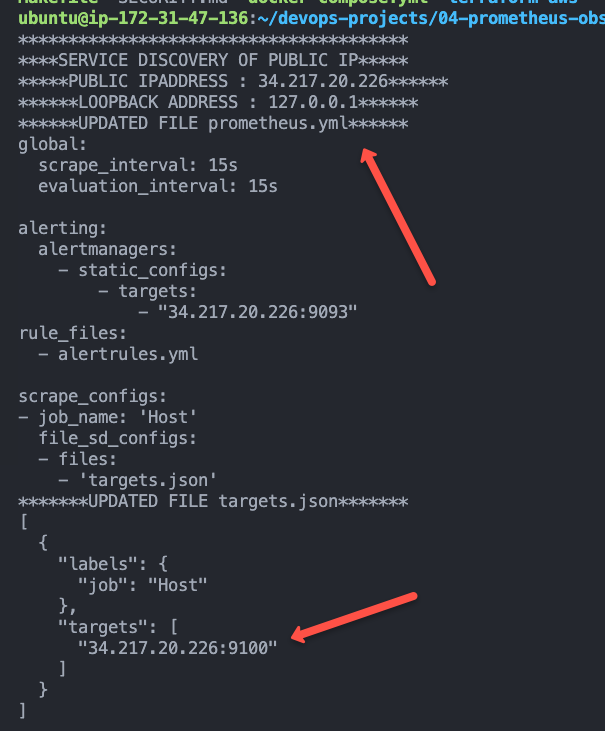
cd devops-projects/04-prometheus-observability-stackExecute the following make command to update the server IP in the Prometheus config file.
We are running the node exporter on the same server to fetch the server metrics. We also update the alert manager endpoint to the server's public IP address.
make allYou should see an output as shown below.
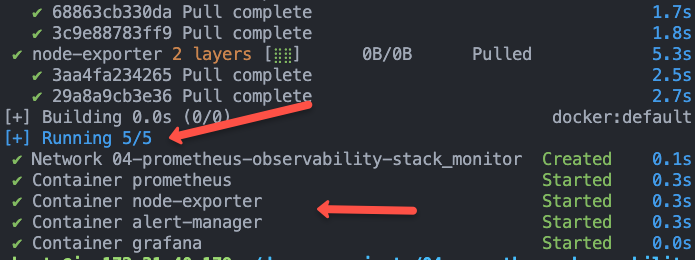
Bring up the stack using Docker Compose. It will deploy Prometheus, Alert Manager, Node exporter, and Grafana
sudo docker-compose up -dOn a successful execution, you should see the following output saying Running 5/5
Now, with your servers IP address you can access all the apps on different ports.
- Prometheus: http://your-ip-address:9090
- Alert Manager: http://your-ip-address:9093
- Grafana: http://your-ip-address:3000
Now that the stack deployment is done, the rest of the configuration and testing will be done using the GUI.
Validate Prometheus Node Exporter Metrics
If you visit http://your-ip-address:9090, you will be able to access the Prometheus dashboard as shown below.
Validate the targets, rules, and configurations as shown below. The target would be the Node exporter URL.
Now let's execute a promQL statement to view node_cpu_seconds_total metrics scraped from the node exporter.
avg by (instance,mode) (irate(node_cpu_seconds_total{mode!='idle'}[1m]))You should be able to data in graph as shown below.
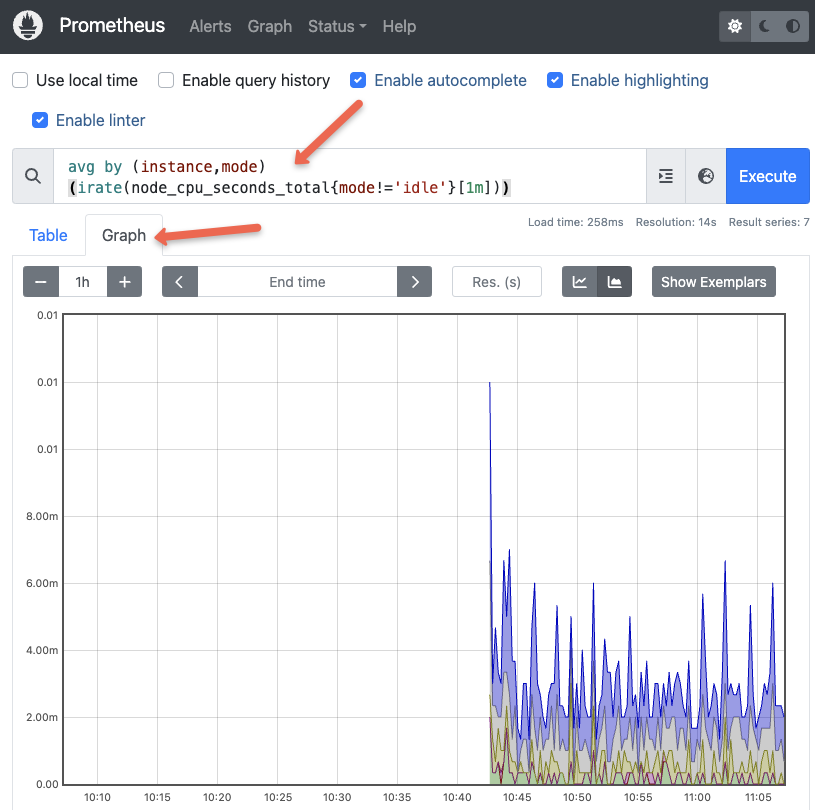
Configure Grafana Dashboards
Now, let's configure Grafana dashboards for the Node Exporter metrics.
Grafana can be accessed at: http://your-ip-address:3000
Use admin as the username and password to log in to Grafana.
Now we need to add the Prometheus URL as the data source from Connections→ Add new connection→ Prometheus → Add new data source.
Here is the demo.
Configure Node Exporter Dashboard
Grafana has many pre-built node exporter templates to give us a ready-to-use dashboard for the key node exporter metrics.
To import a dashboard, go to Dashboards --> Create Dashboard --> Import Dashboard --> Type 10180 and click load --> Select Prometheus Data source --> Import
Here is the demo.
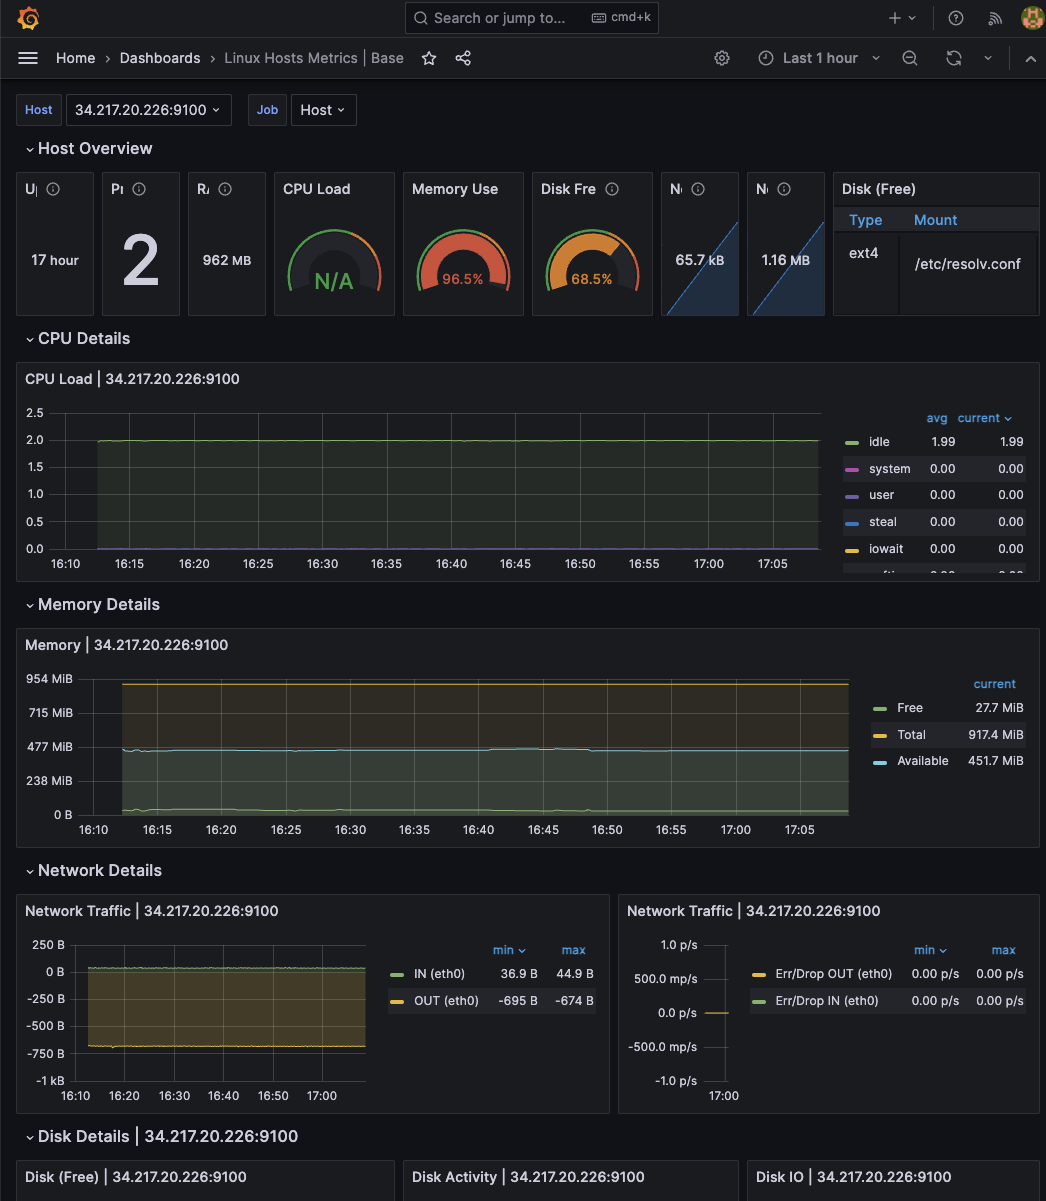
Once the dashboard template is imported, you should be able to see all the node exporter metrics as shown below.
Simulate & Test Alert Manager Alerts
You can access the Alertmanager dashboard on http://your-ip-address:9093
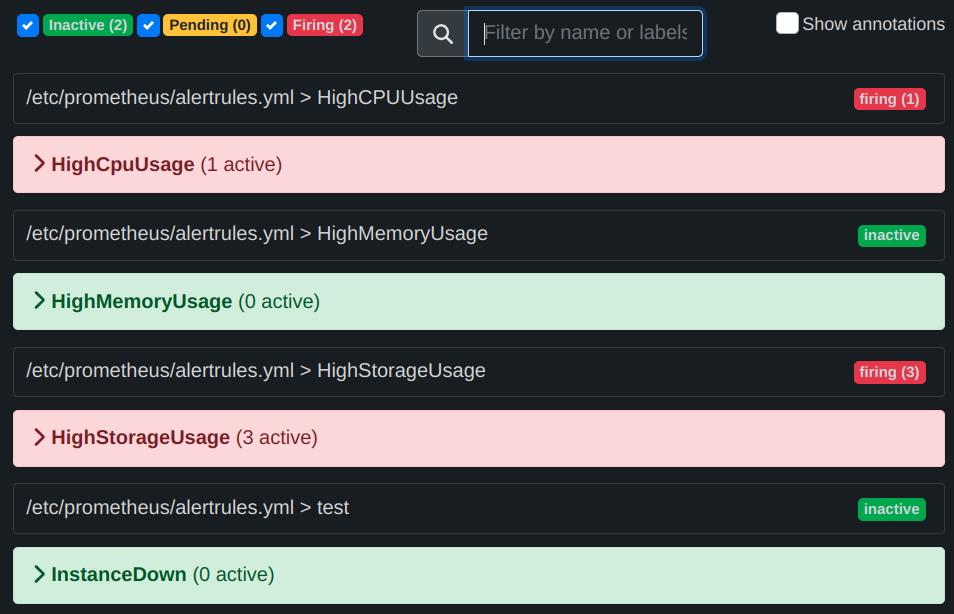
Alert rules are already backed into the Prometheus configuration through alertrules.yaml. If you go to the alerts option in the Prometheus menu, you will be able to see the configured alerts as shown below.
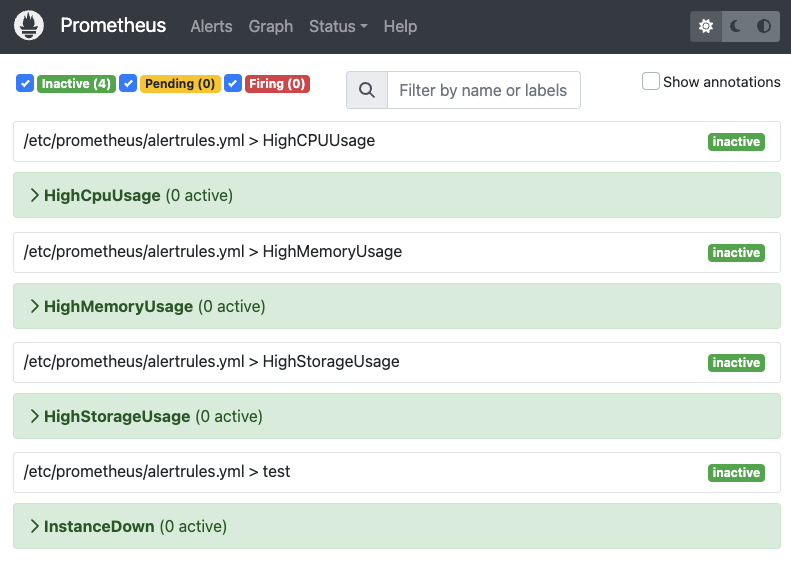
As you can see, all the alerts are in the inactive stage. To test the alerts, we need to simulate these alerts using a few Linux utilities.
You can also check the alert rules using the native promtool prometheus CLI. We need to run promtool command from inside the prometheus container as shown below.
sudo docker exec -it prometheus promtool check rules /etc/prometheus/alertrules.ymlTest: High Storage & CPU Alert
dd if=/dev/zero of=testfile_16GB bs=1M count=16384; openssl speed -multi $(nproc --all) &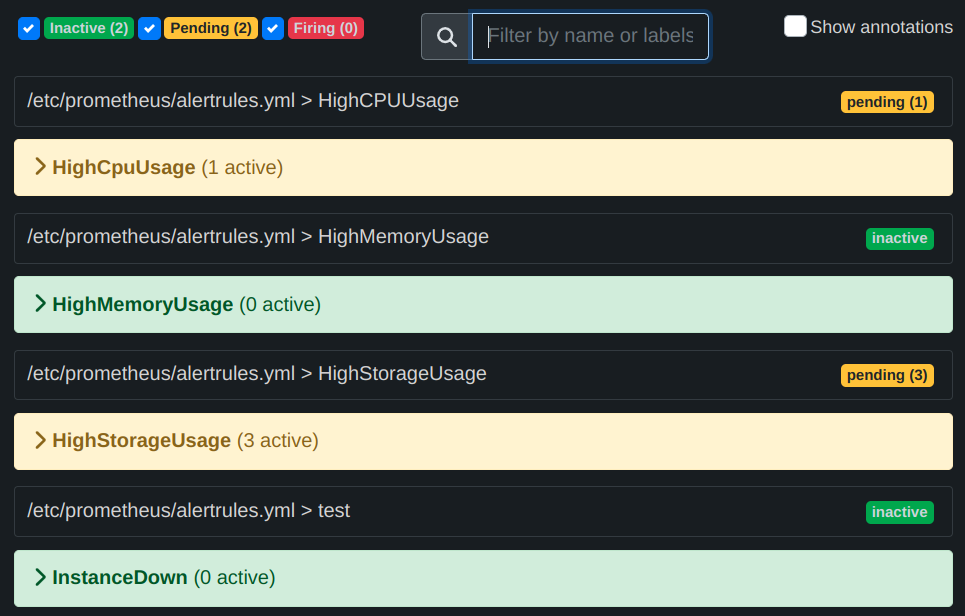
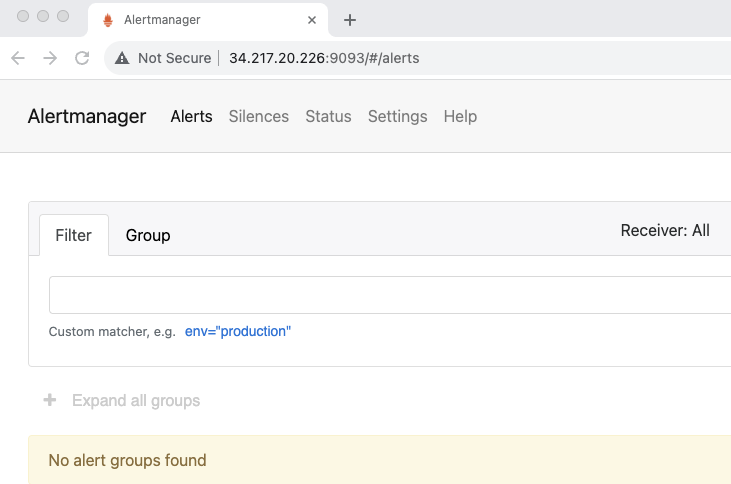
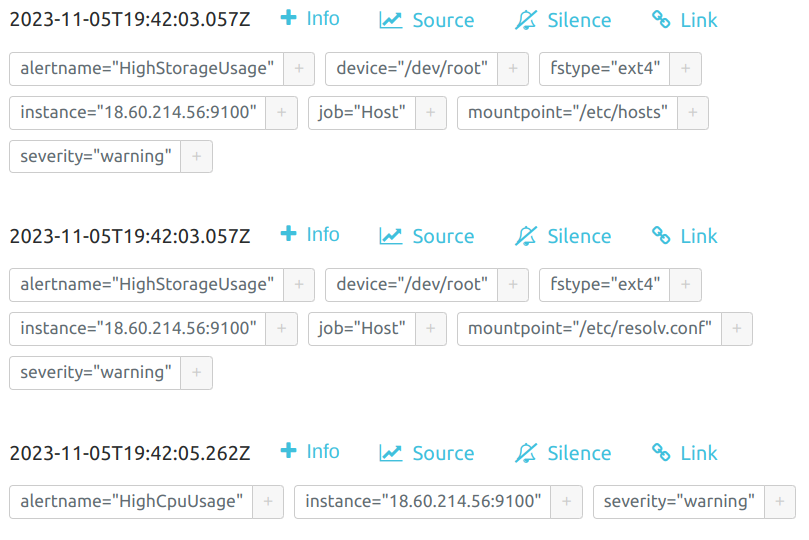
Now we can check the Alert Manager UI to confirm the alerts that were fired.
Now let's rollback the changes and see the fired alerts has been resolved.
rm testfile_16GB && kill $(pgrep openssl)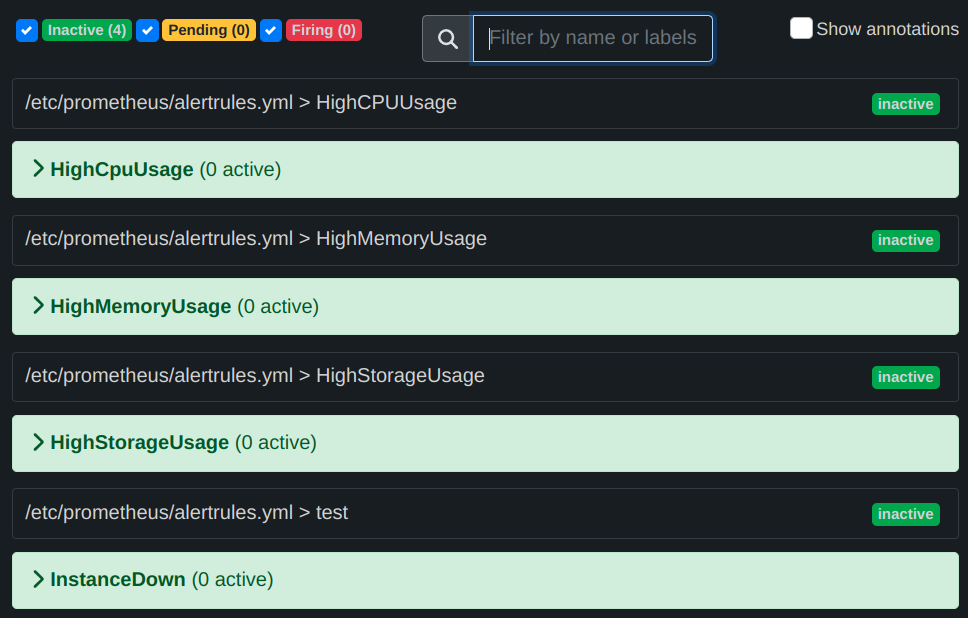
Cleanup The Setup
To tear down the setup, execute the following Terraform command from your workstation.
terraform destroy --var-file=../vars/ec2.tfvarsPossible Errors
If you don't have the correct EC2 AMI ID set in the vars file, you will get the following error. To rectify the issue, update the correct AMI ID related to the region you are using.
Error: creating EC2 Instance: InvalidAMIID.NotFound: The image id '[ami-0a75bd84854bc95c9]' does not exist
│       status code: 400, request id: 34d38d4d-c3b8-47e6-9c27-1b1cbccbab83
Conclusion
As a quick recap we learned to provision the AWS infra using Terraform.
Then we brough up the Prometheus Observability stack using Docker compose and configured Grafana to create Node Exporter metrics dashboard.
Also we simulated alerts to check the validate the alerting.
If you're facing any kind of issues, let me know in the comments section.
If you are interested in Prometheus certification (PCA), check out our Prometheus Certified Associate exam Guide.
