
If you want to understand what is Observability, its importance, its benefits, and its components, this guide is for you.
What Is Observability?
The literal meaning of Observability is the state of being observable.
In IT, Observability is defined as the ability to measure a system's current state based on the output data (such as logs, metrics, and traces) it generates.
The OpenTelemetry website clearly and concisely describes observability.
Observability lets us understand a system from the outside, by letting us ask questions about that system without knowing its inner workings. Furthermore, it allows us to easily troubleshoot and handle novel problems (i.e. “unknown unknowns”), and helps us answer the question, “Why is this happening?”
opentelemetry.io
Ask questions about that system means, the ability to gather information and insights about how a system is performing and behaving.
Let's look at a practical example.
Imagine you're managing a ecommerce website with many micoservices like Frontend service, product service, Cart Service, Order Service, Payment Service etc.
And the website suddenly starts loading slowly.
Without observability, you might have to dig through code, Database response time, API latency, Third party service latencies and check various components manually to find the issue.
However, with observability tools in place, you can "ask questions" like:
- What is the average response time of the website over the last hour?
- Are there any spikes in error rates?
- Which specific service or component is taking the longest to respond?
- How are the database query response times?
- Is there a particular type of request or transaction that is experiencing delays?
- Is the slowdown consistent across all users, or is it specific to a particular region?
These questions can be answered through the data provided by the application logs, metrics, and traces.
- Logs record events that happen in the application through logging libraries.
- Metrics provide numerical data about the system's operation (such as response times and the number of requests). Applications are instrumented using libraries to emit metrics.
- Traces track the journey of a request through various services in a distributed system, using libraries such as OpenTelemetry or APM (Application Performance Monitoring) agents.
By analyzing this data, you can pinpoint, for example, that the slowdown is due to a particular service that's taking too long to respond, possibly because of a recent code change or an increased load. This allows for quicker and more efficient problem-solving.
Now you might think, it all sounds like typical monitoring. But it's not. Let's understand the difference between monitoring and Observability.
Difference Between Observability & Monitoring
It's really important for DevOps engineers or someone who has just started their way into SRE to thoroughly understand the difference between Observability v/s Monitoring.
Here is what DORA's research says about observability & monitoring.
Monitoring is tooling or a technical solution that allows teams to watch and understand the state of their systems. Monitoring is based on gathering predefined sets of metrics or logs.
Observability is tooling or a technical solution that allows teams to actively debug their system. Observability is based on exploring properties and patterns not defined in advance.
devops-research.com
Monitoring is about keeping an eye on known issues and application/system metrics.
It involves setting up alerts and thresholds for specific metrics (like CPU usage, memory usage, response times, Database query execution times, 4xx, 5xx error rates, etc.) and other documented monitoring KPIs to notify teams when something goes wrong.
So the key focus of monitoring is to track the status and health of systems based on predefined metrics and logs.
For Example, a monitoring tool, sends an alert when the server's CPU usage goes above 80%, or when the response time of an API exceeds 2 seconds.
Observability,their on the other hand, goes a step further.
It's about understanding the internal state of the applications and systems by looking at their outputs (like logs, metrics, and traces). It's not just about knowing when something goes wrong, but also understanding why it went wrong.
The key Focus of Observability is more exploratory and investigative, allowing you to ask arbitrary questions about the application's behavior and diagnose issues that you didn't anticipate.
For example, when a website starts slowing down unexpectedly, you use observability tools to analyze data patterns, trace requests, and review logs to identify that a recent code deployment caused a memory leak, leading to slower response times.
Simply put, monitoring tells you that a system has failed, and Observability helps you find out why that system failed.
Now that we have an overall understanding of Observability, let's look at the key Observability concepts.
Observability Concepts
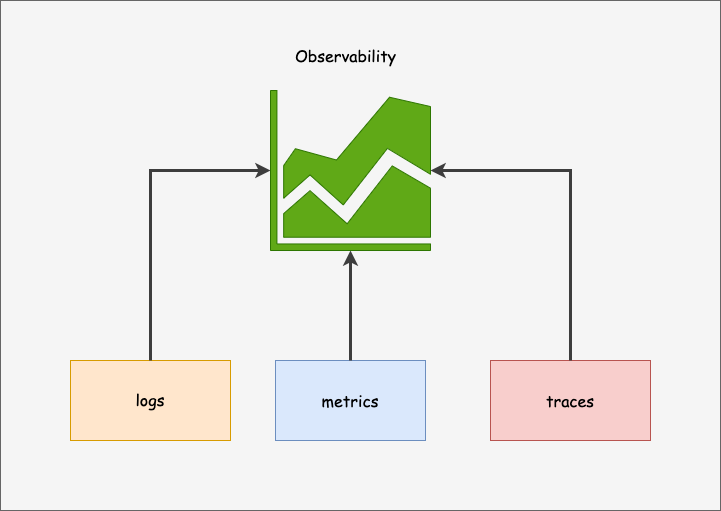
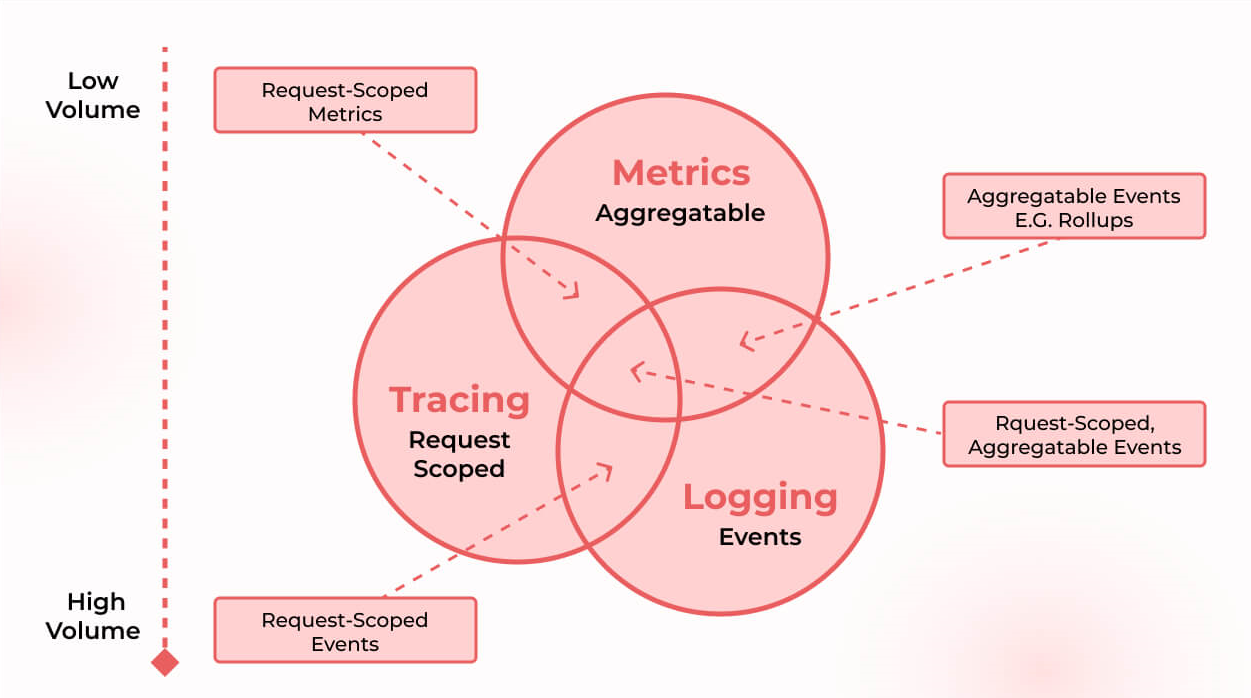
The following are the three key verticals of observability.
- Metrics
- Logs
- Traces
Logs
A log is a record of an event in your application. A log entry typically contains information about the event that occurred, including a timestamp, event description, severity level, and sometimes additional context, such as user IDs or session IDs.
2023-11-20 10:15:32 INFO  UserService: Starting getUserById for userId=12345
2023-11-20 10:15:32 DEBUG UserService: Fetching user data from database for userId=12345
2023-11-20 10:15:33 INFO  UserService: User data retrieved successfully for userId=12345
2023-11-20 10:15:34 WARN  UserService: User 12345 has outdated profile information
2023-11-20 10:15:35 ERROR UserService: Failed to send notification email to userId=12345, email=johndoe@example.com
2023-11-20 10:15:35 INFO  UserService: getUserById completed for userId=12345
Developers are responsible for logging code. Since most software libraries and languages have built-in functionality, logs are simple to implement. The following are a few examples of different types of log formats.
- Plain Text: simplest form of logging in human readable text.
- Structured: Log entries structured in machine-readable format (JSON, XML, etc)
- Binary Format: Logs stored in binary format (Protobuf logs, MySQL Binary Logs, Systemd Journal Logs, etc)
- Custom format: To serve specific project requirements.
Metrics
Metrics are data represented in numbers measured over intervals of time.
For example, node_memory_MemAvailable_bytes metric in prometheus shows the amount of available memory in bytes. The http_request_duration_seconds metric tracks the duration of HTTP requests.
Here is an example of metrics generated by Prometheus exporters.
http_requests_total{method="post",code="200"} 1027
http_requests_total{method="post",code="400"} 3
http_request_duration_seconds_bucket{le="+Inf"} 134091
http_request_duration_seconds_sum 52123
http_request_duration_seconds_count 134091
node_memory_MemAvailable_bytes 2.147483648e+09
node_cpu_seconds_total{mode="user"} 9123.42
Metrics play a key role in observability. With metrics, you can understand the state of your system at a glance and over time, helping you identify trends and patterns in system behavior at different times.
Traces & Spans
"Traces" and "spans" are terms primarily used in distributed tracing.
Distributed tracing is a method used to track and monitor the flow of requests through distributed systems, particularly in microservices architectures.
Let's look at an example of an e-commerce application built using microservices.
When a user places an order, the request travels through multiple services: it first hits the order processing service, which then communicates with the inventory, payment, and user account services.
Distributed tracing will track this request across all these services.
Here, trace represents the entire journey of a single order request through the system. Each trace consists of multiple spans, where each span represents a specific operation or process within the trace.
A span could be a call to a microservice, a database query, or any other discrete unit of work.
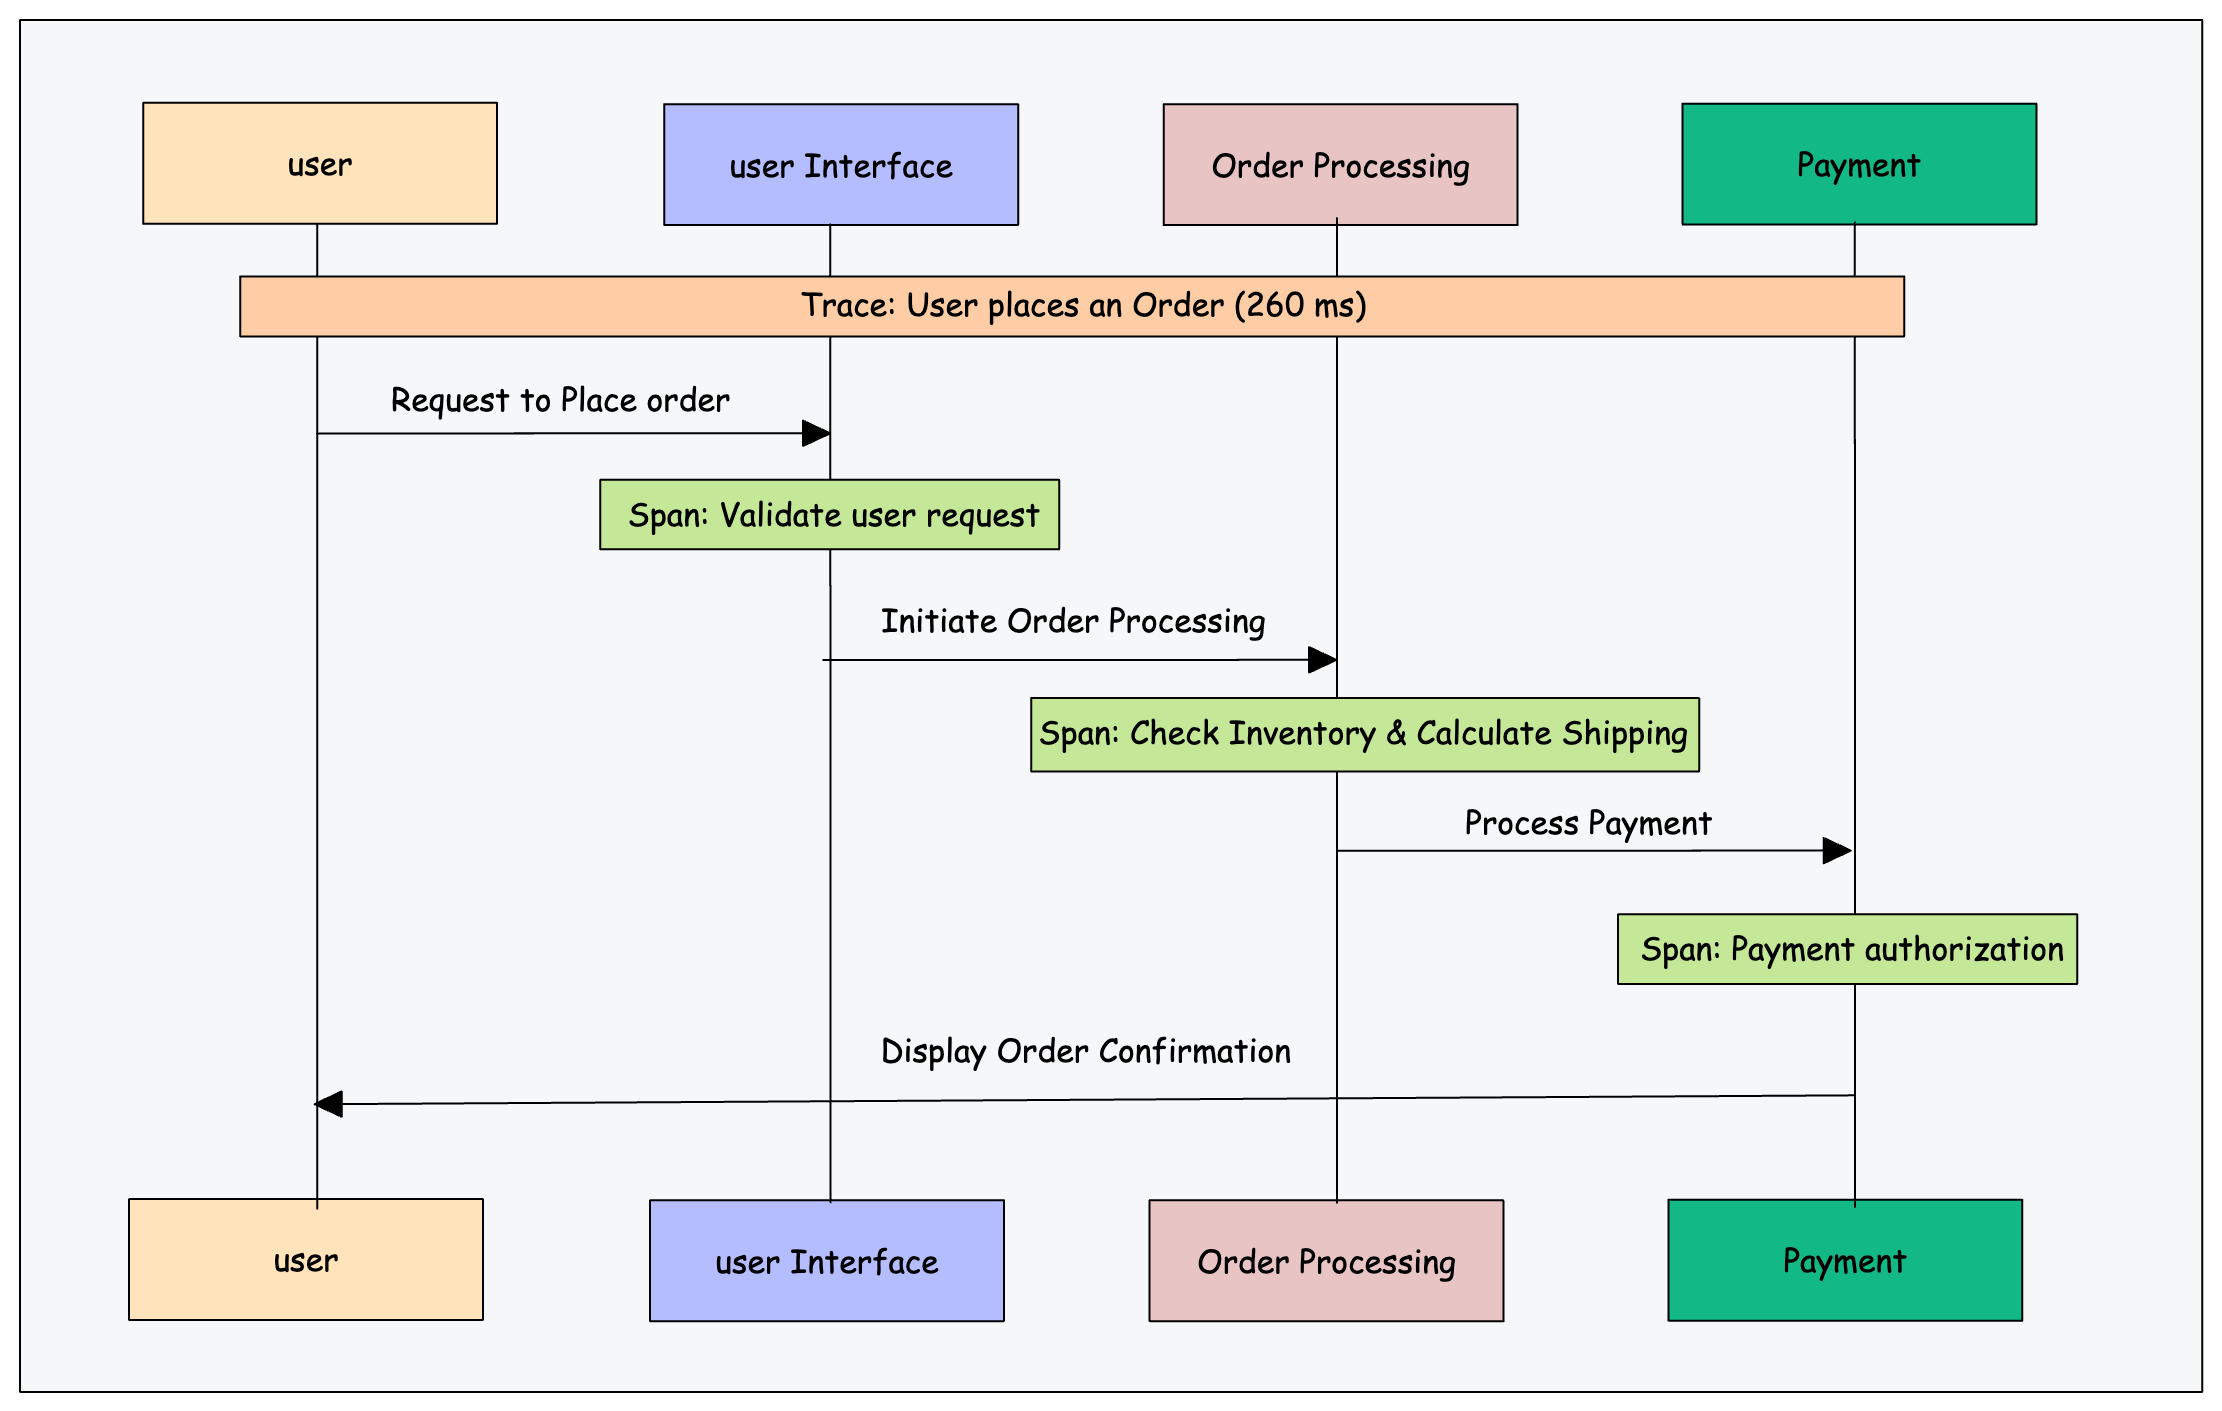
By analyzing traces, developers can identify bottlenecks, understand the impact of different components on the system’s performance, and troubleshoot issues.
Open source distributed tracing tools like Jaeger or Zipkin can show the sequence of spans as a timeline, making it easier to understand the flow and latency of requests.
How Does Observability Work?
Observability platforms continuously identify and gather performance telemetry by integrating existing instrumentation embedded into application and infrastructure components and offering tools to add instrumentation to these components.
Most of the platform gathers metrics, traces, and logs. And then, connect them in real-time to provide DevOps teams, site reliability engineering (SRE) teams, and IT personnel with thorough contextual information — the what, where, and why of every event that can indicate, contribute to, or be used to address an application performance issue.
Why is Observability Important?
Thanks to Observability, cross-functional teams who work on highly distributed systems, especially in an enterprise environment, can react more quickly and effectively to precise queries.
One can identify what's slowing down the application's performance and work towards fixing it before it impacts the overall performance or leads to downtime.
The benefits of Observability extend beyond IT use cases. When you gather and examine observability data, you have a window into the effects your digital services are having on your organization.
This access enables you to monitor the results of your user experience Service Level Objectives (SLOs), verify that software releases meet business goals, and prioritize business decisions based on what matters most.
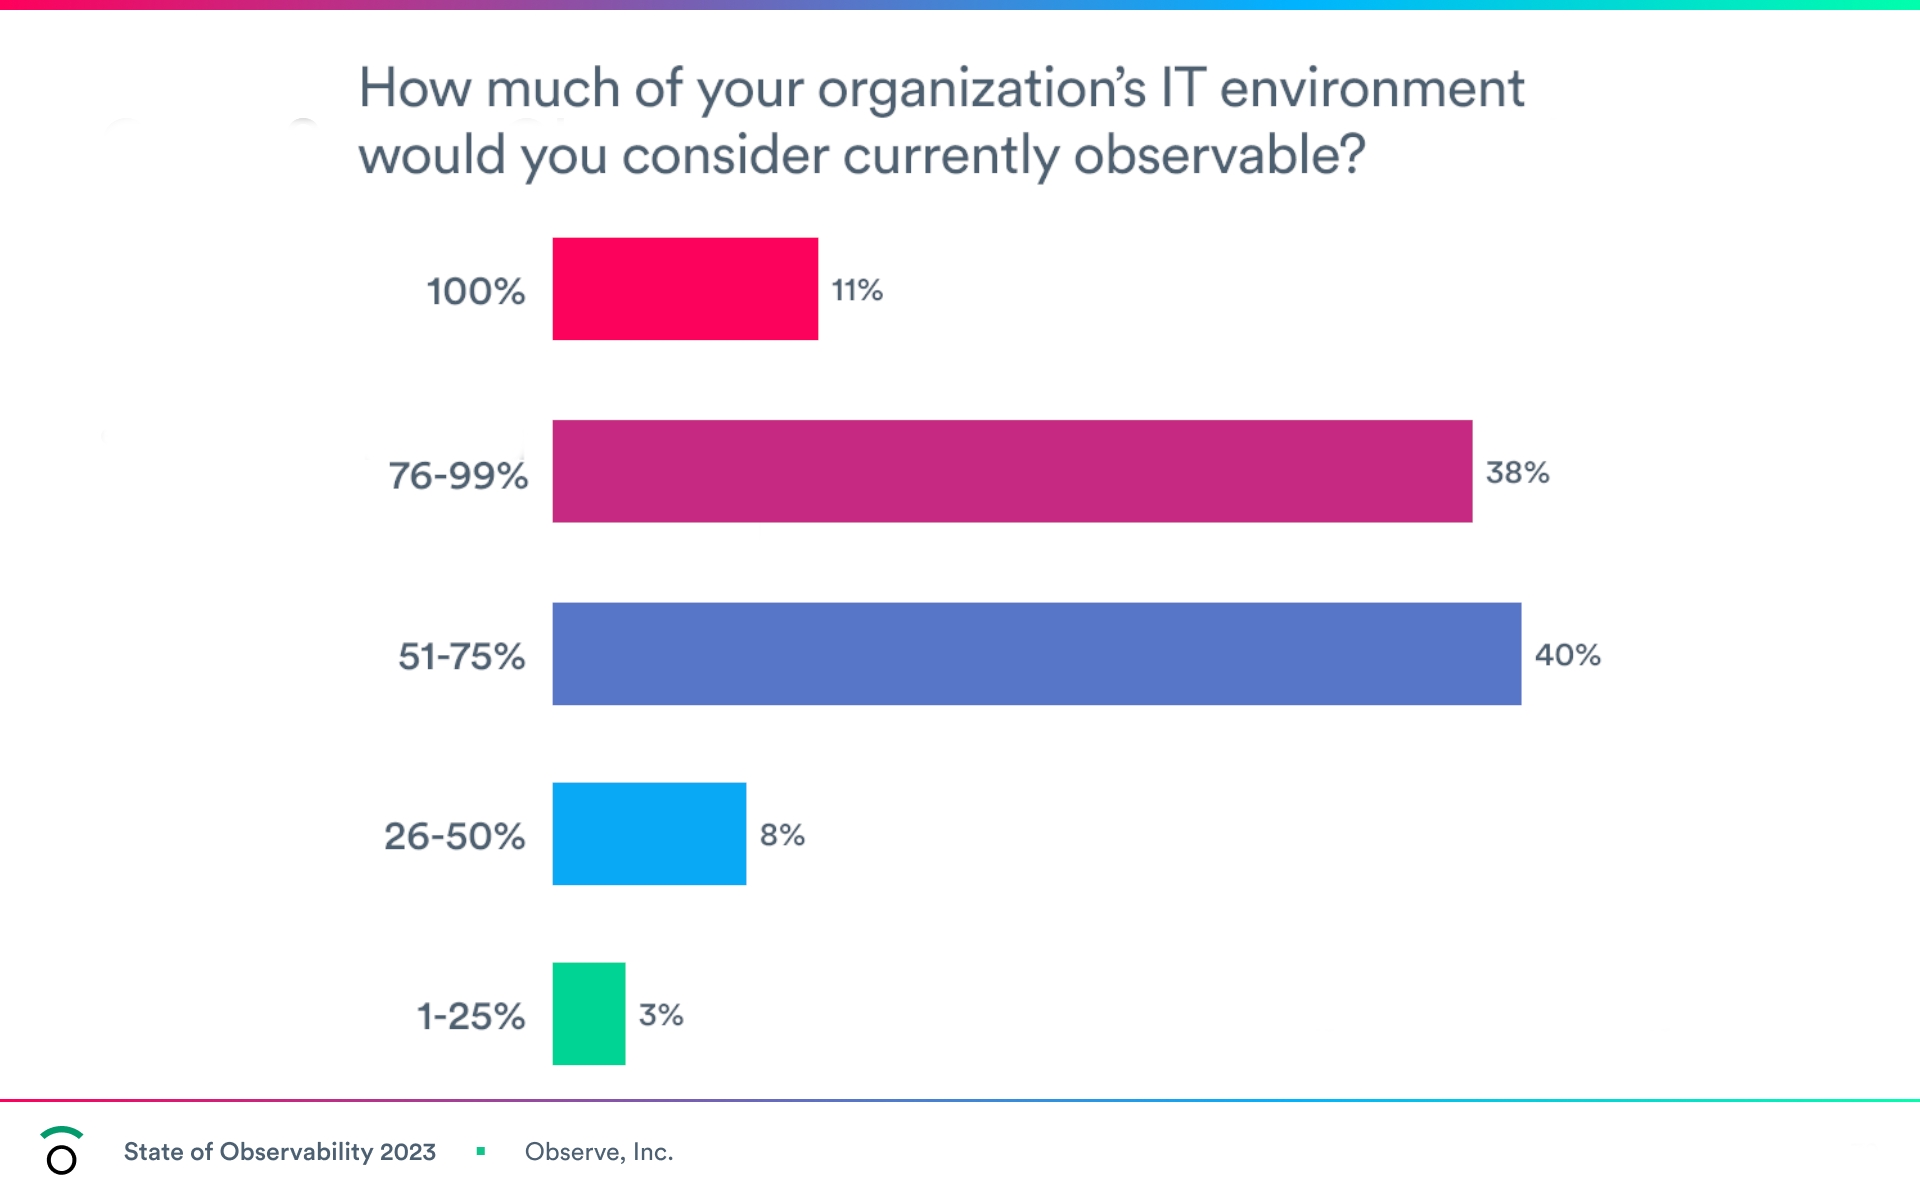
As per Observe state of Observability report, 91% of organizations say they currently practice observability. However, only 11% of organizations think their entire environment is currently observable.
What are the Benefits of Observability
Observability offers significant advantages to end users, enterprises, and IT teams. The following are significant benefits and why Observability matters:
- Application performance monitoring: Complete end-to-end Observability enables businesses to identify performance problems considerably more quickly, even those brought on by cloud-native and microservices architectures. More tasks can be automated with the use of an advanced observability solution, which will boost productivity and creativity among the Ops and Apps teams.
- DevSecOps and SRE: Observability is a fundamental characteristic of an application and the infrastructure that supports it, not only the outcome of implementing innovative tools. The software's designers and developers must make it easy to observe. Then, during the software delivery life cycle, DevSecOps and SRE teams can utilize and understand the observable data to create stronger, more secure, and more resilient applications.
- Monitoring for infrastructure, the cloud, and Kubernetes: One of the several benefits of using observability is that it helps with Infrastructure monitoring. It enables Infrastructure and operations (I&O) teams can take advantage of the improved context an observability solution offers to increase application uptime and performance, reduce the time needed to identify and fix problems, detect cloud latency issues and optimize resource utilization to improve the administration of their Kubernetes environments & contemporary cloud architectures.
- End-user experience: A positive user experience can boost a business's reputation and income, giving it a competitive advantage. Companies can increase customer satisfaction and retention by identifying and fixing problems before the end user recognizes them and implementing improvements before they are even requested.
What are the Challenges of Observability?
Although Observability has always been difficult, the complexity of clouds and the quickening of change have made it vital for enterprises to address. Cloud systems produce much higher telemetry data when microservices and containerized applications are involved. Additionally, they generate a much more comprehensive range of telemetry data than teams have ever had to decipher in the past.
Regarding Observability, organizations frequently encounter the following difficulties:
- Data Silos: It is challenging to comprehend the interdependencies across applications, various clouds, and digital channels, including the web, mobile, and IoT, because of the presence of several agents, divergent data sources, and silos monitoring tools.
- Volume, Speed, Varieties, and Complexity: In constantly evolving modern cloud infrastructures like AWS, Azure, and Google Cloud Platform, the sheer volume of raw data generated from every component makes it nearly impossible to find answers (GCP). The ability of Kubernetes and containers to spin up and down quickly demonstrates this as well.
- Lack of pre-production: Despite load testing in pre-production, developers still lack a means of observing or comprehending how real users would affect apps and infrastructure before pushing code into production.
- Wasting time troubleshooting: Teams from the application, operations, infrastructure, development, and digital experience are brought in to troubleshoot and attempt to pinpoint the source of issues. As a result, valuable time is lost making educated guesses and trying to make sense of telemetry.
How Does Observability Relate to DevOps?
In DevOps, Observability is essential to be considered. It plays a crucial role in the DevOps process as it allows teams to
- Detect Issues in real-time.
- Debugging using observability tools to trace the root cause.
- Performance Optimization
- Continuous Improvement of software & infrastructure
How to Get Started with Observability?
To achieve Observability, your systems and applications must be properly equipped to gather the necessary telemetry data. You can create an observable system by creating your own tools, utilizing open-source software, or purchasing a for-profit observability solution.
Here are a few steps on how to get started with Observability:
- Determine your business goals: By reducing infrastructure spending, supporting growth capacity planning, or enhancing crucial business KPIs like mean time to recovery, a robust observability configuration can help increase bottom-line revenue. By giving the support staff additional contextual data, it can promote transparency or even create a positive client experience. However, the observability configuration for each of these objectives can be very different. Create an observability strategy to accomplish your main business goals after identifying them.
- Focus on the right metrics: Instead of responding to problems as they arise, a well-designed observability method enables one to anticipate the commencement of a probable error or failure and then pinpoint the location of its root causes. The pursuit of transparency involves several data collection and analytics processes, as well as other monitoring and testing technologies.
- Event logs: For architecture and development teams, event logs provide a significant data source on the Observability of distributed systems. Tools designed for event logging, like Prometheus, Middleware, and Splunk, capture and store events. These events could include the successful conclusion of an application procedure, a significant system failure, unanticipated downtime, or traffic influxes that cause overload. Because it provides crucial forensic information for developers to identify flawed components or problematic component interactions, this is particularly important for debugging and error handling.
- Accessible data visualizations: Observability data must be compressed into a usable and shareable format when a team has successfully gathered it. This is frequently accomplished by visual representations of that data using various tools. From there, team members can disseminate or share that information with other teams working on the program.
- Choose the right observability platform: When it comes to choosing the right observability platform, please take into consideration the following factors;
- Is the tool free?
- Does the tool use an open-source agent?
- Is it easy to use?
- Do I have the technical knowledge to use the tool to its full potential?
- What's the amount of data the tool can process?
Answering these and other business-specific questions will help you make an informed decision.
Conclusion
An Observability system needs to be appropriate for its intended platform. In the lack of that, it may either develop into a cumbersome system that drives up operating costs or be unimpressive and offer little visibility.
Therefore, the plan must also specify and name the main inquiries the organizational design must make possible.
Without that direction, Observability risks becoming a confusing web of conflicting issues that may not deliver the anticipated coherent and consistent user experience and support.