Grafana is one of the best open source visualization tools. It can be easily integrated with Prometheus for visualizing all the target metrics.
Visualize Prometheus Metrics In Grafana
In this guide, we will walk you through the following.
- Install and configure Grafana
- Add Prometheus data source to Grafana
- Creating dashboards from Prometheus metrics.
- Importing shared Grafana dashboards
To setup Prometheus and Node exporter metrics, please follow the below tutorials.
If you are new to Grafana dashboards, you can try this online course - Grafana 5.x and Graphite: Monitoring For DevOps
Install and Configure Grafana
Centos/Redhat
1. Get the latest rpm download link from the official downloads page and download it.
cd /tmp
curl -LO  https://s3-us-west-2.amazonaws.com/grafana-releases/release/grafana-5.2.3-1.x86_64.rpm
2. Install the rpm.
sudo yum localinstall grafana-5.2.3-1.x86_64.rpm -yUbuntu/debian
1. Download the debian package.
curl -LO https://s3-us-west-2.amazonaws.com/grafana-releases/release/grafana_5.1.4_amd64.deb2. Install the packages
sudo apt-get install -y adduser libfontconfig
sudo dpkg -i grafana_5.1.4_amd64.deb
Configure Grafana
1. Start and enable the grafana server.
sudo systemctl start grafana-server
sudo systemctl enable grafana-server
2. Access grafana UI on port 3000.
http://<grafana_IP>:3000The default username and password is admin. You will be prompted to change the default passsord.
Add Prometheus Source To Grafana
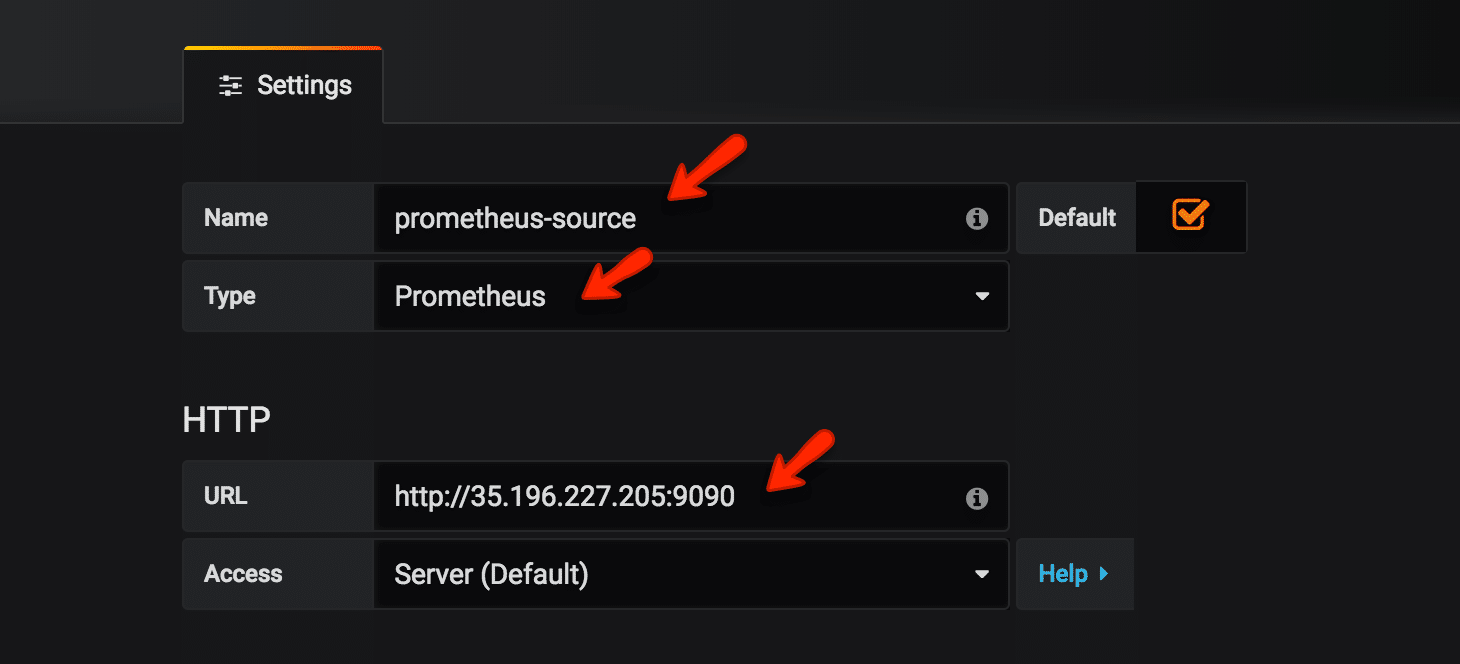
Note: Make sure Prometheus endpoint is accessible from Grafana server.
- Click the "add source" option from the Grafana homepage.
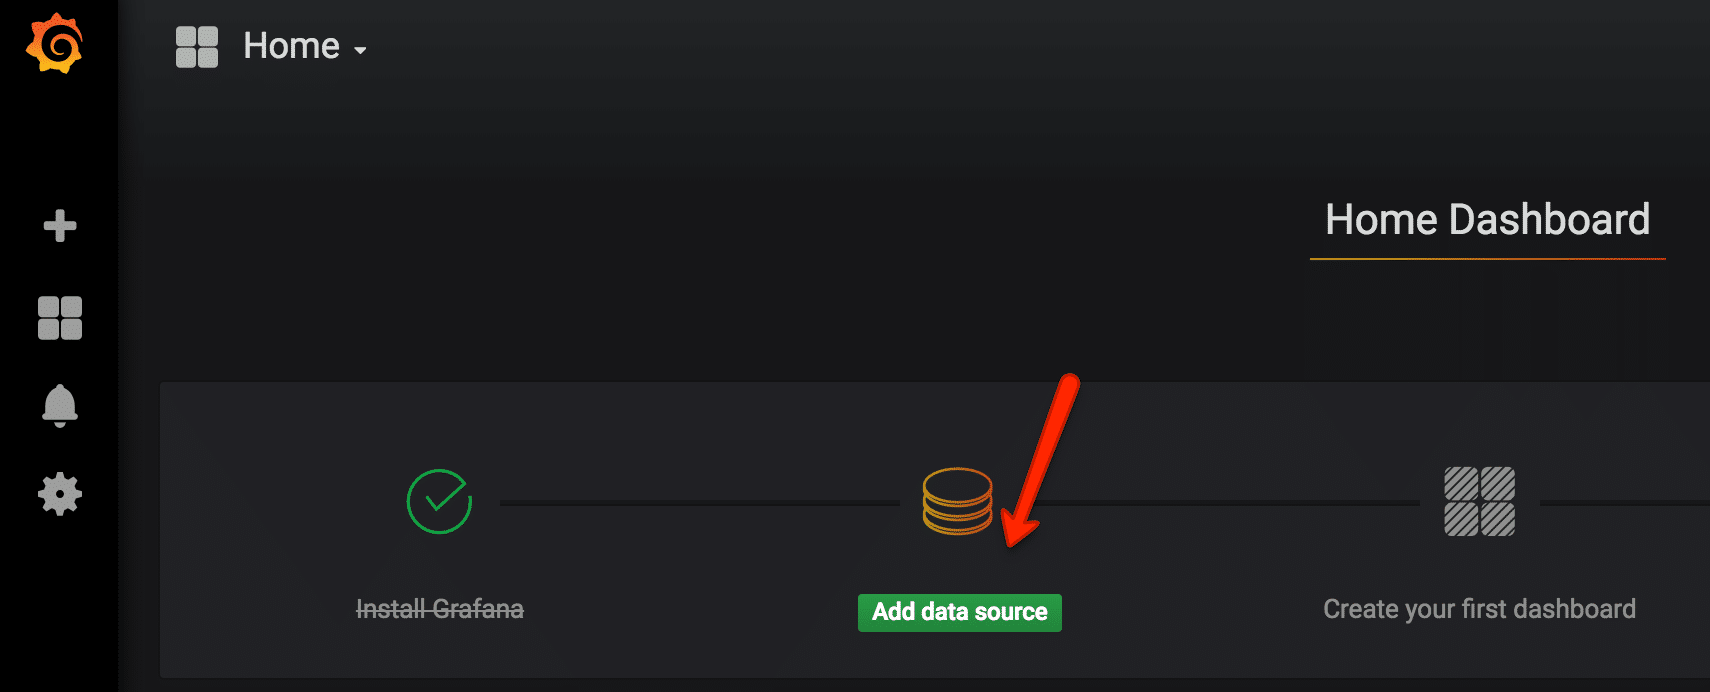
- Add the source name, Prometheus endpoint details and save it.
Create Dashboards From Prometheus Source
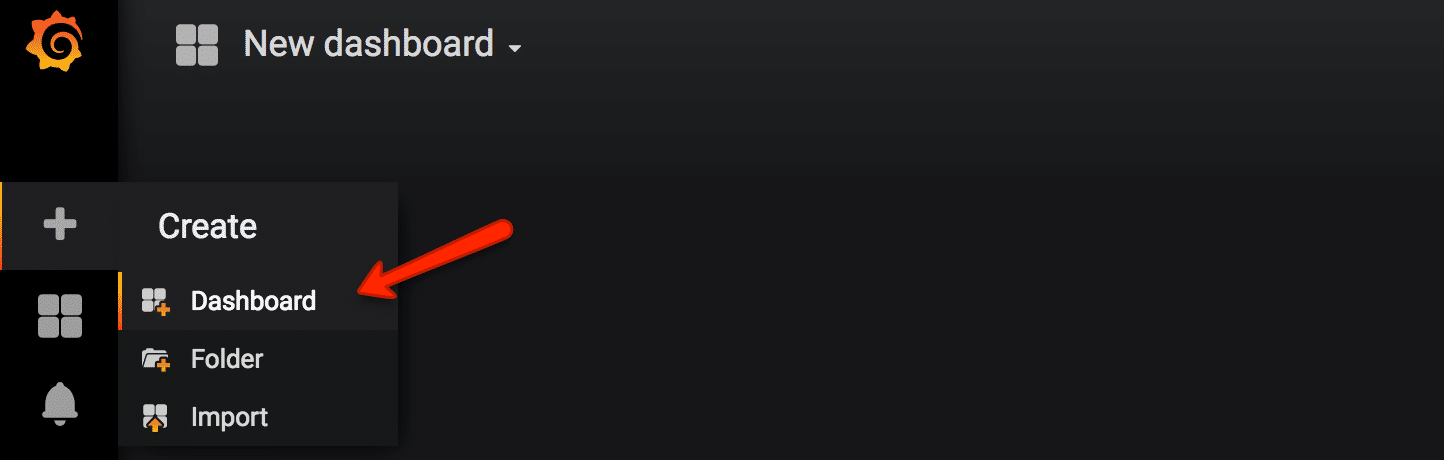
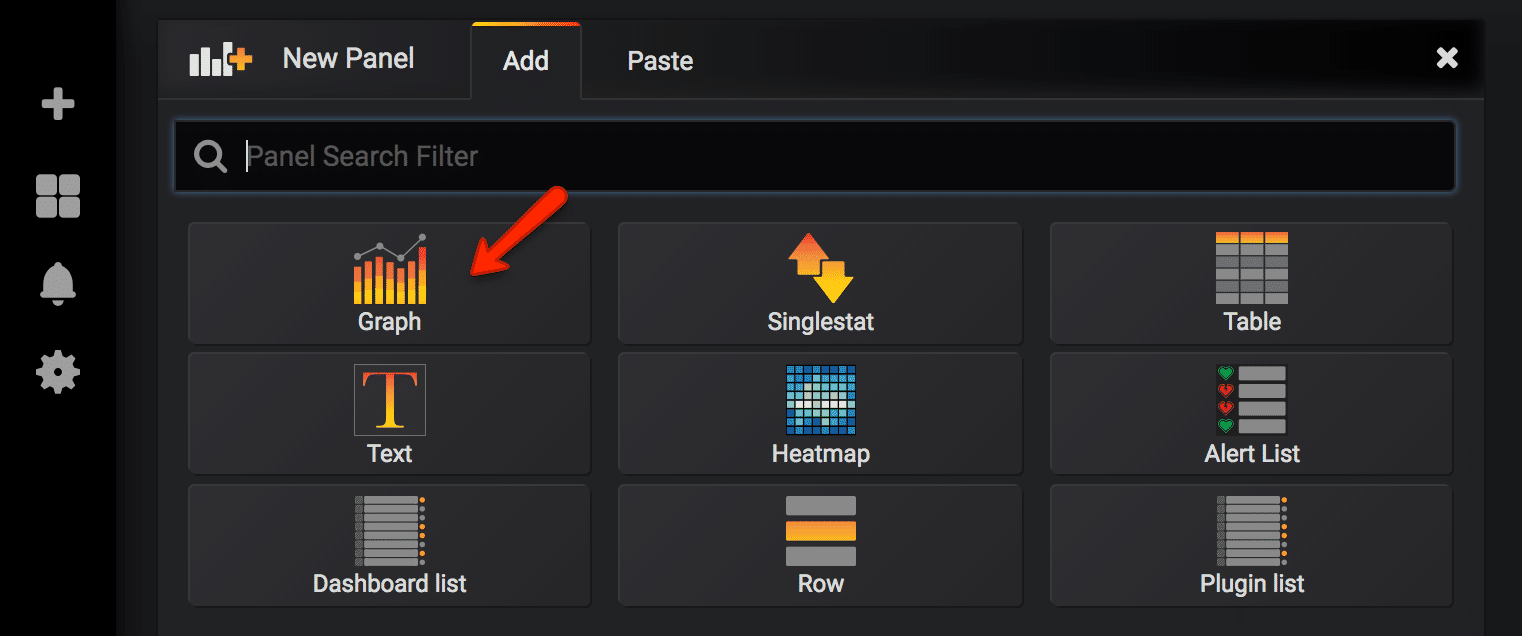
1. Select the create dashboard option as shown below.
- Select the graph type. You can select the type based on the type of visualization and dashboard you need.
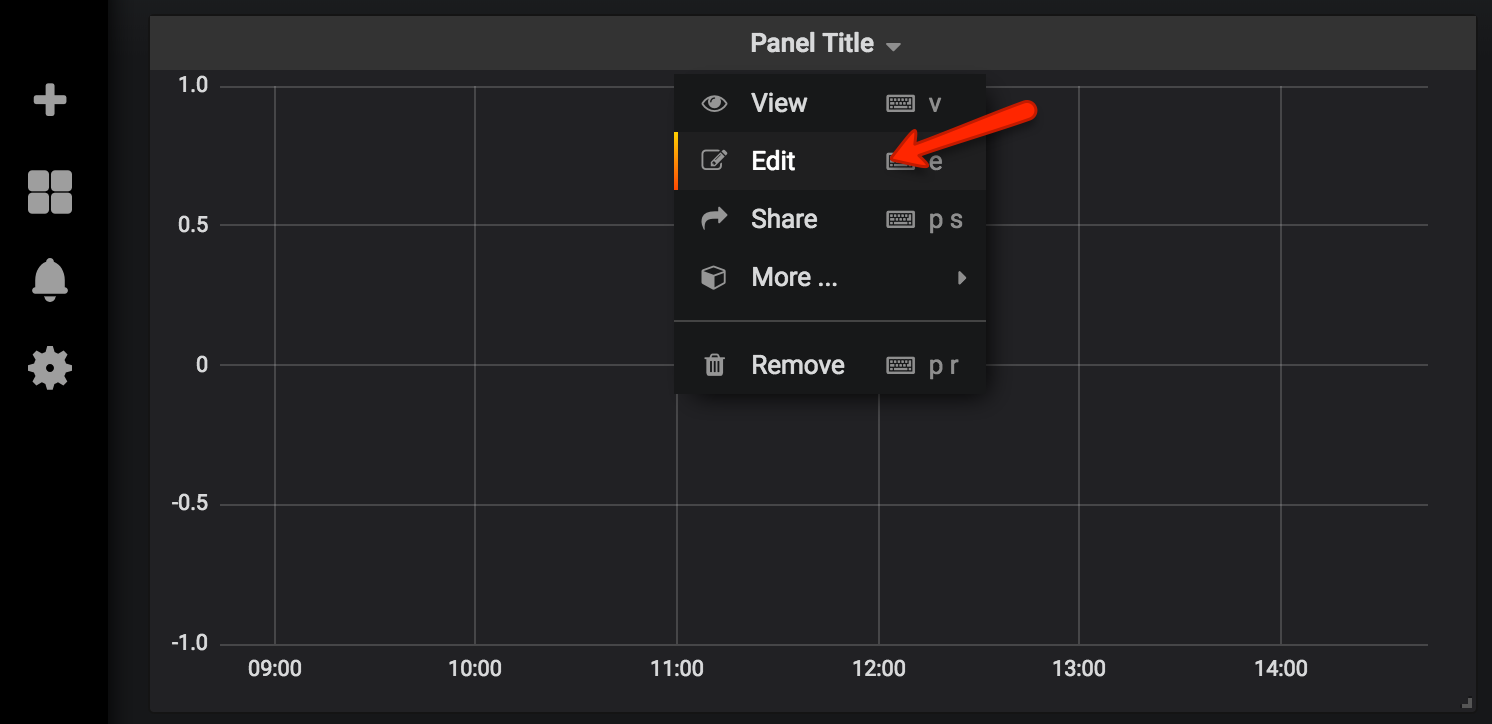
- Select the edit option from the panel top.
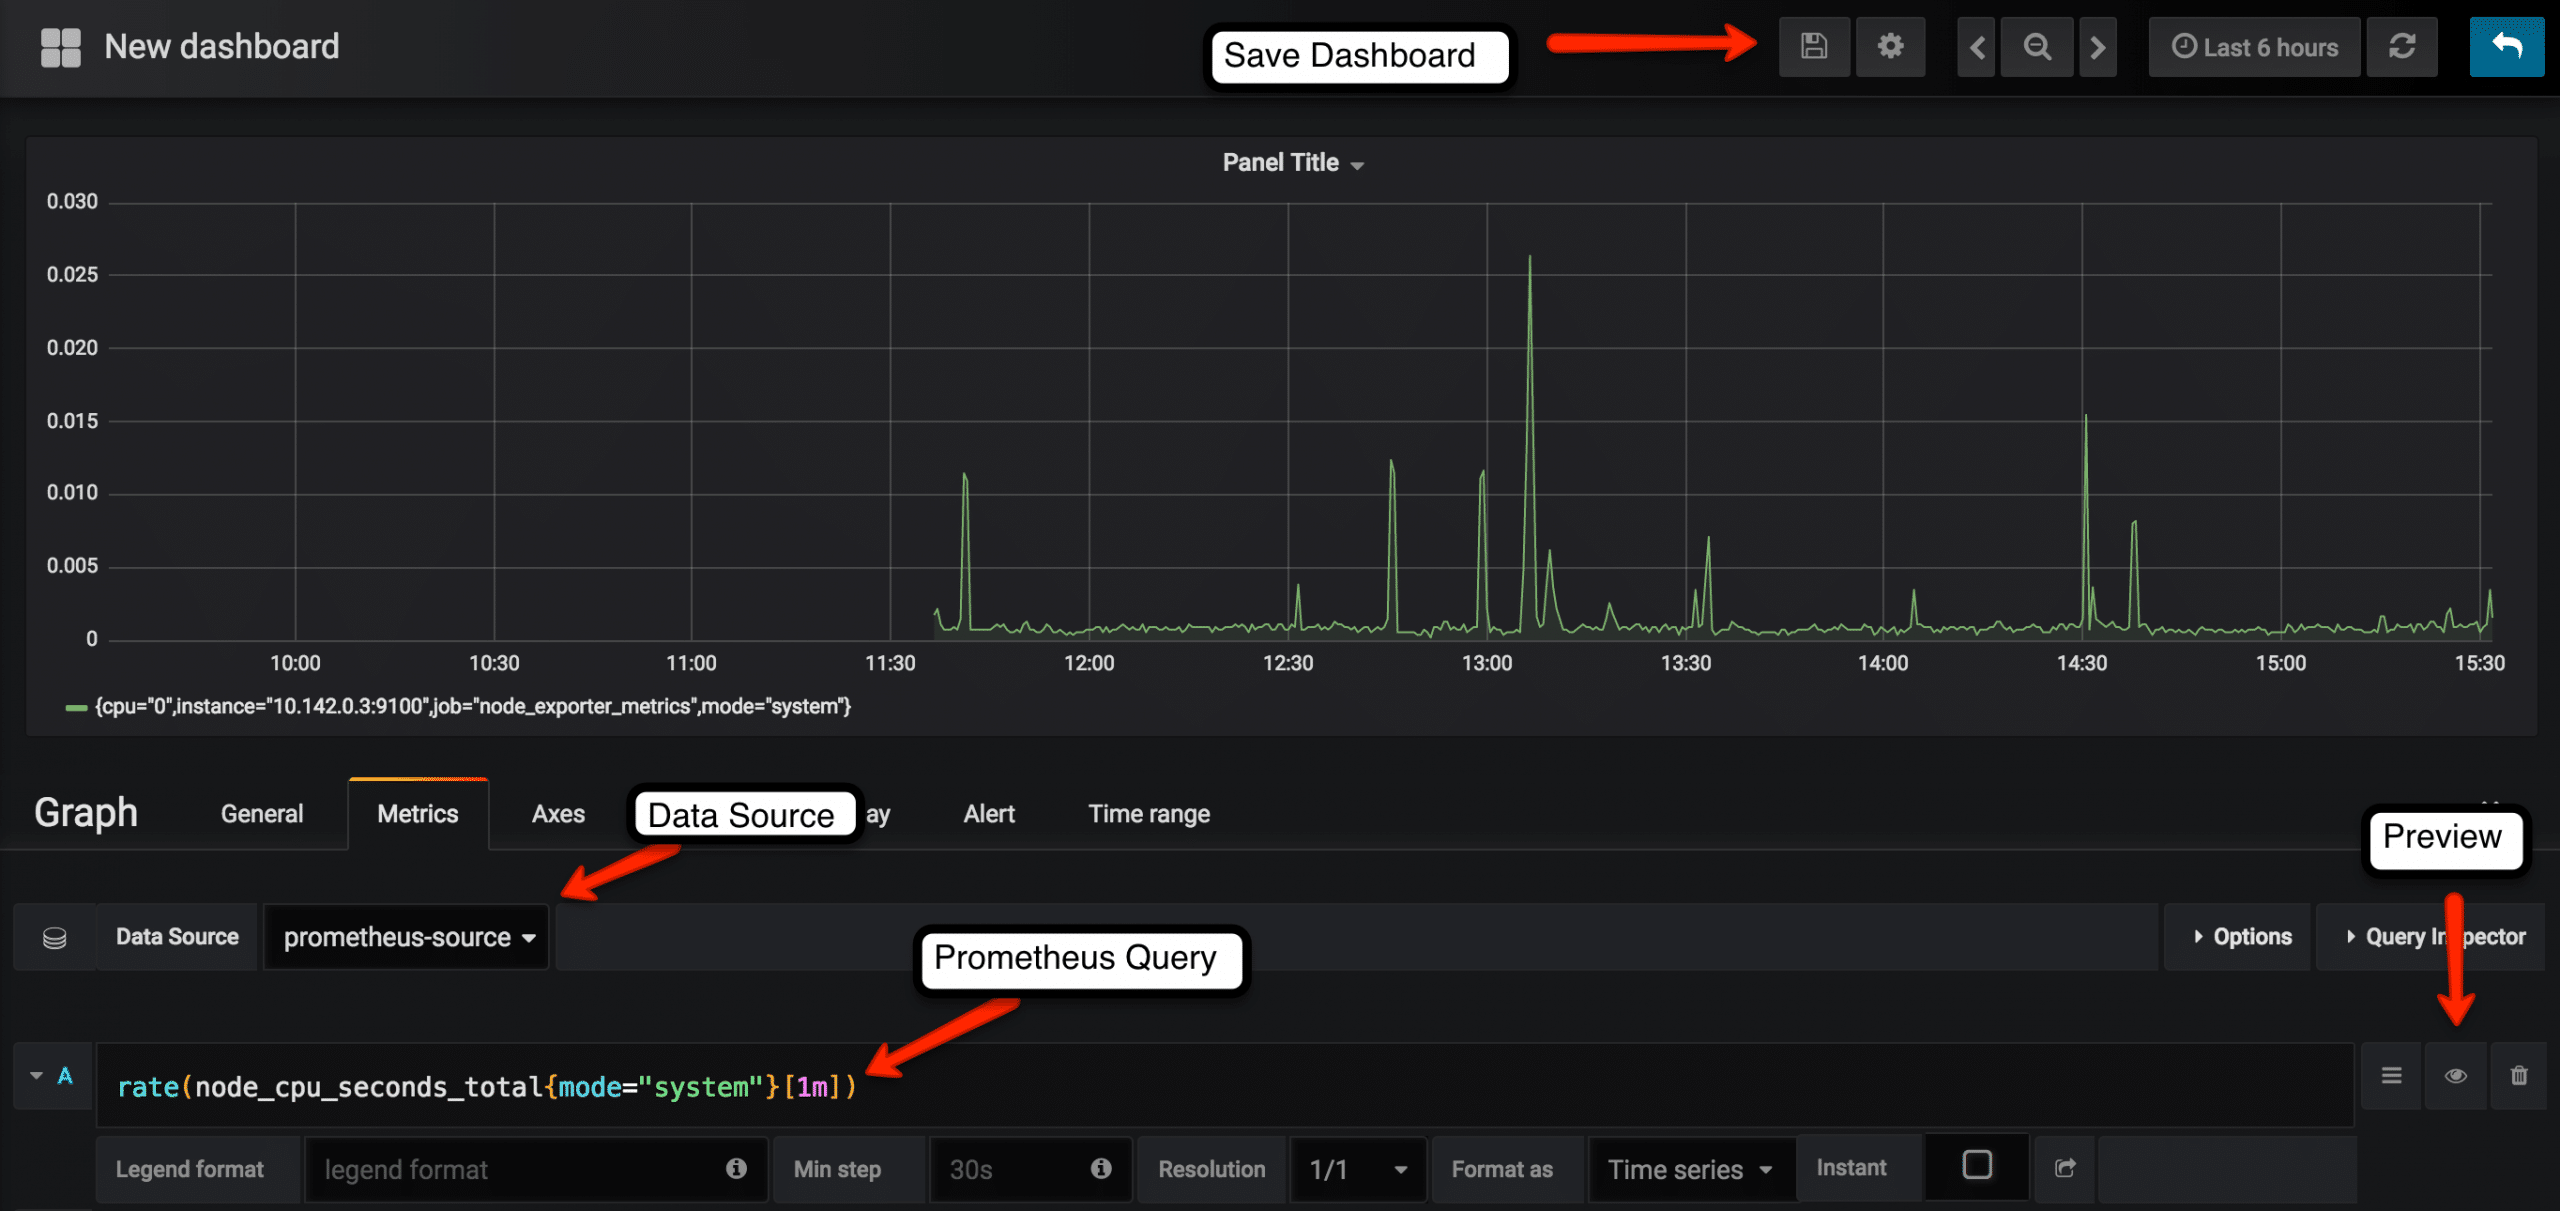
- Select the Prometheus data source and enter the Prometheus expression that has to be graphed under the metrics tab. You can preview the graph using the preview button. Under the general tab, you can assign a name for the dashboard. Save the dashboard after preview.
In the following example, we have given the expression for calculating CPU seconds every minute.
You can find all the saved dashboards under the home option.

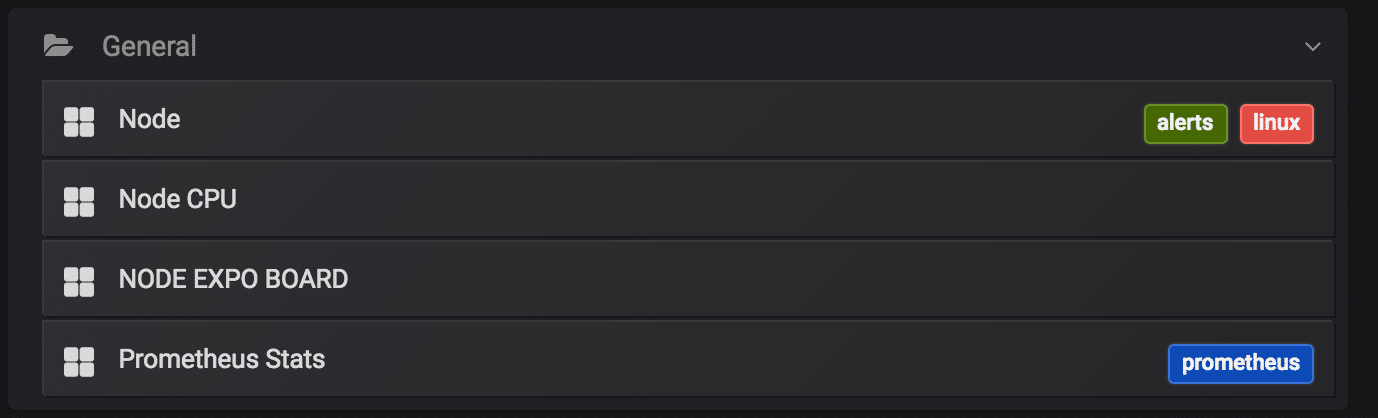
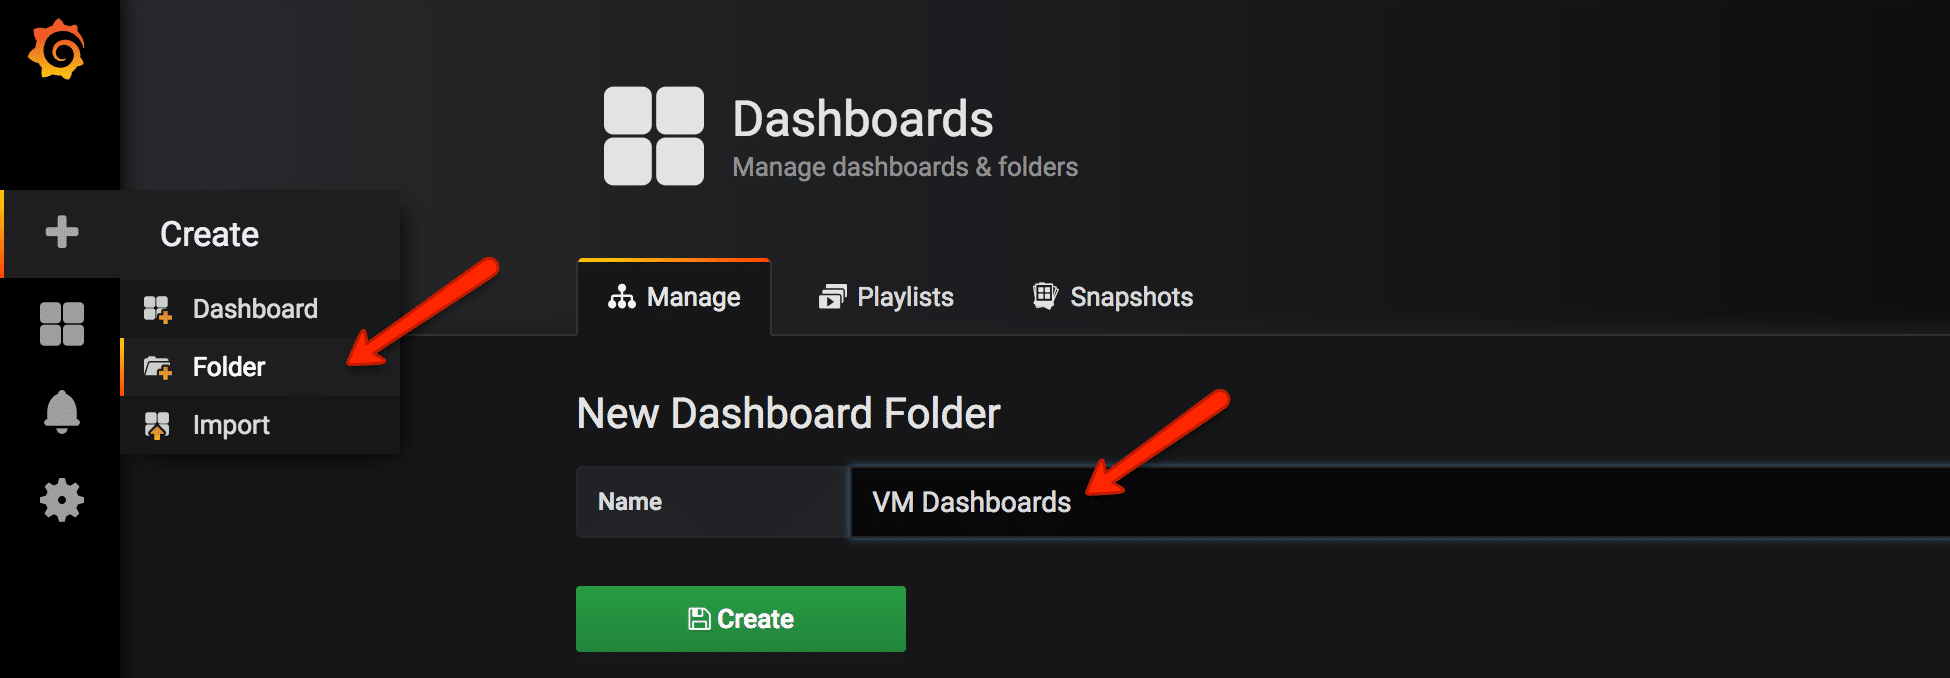
Also, you can organize your dashboards under different folders based on your needs.
Importing Predefined Grafana Dashboard Templates
You can import predefined templates to your Grafana server.
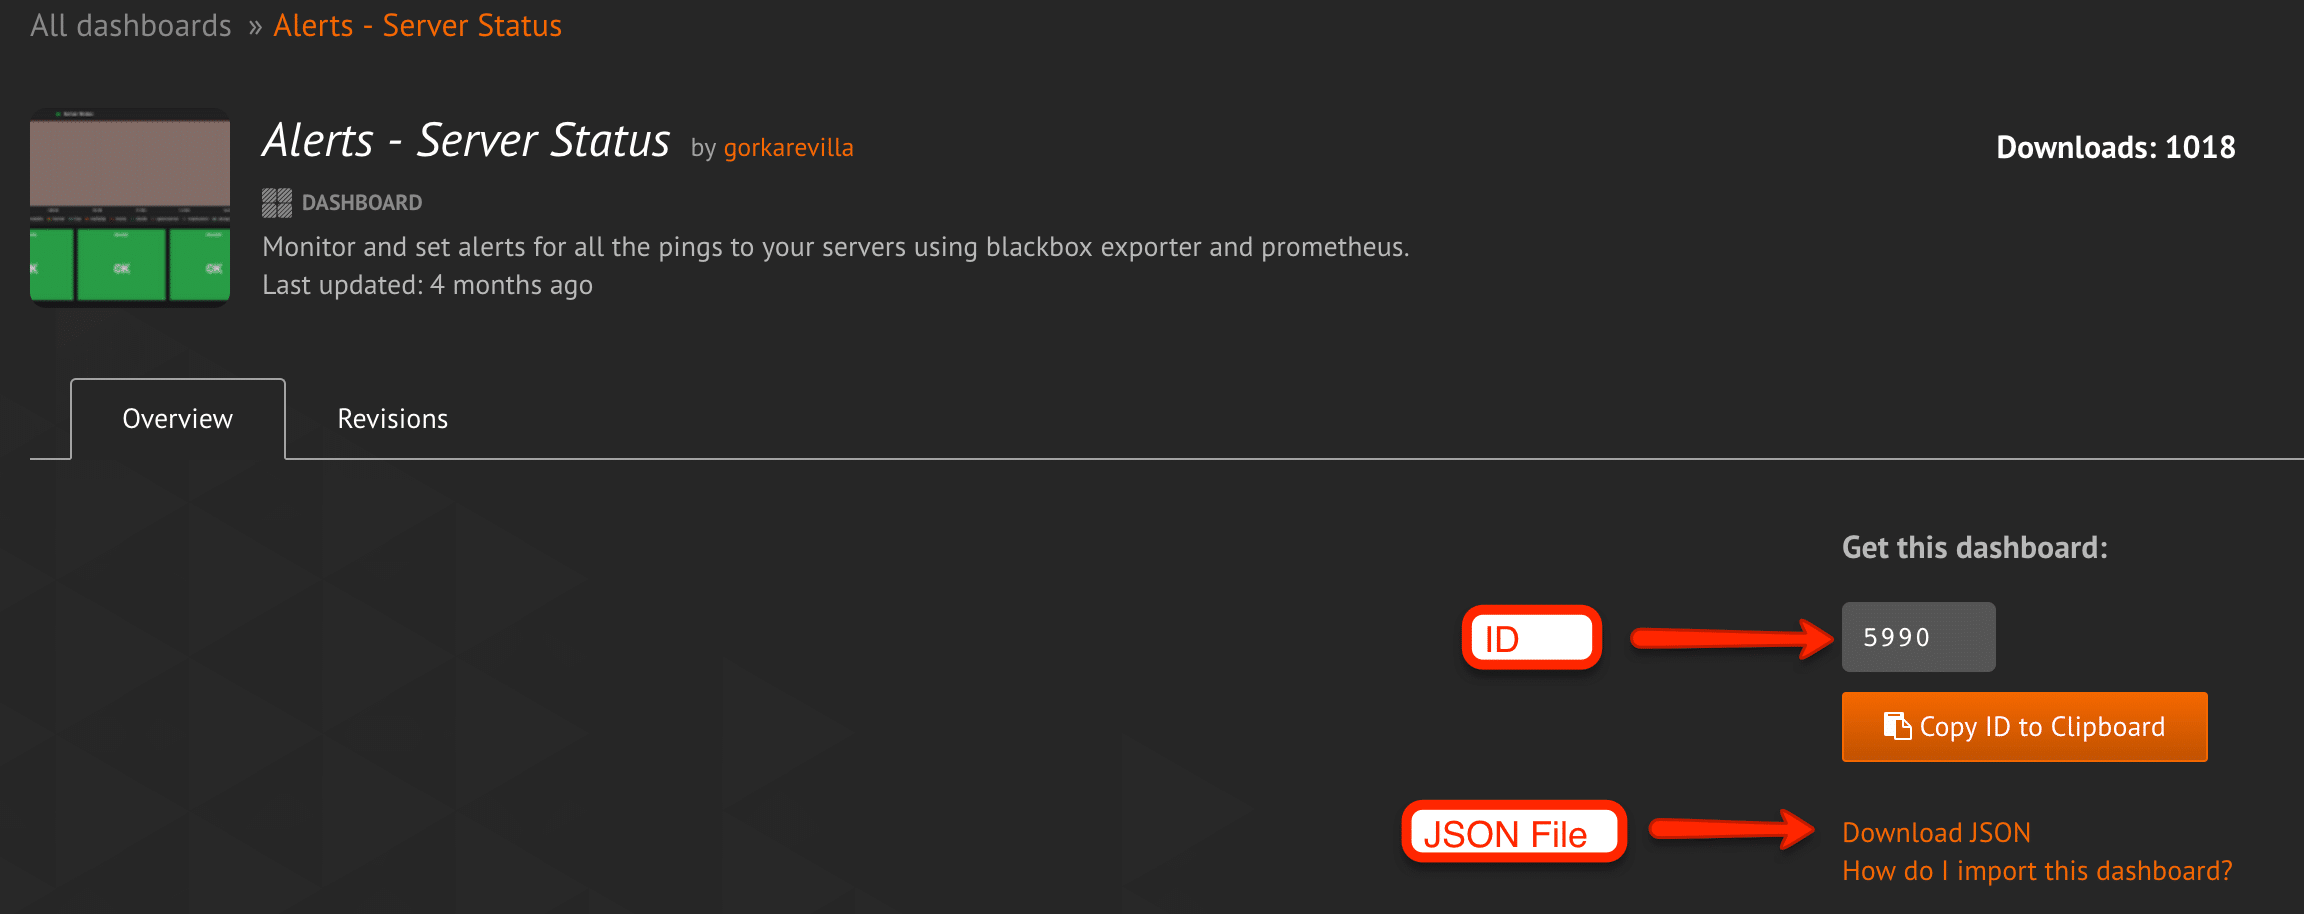
You can find all the shared community dashboards from Grafana Shared Templates
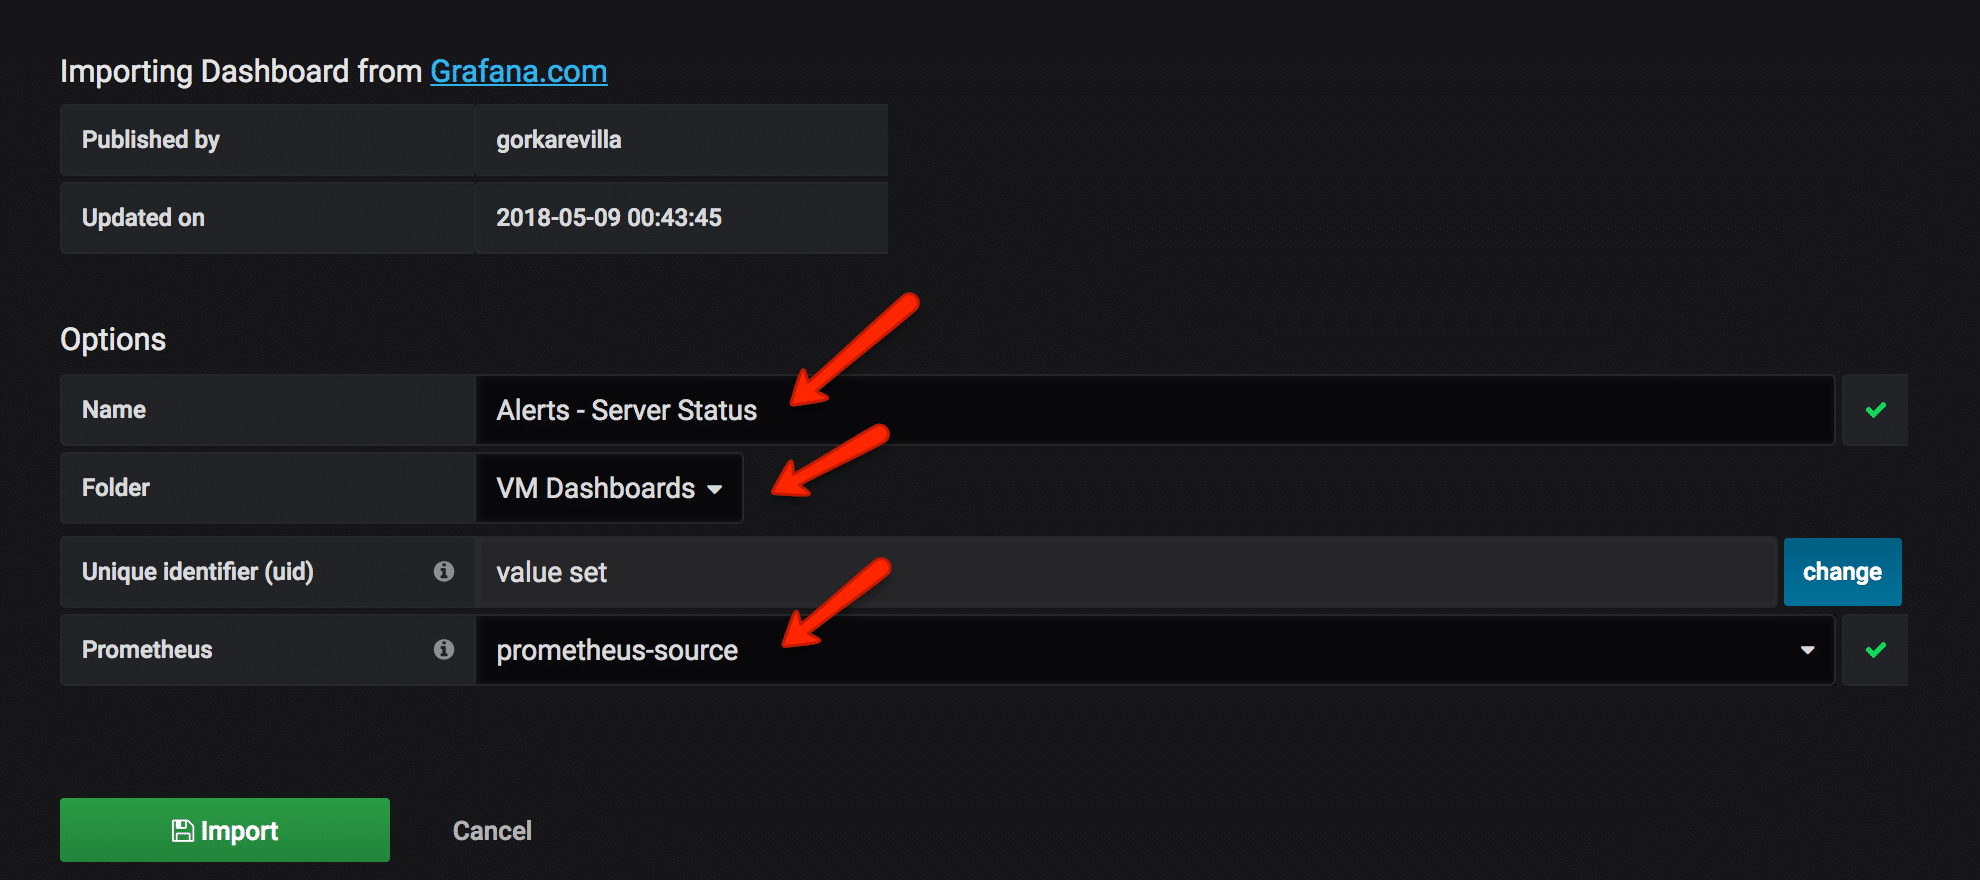
For demo purpose, we will use this template. https://grafana.com/dashboards/5990.
You can import a shared dashboard using the key or the JSON file as shown below.
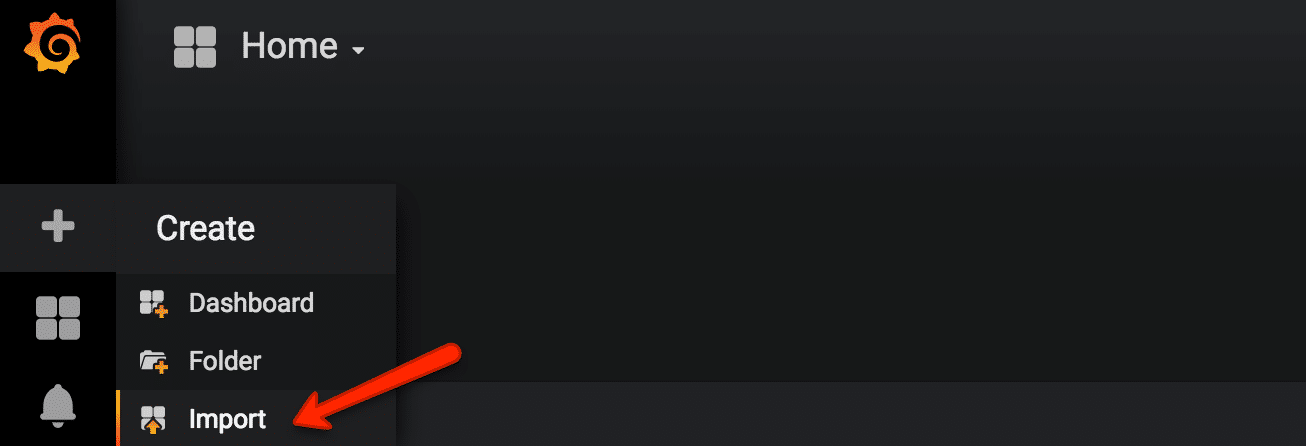
- Select the import option as shown below.
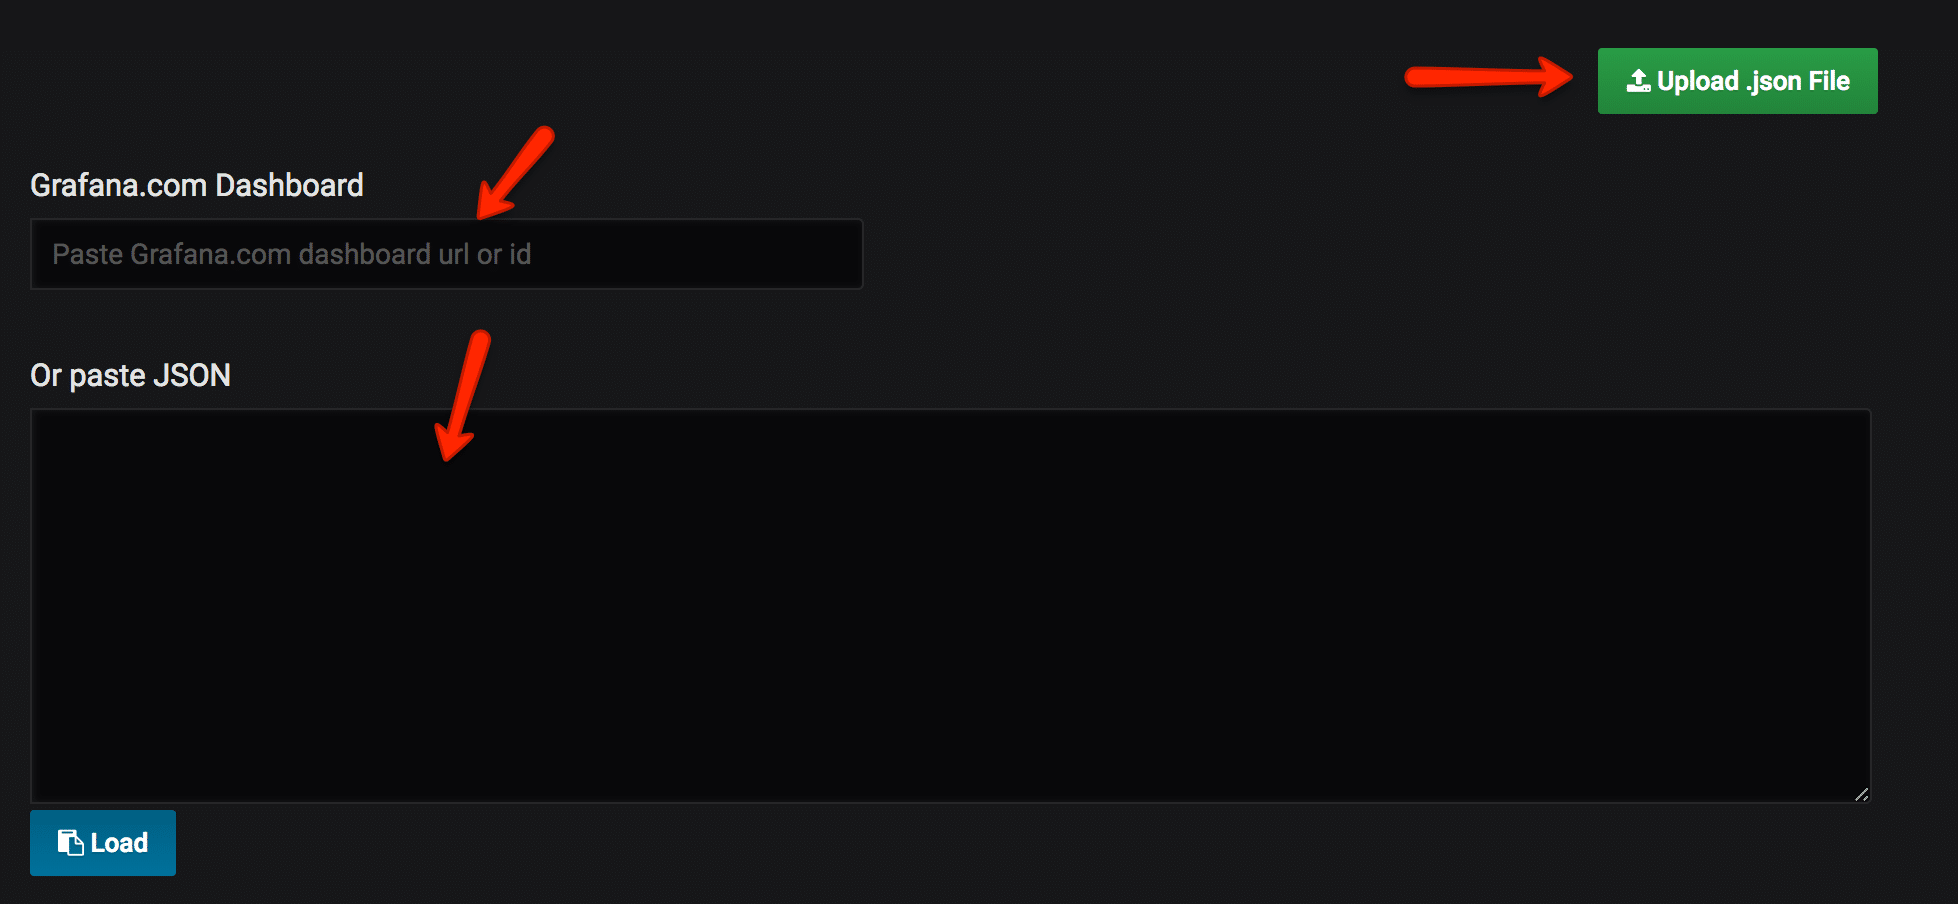
- Following are the supported import options. You can add the dashboard ID you get from grafana website, upload the json or paste the json in the text box.
- Add a template name, Prometheus source, destination dashboard folder and click import.