

In this comprehensive guide, I have converted detailed steps to set up Prometheus Alert Manager and configure email and Slack alerts.
Setup Prerequisites
You need two Ubuntu servers for this setup.
server-01, ie the monitoring server contains Prometheus, Alert Manager, and Grafana utilities.
The second server (server-02), contains the Node Exporter utility.
Before starting the alert manager setup, ensure you have Prometheus and Grafana configured on the server. You can follow the guides given below.
- Prometheus Setup (Server 01)
- Grafana Setup (Server 01)
- Node Exporter Setup (Server 02)
In this guide, we will only look at the Alert Manager setup and its configurations related to email and Slack alerting.
Let's get started with the setup.
Step 1: Download Prometheus Alert Manager
Download a suitable Alert Manager binaries, which is suitable for your server. here we use the latest version, which is v0.26.0.
wget https://github.com/prometheus/alertmanager/releases/download/v0.26.0/alertmanager-0.26.0.linux-amd64.tar.gzCreate a user and group for the Alert Manager to allow permission only for the specific user.
sudo groupadd -f alertmanager
sudo useradd -g alertmanager --no-create-home --shell /bin/false alertmanager
Creating directories is /etc and /var/lib to store the configuration and library files and change the ownership of the directory only for the specific user.
sudo mkdir -p /etc/alertmanager/templates
sudo mkdir /var/lib/alertmanager
udo chown alertmanager:alertmanager /etc/alertmanager
sudo chown alertmanager:alertmanager /var/lib/alertmanager
Unzip the Alert Manager binaries file and enter it into the directory.
tar -xvf alertmanager-0.26.0.linux-amd64.tar.gz
cd alertmanager-0.26.0.linux-amd64
Copy the alertmanager and amtol files in the /usr/bin directory and change the group and owner to alertmanager. As well as copy the configuration file alertmanager.yml to the /etc directory and change the owner and group name to alertmanager.
sudo cp alertmanager /usr/bin/
sudo cp amtool /usr/bin/
sudo chown alertmanager:alertmanager /usr/bin/alertmanager
sudo chown alertmanager:alertmanager /usr/bin/amtool
sudo cp alertmanager.yml /etc/alertmanager/alertmanager.yml
sudo chown alertmanager:alertmanager /etc/alertmanager/alertmanager.yml
Step 2: Setup Alert Manager Systemd Service
Create a service file in /etc/systemd/system and the file name is alertmanager.service.
cat <<EOF | sudo tee /etc/systemd/system/alertmanager.service
[Unit]
Description=AlertManager
Wants=network-online.target
After=network-online.target

[Service]
User=alertmanager
Group=alertmanager
Type=simple
ExecStart=/usr/bin/alertmanager \
    --config.file /etc/alertmanager/alertmanager.yml \
    --storage.path /var/lib/alertmanager/

[Install]
WantedBy=multi-user.target
EOF
sudo chmod 664 /usr/lib/systemd/system/alertmanager.service
After providing the necessary permission to the file reload the background processes and start the Alert Manager service. To prevent the manual restart of the service after reboot, enable the service.
sudo systemctl daemon-reload
sudo systemctl start alertmanager.service
sudo systemctl enable alertmanager.service
Check the status of the service and ensure everything is working fine.
sudo systemctl status alertmanagerTo access the Prometheus Alert Manager over the internet, use the following command.
http://<alertmanager-ip>:9093Instead of <alertmanager>, provide your instance public IP with the default Alert Manager port number, which is 9093.
The output user interface you will get is this.
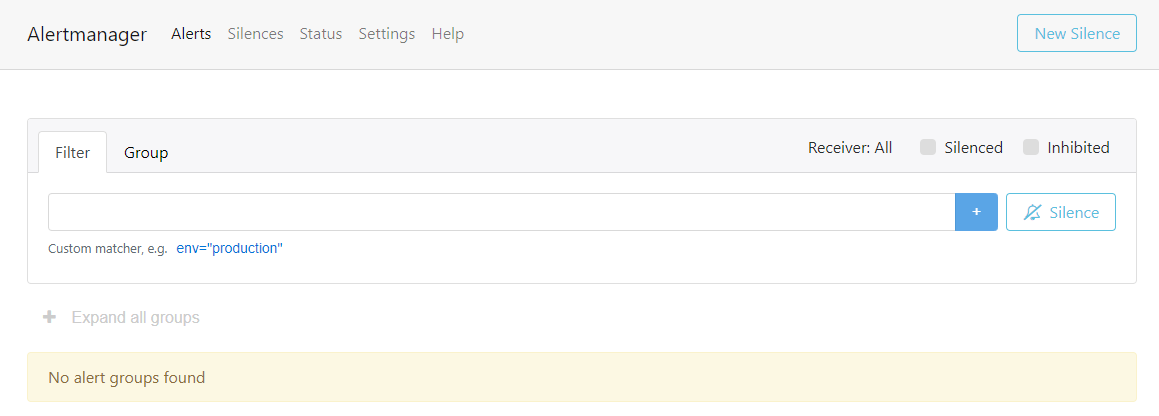
Currently, there are no alerts in the dashboard. After finishing the configurations, we conducted some tests to see how the alert works with the Alert Manager.
Step 3: Setup SMTP Credentials
You can use any SMTP with the Alert Manager.
For this setup, I am using AWS SES as SMTP to configure email alerts with Alert Manager.
If you have already configured SES in your AWS account, you can generate the SMTP credentials.
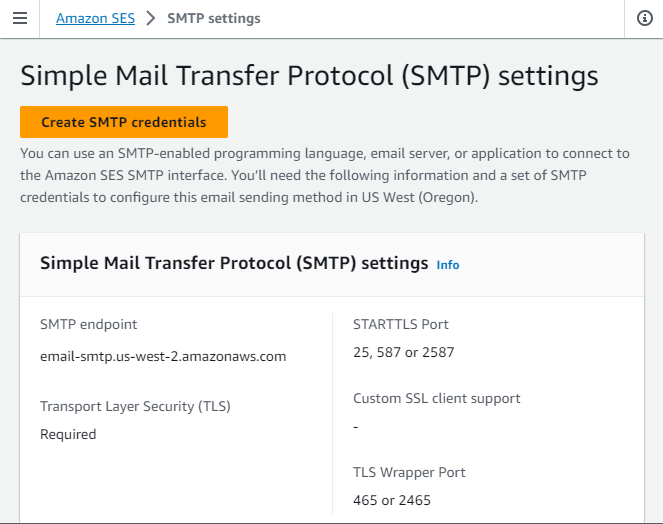
During the setup, please note down the SMTP endpoint and STARTTLS Port. This information is required to configure the Alert Manager email notification.
To generate a new SMTP credential, open the SES dashboard and click on Create SMTP credentials.
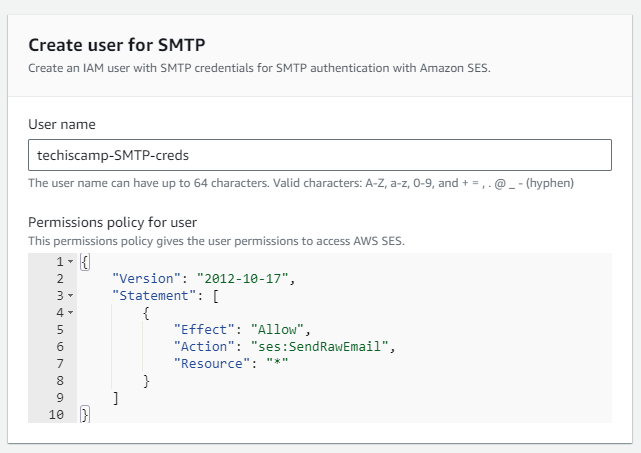
It will redirect to IAM user creation. modify the user name if necessary and don't have to change any other parameters.
IAM user name, SMTP user name, and SMTP password will be generated. This information is required to configure the Alert Manager notification setup.
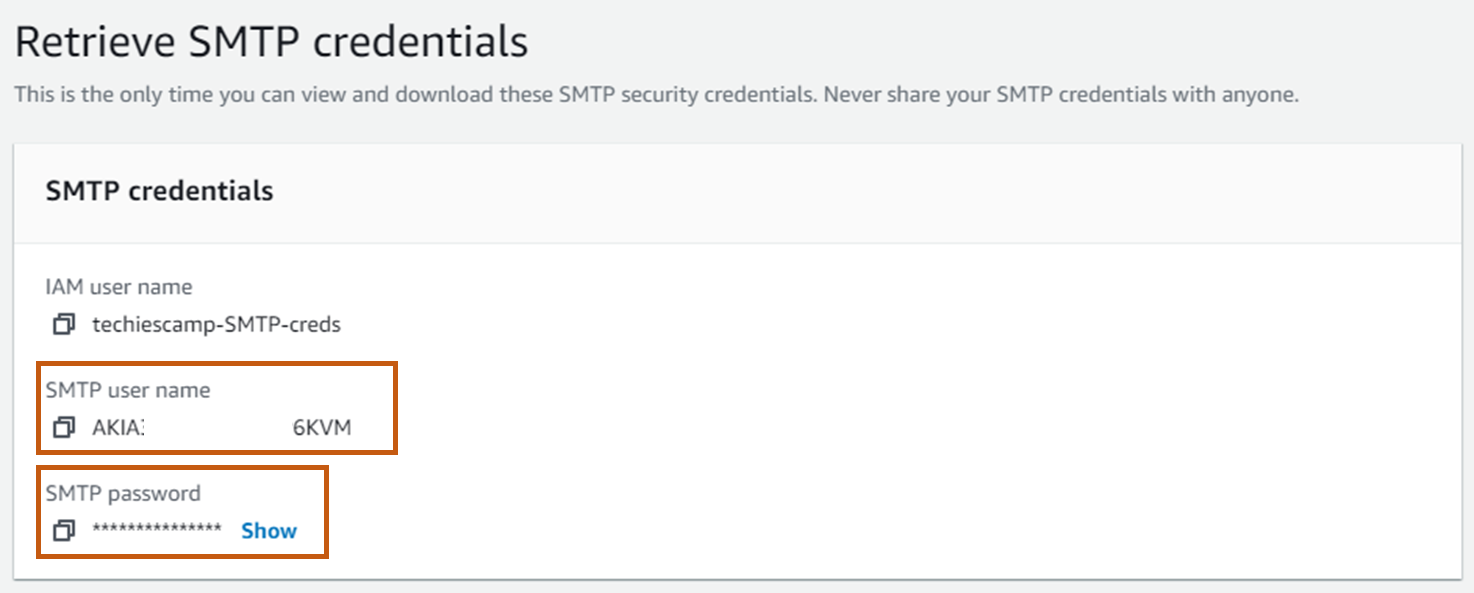
Note down and keep the SMTP details. We will use it in the alert manager configuration step.
Step 4: Generate Slack Webhook
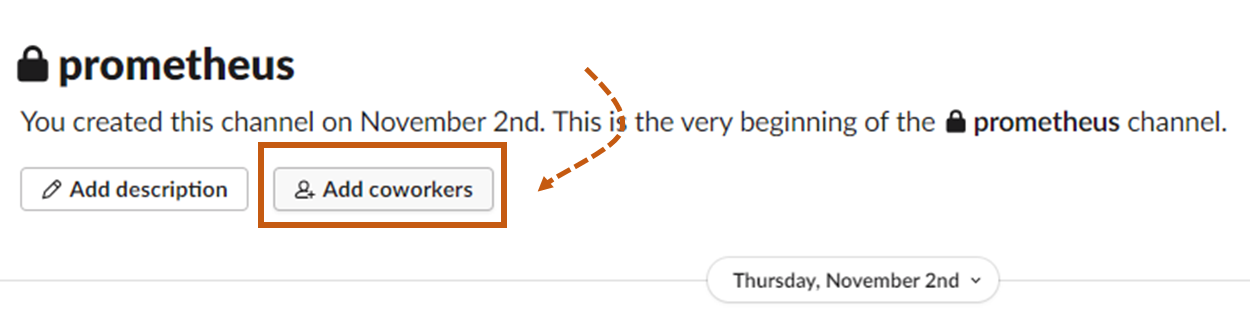
Create a Slack channel to get the alert manager notifications. You can also use the existing channel and add members who need to get the notifications.
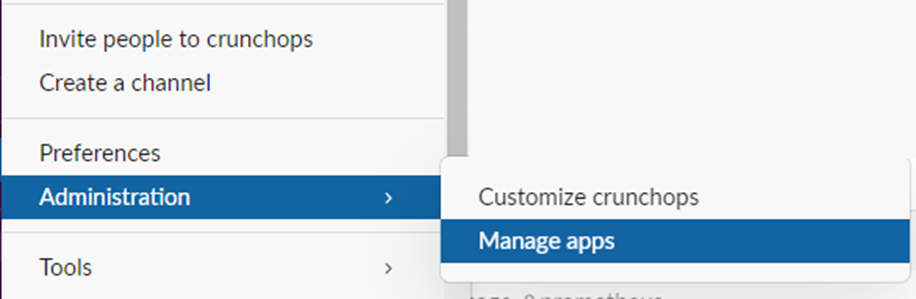
Navigate to the administration section and select Manage apps to reach the Slack app directory.
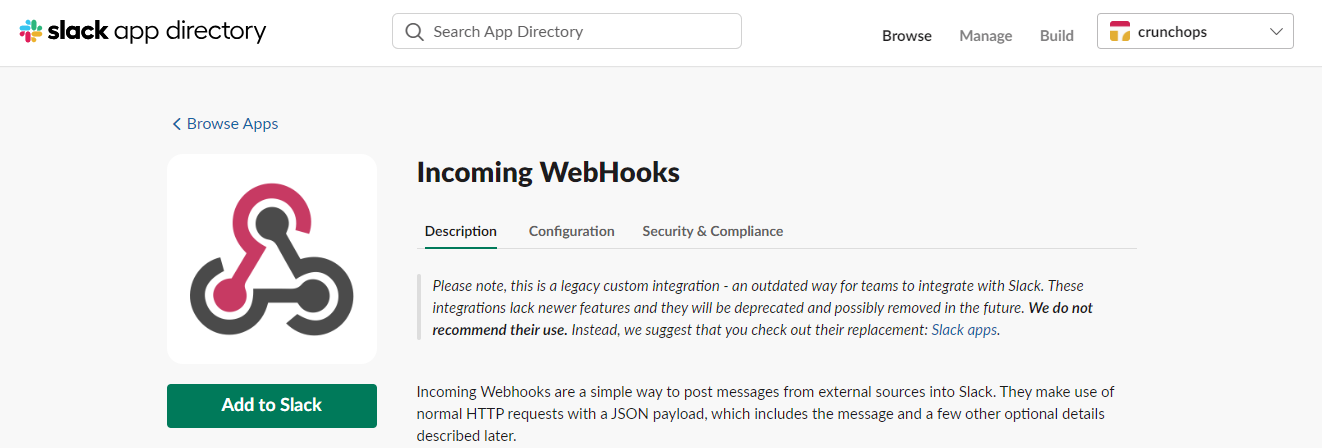
Search and find Incoming WebHooks from the Slack app directory and select Add to Slack to go to the webhook configuration page.
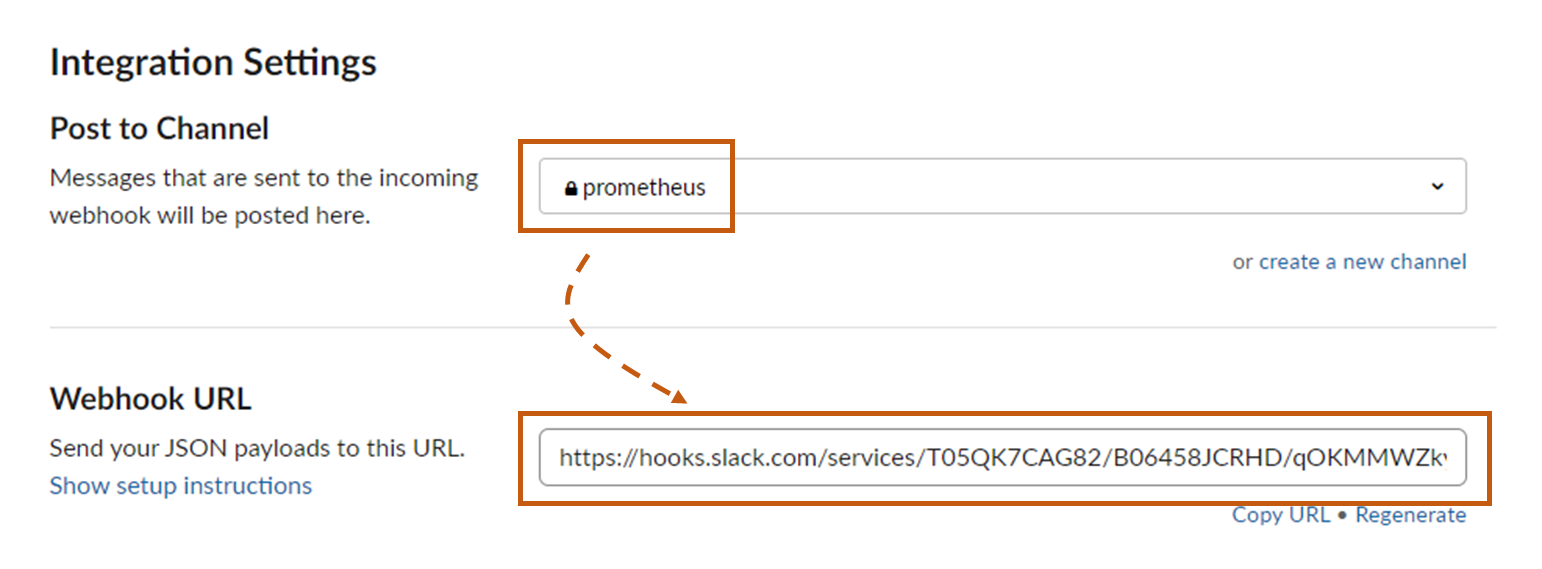
In the new configuration tab, choose the channel you created before and click on Add Incoming WebHooks integration.
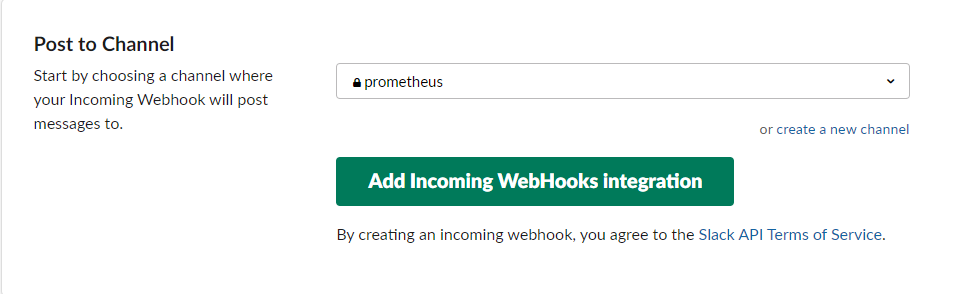
Now, the webhook will be created. store them securely to configure them with Alert Manager.
Step 5: Configure Alert Manager With SMTP and Slack API
All the configurations for the Alert manager should be part of the alertmanager.yml file.
Open the Alert Manager configuration file.
sudo vim /etc/alertmanager/alertmanager.ymlInside the configuration file, you should add the Slack and SES information to get the notifications as highlighted below in bold.
global:
  resolve_timeout: 1m
  slack_api_url: '$slack_api_url'

route:
  receiver: 'slack-email-notifications'

receivers:
- name: 'slack-email-notifications'
  email_configs:
      - to: 'arunlal@abcdefg.com'
        from: 'email@devopsproject.dev'
        smarthost: 'email-smtp.us-west-2.amazonaws.com:587'
        auth_username: '$SMTP_user_name'
        auth_password: '$SMTP_password'

        send_resolved: false

  slack_configs:
  - channel: '#prometheus'
    send_resolved: false
In the global section, provide the Slack webhook that you have created already.
In the receivers section, modify the to address and from address, and provide the SMTP endpoint and port number in smarthost section. auth_username as SMTP user name and auth_password as SMTP password.
Modify the - channel with the slack channel name in slack_configs section.
Once the configuration part is done, restart the Alert Manager service and ensure everything is working fine by checking the status of the service.
sudo systemctl restart alertmanager.service
sudo systemctl status alertmanager.service
Step 6: Create Prometheus Rules
Prometheus rules are essential to trigger the alerts. Based on the rules, Prometheus will identify the situations and send an alert to the Alert Manager.
We can create multiple rules in YAML files as per the alert requirements.
Let's create a couple of alert rules in separate rule YAML files and validate them by simulating thresholds.
Rule 1: Create a rule to get an alert when the CPU usage goes more than 60%.
cat <<EOF | sudo tee /etc/prometheus/cpu_thresholds_rules.yml
groups:
  - name: CpuThreshold
    rules:
      - alert: HighCPUUsage
        expr: 100 - (avg(rate(node_cpu_seconds_total{mode="idle"}[5m])) * 100) > 60
        for: 1m
        labels:
          severity: critical
        annotations:
          summary: "High CPU usage on {{ $labels.instance }}"
          description: "CPU usage on {{ $labels.instance }} is greater than 60%."
EOF
We can add more than one rule in a single file, and modify the values as per your requirements. In this, if the CPU usage goes more than 60% and is sustained for more than a minute, we get an alert.
Rule 2: Rule for memory usage alert
cat <<EOF | sudo tee /etc/prometheus/memory_thresholds_rules.yml
groups:
  - name: MemoryThreshold
    rules:
      - alert: HighRAMUsage
        expr: 100 * (1 - (node_memory_MemAvailable_bytes / node_memory_MemTotal_bytes)) > 60
        for: 1m
        labels:
          severity: critical
        annotations:
          summary: "High RAM usage on {{ $labels.instance }}"
          description: "RAM usage on {{ $labels.instance }} is greater than 60%."
EOF
Here also the same, if the memory usage goes more than 60%, Prometheus sends an alert to Alert Manager.
Rule 3: Rule for high storage usage alert
cat <<EOF | sudo tee /etc/prometheus/storage_thresholds_rules.yml
groups:
  - name: StorageThreshold
    rules:
      - alert: HighStorageUsage
        expr: 100 * (1 - (node_filesystem_avail_bytes / node_filesystem_size_bytes{mountpoint="/"})) > 50
        for: 1m
        labels:
          severity: critical
        annotations:
          summary: "High storage usage on {{ $labels.instance }}"
          description: "Storage usage on {{ $labels.instance }} is greater than 50%."
EOF
Here, the primary storage usage goes more than it's 50%, we get alert notifications through our Slack channel and Email.
Rule 4: Rule to get an alert when an instance is down.
cat <<EOF | sudo tee /etc/prometheus/instance_shutdown_rules.yml
groups:
- name: alert.rules
  rules:
  - alert: InstanceDown
    expr: up == 0
    for: 1m
    labels:
      severity: "critical"
    annotations:
      summary: "Endpoint {{ $labels.instance }} down"
      description: "{{ $labels.instance }} of job {{ $labels.job }} has been down for more than 1 minutes."
EOF
Once the rules are created, we should check that the rules are working. for that, we have to make some modifications to the Prometheus configuration file.
Step 7: Modify Prometheus Configurations
Navigate to the Prometheus configuration file, which is in the /etc/prometheus directory.
sudo vim /etc/prometheus/prometheus.ymlAdd Alert Manager information, and Prometheus rules, and modify the scrape configurations as given below.
global:
  scrape_interval: 15s
  evaluation_interval: 15s

# Alertmanager configuration
alerting:
  alertmanagers:
    - static_configs:
        - targets:
           - localhost:9093

rule_files:
  - "cpu_thresholds_rules.yml"
  - "storage_thresholds_rules.yml"
  - "memory_thresholds_rules.yml"
  - "instance_shutdown_rules.yml"

scrape_configs:
  - job_name: "prometheus"
    static_configs:
      - targets: ["localhost:9090"]

  - job_name: "node_exporter"
    scrape_interval: 5s
    static_configs:
      - targets: ['172.31.31.19:9100']
In the global section, modify the time interval to collect the metrics. the default interval is 15s, so every 15 seconds, Prometheus will collect metrics from Node Exporter. Node Exporter is a tool, that should be installed on the server you want to monitor. It collects the metrics of the server and stores them in /metrics directory, Prometheus pulls them all to analyze and send notifications based on the rules we mention.
In the Alert Manager configuration sections, unmask the target if your Prometheus and Alert Manager are on the same server, otherwise, provide the server's IP address.
In the rule_files section, provide the path of the Prometheus rules files also ensure the rules files are in the same directory where the Prometheus configuration file is in or give the proper path.
scrape_configs section will have the server information that you want to monitor, the target field contains the IP address of the target server.
Here, node-exporter is the actual server we want to monitor and in the target field we provide the private IP of that server. If your servers are in different network ranges, provide the public IP of that server and 9100 is the default port of the Node Exporter.
After modifying the configurations, restart the Prometheus service using the following command.
sudo systemctl restart prometheus.serviceCheck the status of the service to ensure there are no errors in the above configurations using the following command.
sudo systemctl status prometheus.serviceStep 8: Verify Configurations and Rules.
Here, we conduct stress tests to verify the rules and configurations are working fine.
Test 1 : Memory Stress Test
Install stress-ng utility in the server that you want to monitor and make stress tests.
sudo apt-get -y install stress-ngTo stress the Memory of the server, use the following command.
stress-ng --vm-bytes $(awk '/MemFree/{printf "%d\n", $2 * 1;}' < /proc/meminfo)k --vm-keep -m 10This will increase the memory usage up to 90% and we get an alert that the usage reaches 60%.
To visually analyze the metrics of the server, we use a Grafana dashboard.
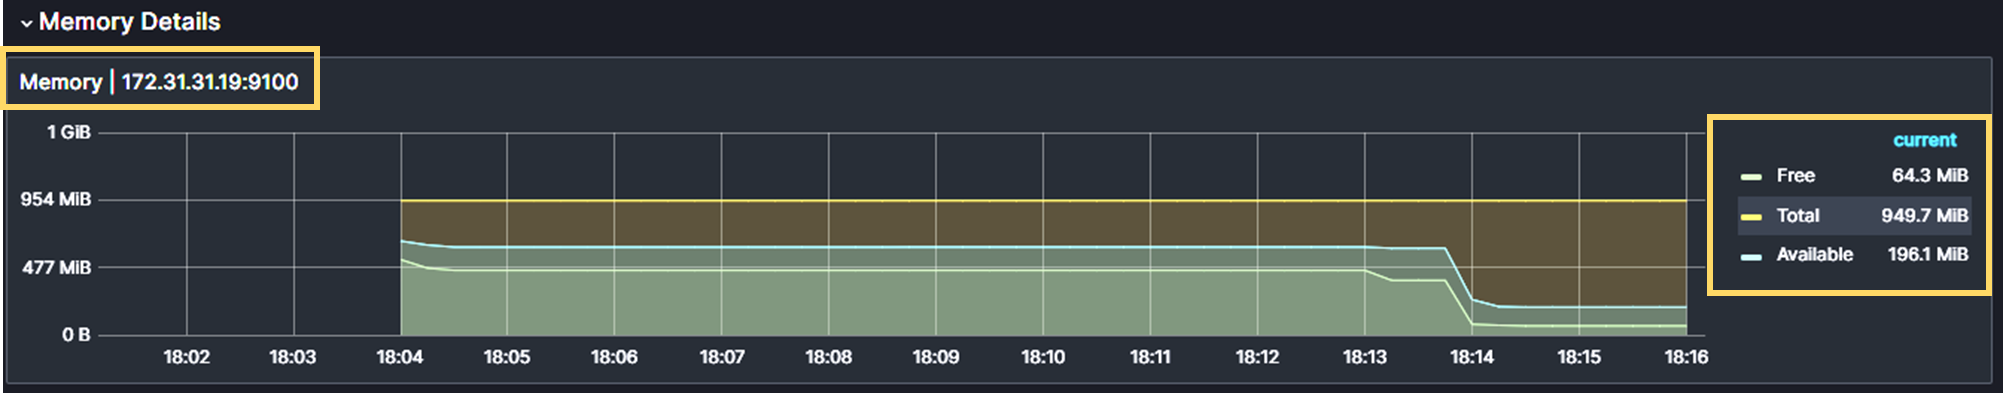
Prometheus identifies the issue when the memory usage reaches 60% and will be ready to send an alert to the Alert Manager.
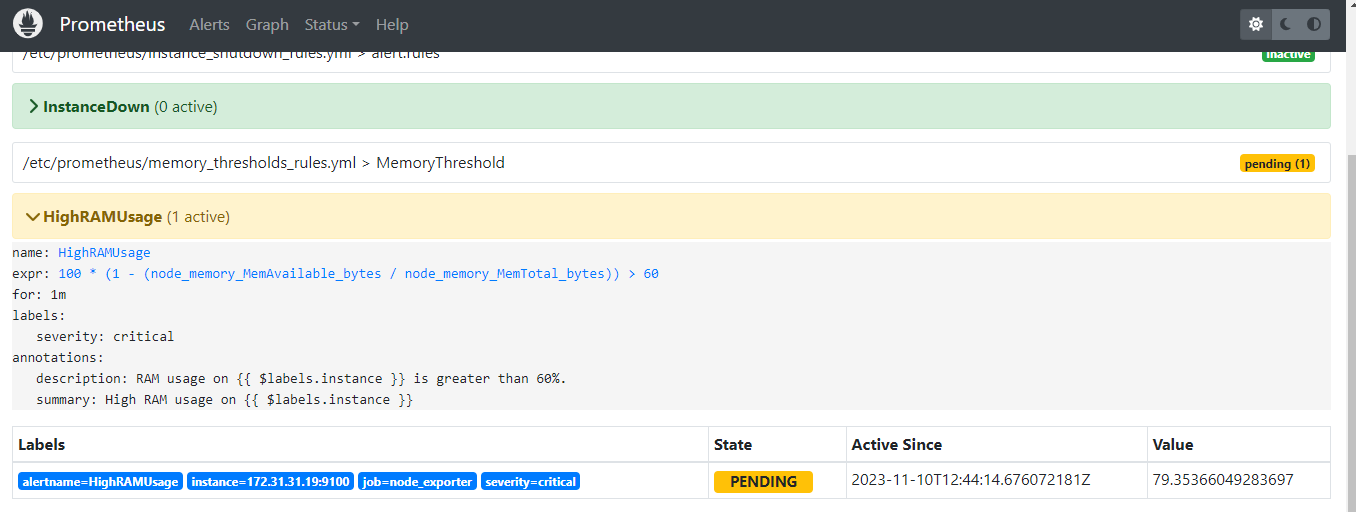
Then, Prometheus informed the Alert Manager to send notifications to the intended person through Slack and Email.
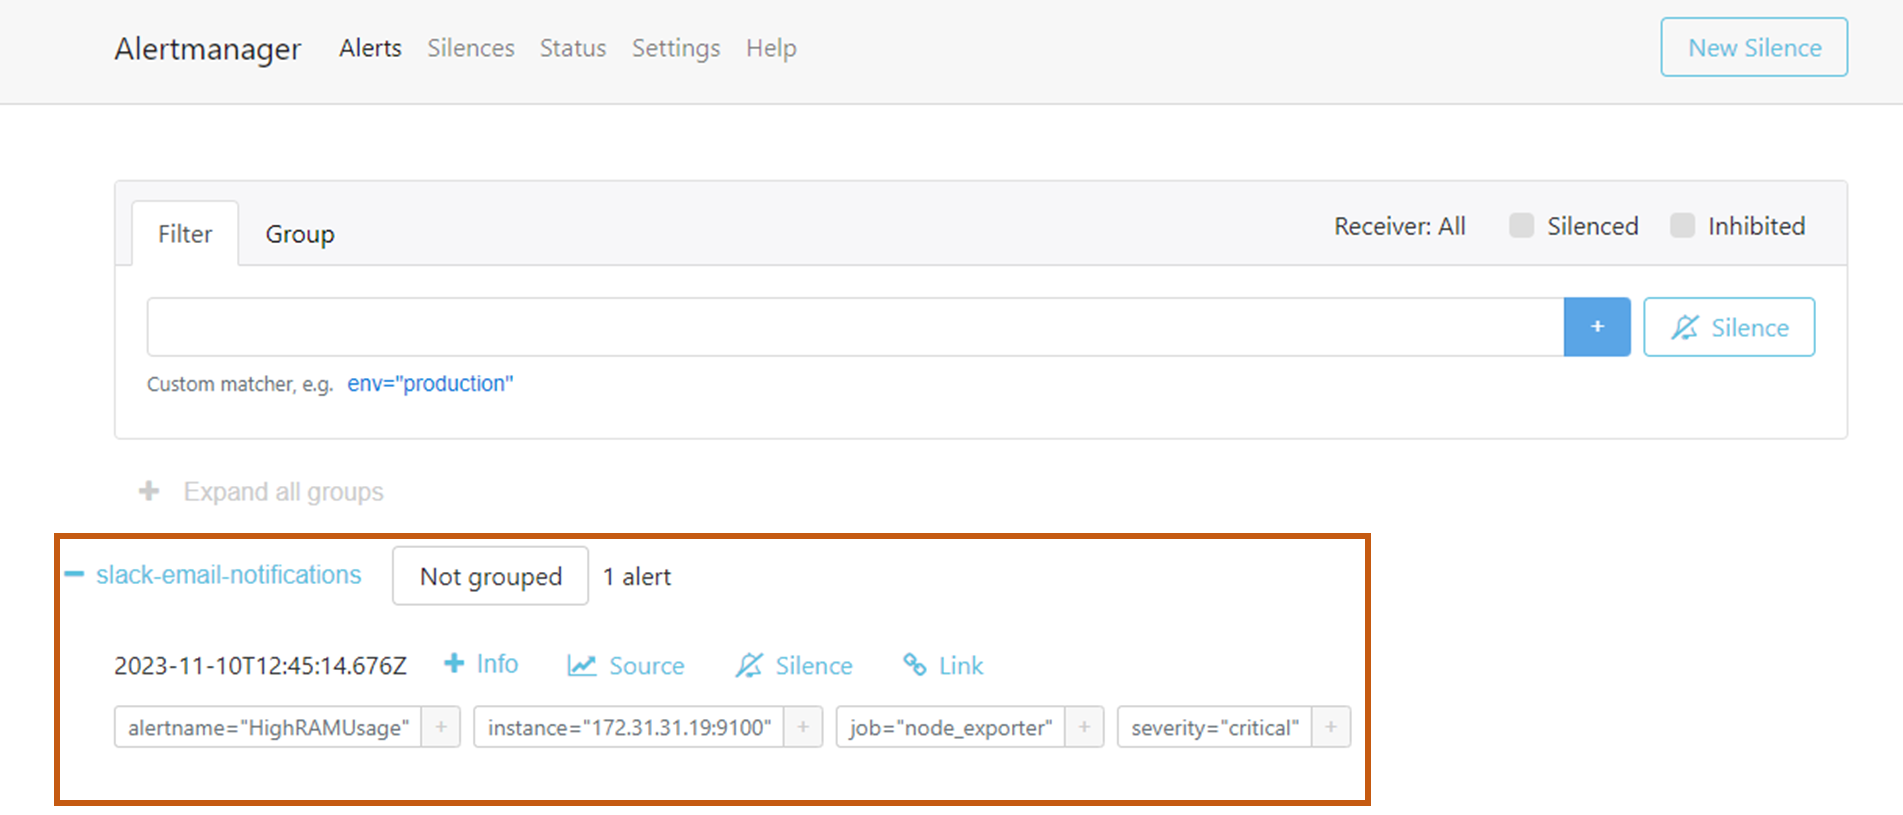
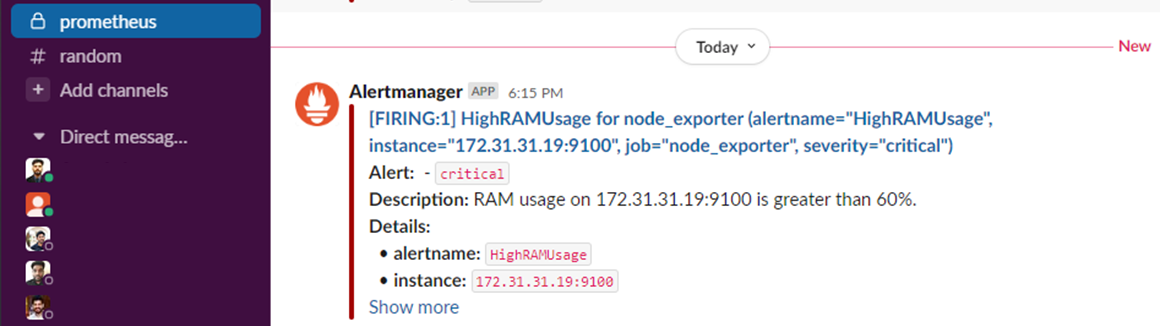
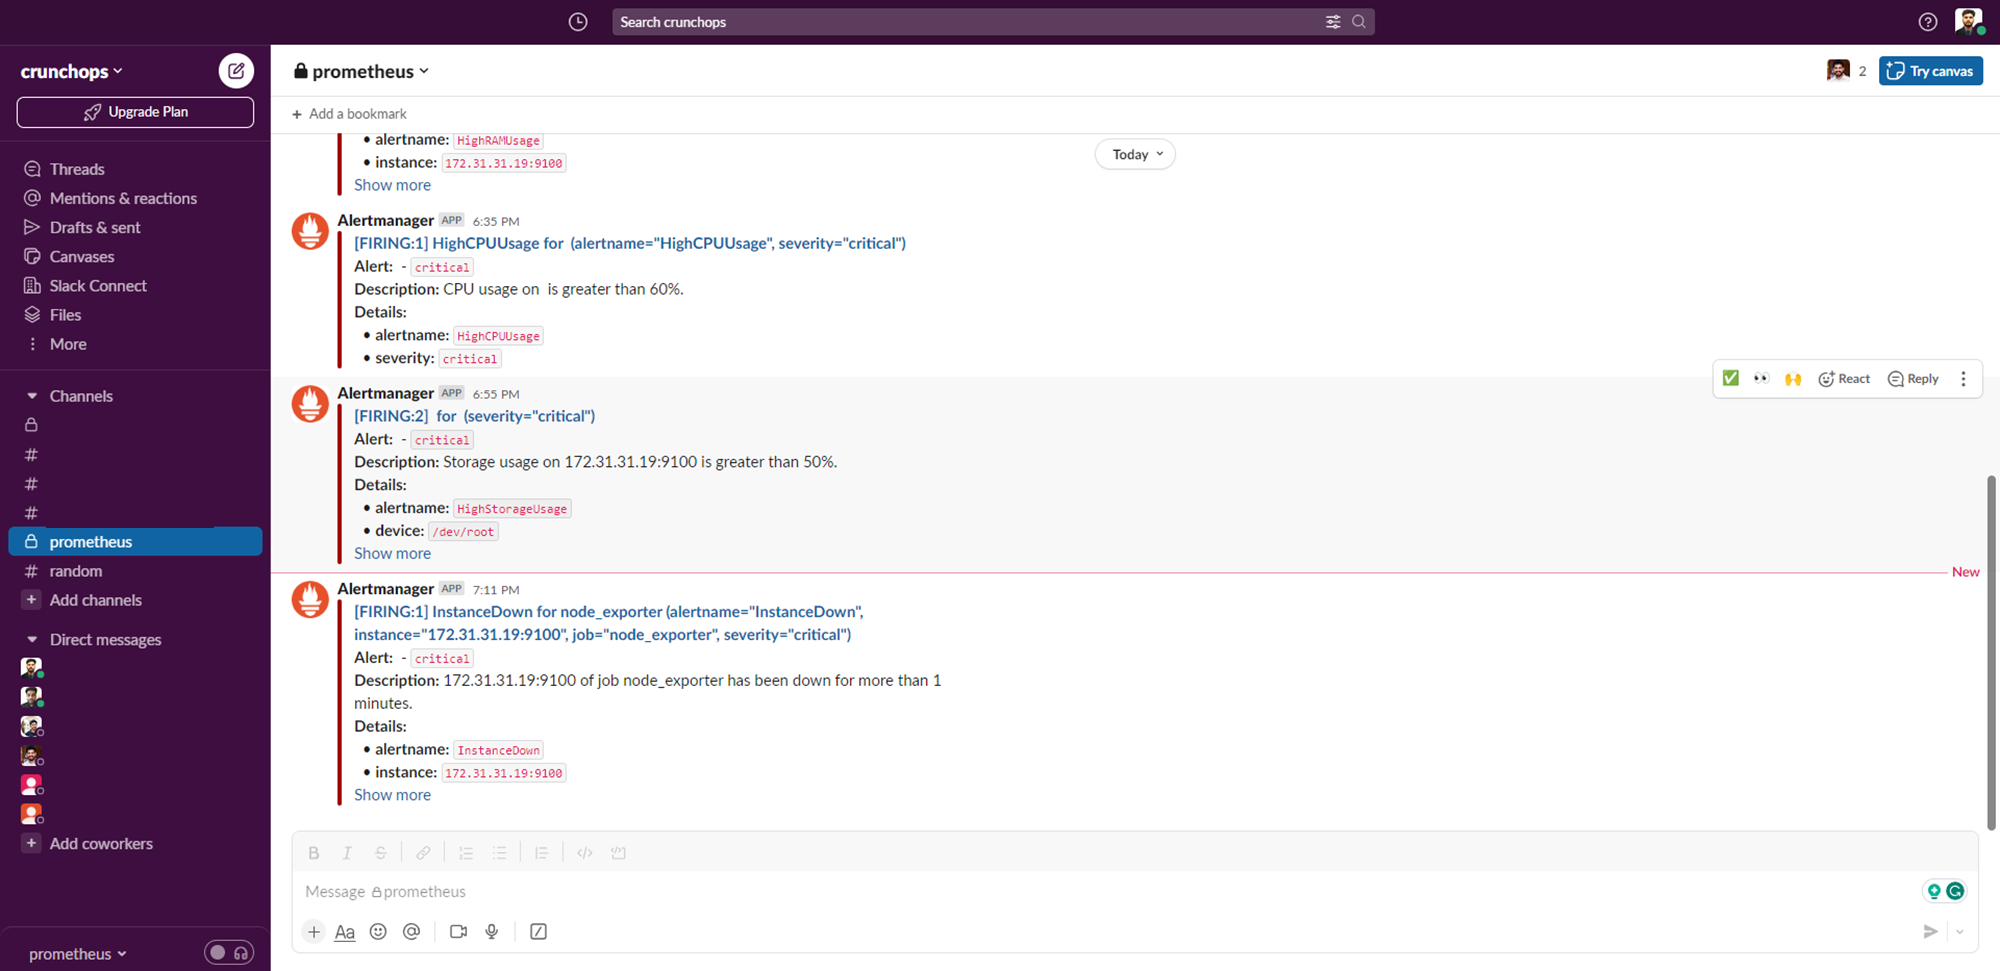
The output of the Slack notification is given below. here we can see the server details, severity level, and the cause of alert.
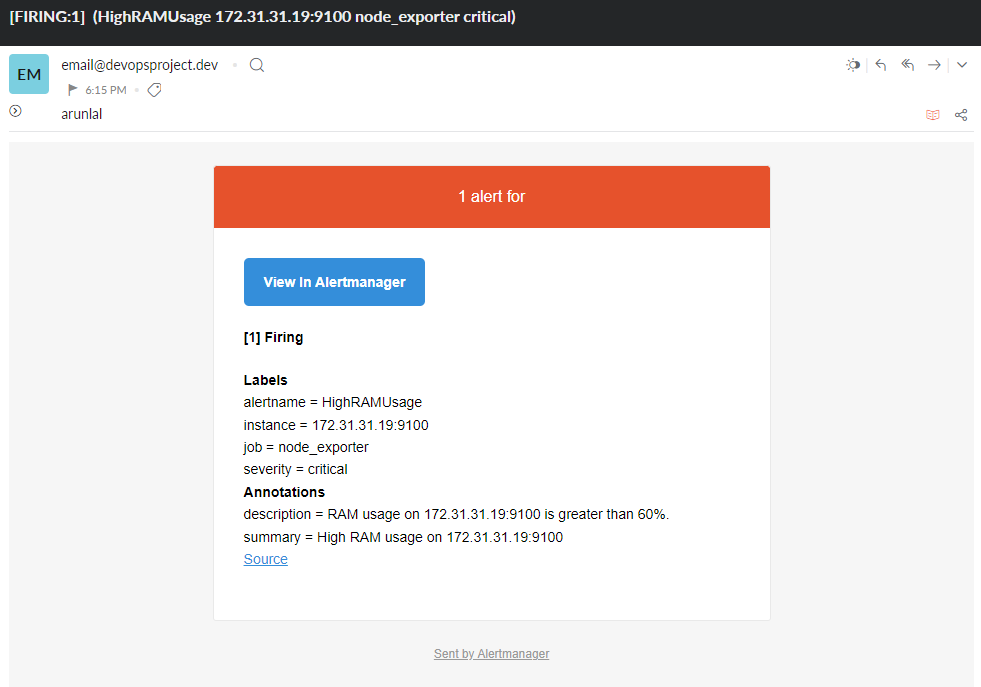
In the output of the Email notification also we get the same information. so that we can easily identify the issue at any time.
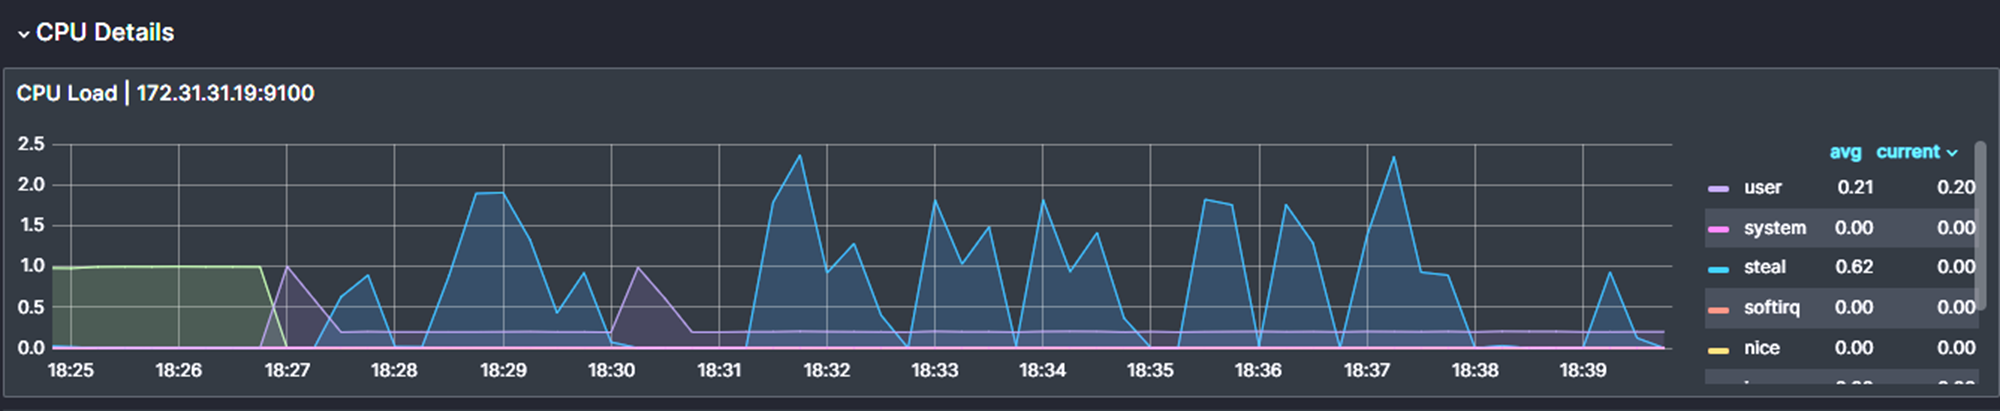
Test 2: CPU Stress Test
To stress the CPU of the server, use the following command.
stress-ng --matrix 0This command will stress the CPU usage as its maximum and you can see the result of the usage from the diagram.
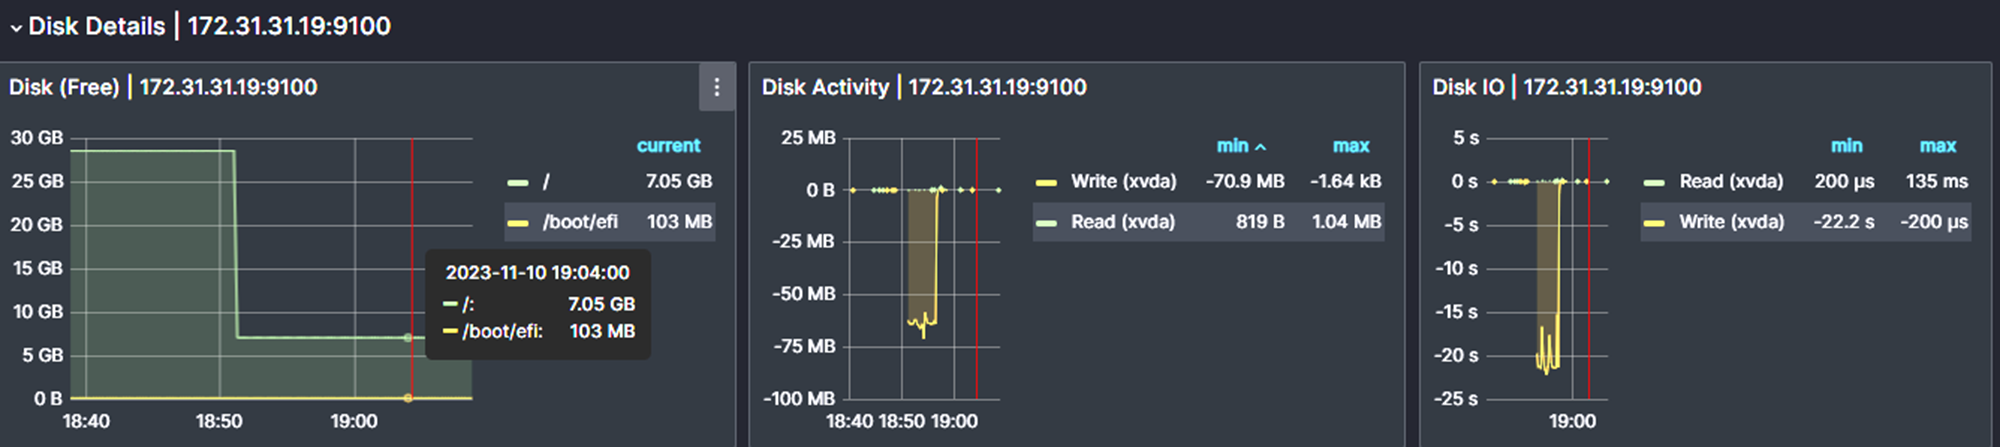
Test 3: Storage Stress Test
To stress the storage of the server, use the following command.
fio --name=test --rw=write --bs=1M --iodepth=32 --filename=/tmp/test --size=20GThe current storage is 30G, this command will increase the storage usage by more than 60% also you can change the value based on your server storage.
The output of the notifications for the above tests we conduct.
Conclusion
In this blog, I have covered the real-world usage of the Prometheus Alert Manager with some simple examples.
you can further modify the configurations as per your needs. Monitoring is very much important even if it is virtual machines or containers. we can integrate them with Kubernetes as well.
Also, If you are preparing for prometheus certification (PCA), check out our Prometheus Certified Associate exam Guide for exam tips and resources.
