

In this blog, let's explore how to set up Blackbox Exporter on Kubernetes. By the end, you'll have a clear understanding of the process.
If a requirement comes to monitor a server's or application's endpoint, then Blackbox Exporter will fulfill your requirements.
This is also one of the Exporter that Prometheus has, and this will collect the probe metrics using the endpoint type such as HTTP, TCP, ICMP, etc.
Why Blackbox Exporter is Important?
Sometimes Kubernetes needs to access external resources such as databases and APIs, If those resources have any issue then Kubernetes can't able to access them, so we have to monitor their endpoint so that we can identify the issue earlier and fix it.
Blackbox Exporter not only helps to troubleshoot, but it is also useful to improve the performance of the Kubernetes with external resources.
It can track the request and response time between the resources, based on the data, we can identify any kind of latency issue present and we can make adjustments to improve the performance.
How to Setup Blackbox Exporter On Kubernetes?
I have created a repo to store the configuration YAML files, if you are interested, use them for this setup.
https://github.com/arunlalp/kubernetes-blackbox-exporter.gitThis setup is a part of the Prometheus monitoring setup on our EKS cluster so I am using the existing namespace, which is monitoring.
If you don't have a dedicated namespace for your monitoring resources, create one before starting the setup.
Step 1: Create a ConfigMap
Create a file blackbox-configmap.yaml and add the following contents.
apiVersion: v1
kind: ConfigMap
metadata:
  name: blackbox-exporter-config
  namespace: monitoring
data:
  config.yml: |
    modules:
      http_endpoint:
        prober: http
        timeout: 5s
        http:
          valid_http_versions: ["HTTP/1.1", "HTTP/2.0"]
          valid_status_codes: [200, 204]
          no_follow_redirects: false
          preferred_ip_protocol: "ip4"
Here, you can see the metadata section, I have mentioned the namespace monitoring, you can modify it with your namespace and replace the name if you want.
Now, focus on the data section, where you will add the modules. The Blackbox Exporter works based on modules.
For this, I have mentioned only one HTTP endpoint-based module, but you can add multiple modules with different endpoint types.
To apply this configmap to your cluster, use the following command.
kubectl apply -f blackbox-configmap.yamlIf you want to see the list configmaps in the monitoring namespace.
kubectl get configmaps -n monitoringStep 2: Create the Blackbox Deployment
Create the configuration file blackbox-deployment.yaml and add the contents.
---
apiVersion: apps/v1
kind: Deployment
metadata:
  name: blackbox-exporter
  namespace: monitoring
spec:
  replicas: 1
  selector:
    matchLabels:
      app: blackbox-exporter
  template:
    metadata:
      labels:
        app: blackbox-exporter
    spec:
      containers:
      - name: blackbox-exporter
        image: prom/blackbox-exporter:latest
        args:
          - "--config.file=/etc/blackbox-exporter/config.yml"
        ports:
        - containerPort: 9115
        volumeMounts:
        - name: config-volume
          mountPath: /etc/blackbox-exporter
      volumes:
      - name: config-volume
        configMap:
          name: blackbox-exporter-config
Don't forget to add the namespace name in the metadata section, in the spec section, you can see that I am using the latest Blackbox image prom/blackbox-exporter:latest.
you can give a specific version if you want, and the default port of the Blackbox is 9115, which I have mentioned as the value of containerPort.
To apply this configuration, use the following command.
kubectl apply -f blackbox-deployment.yamlTo view the list of deployments in the monitoring namespace
kubectl get deployments -n monitoring -o wideStep 3: Create a Service for Blackbox Exporter
Create a configuration file blackbox-service.yaml and add the following contents.
---
apiVersion: v1
kind: Service
metadata:
  name: blackbox-exporter
  namespace: monitoring
spec:
  selector:
    app: blackbox-exporter
  type: NodePort
  ports:
    - port: 9115
      targetPort: 9115
      nodePort: 30500
In this configuration also you have to provide the namespace name and the main thing you have to consider is the spec section type parameter.
I am using NodePort type so that I can access the Blackbox Exporter over the Internet, you can use other types based on your requirements.
The nodePort I have mentioned here is 30500, otherwise, it will choose some random port from between the 30000-32767 range.
To apply this configuration, use the following command.
kubectl apply -f blackbox-service.yamlTo view the list of services in the monitoring namespace.
kubectl get svc -n monitoring -o wideNow, you can able to access the Blackbox Exporter dashboard over the internet, for that you need the public IP of one of your nodes and the port number 30500.
The output you will get is
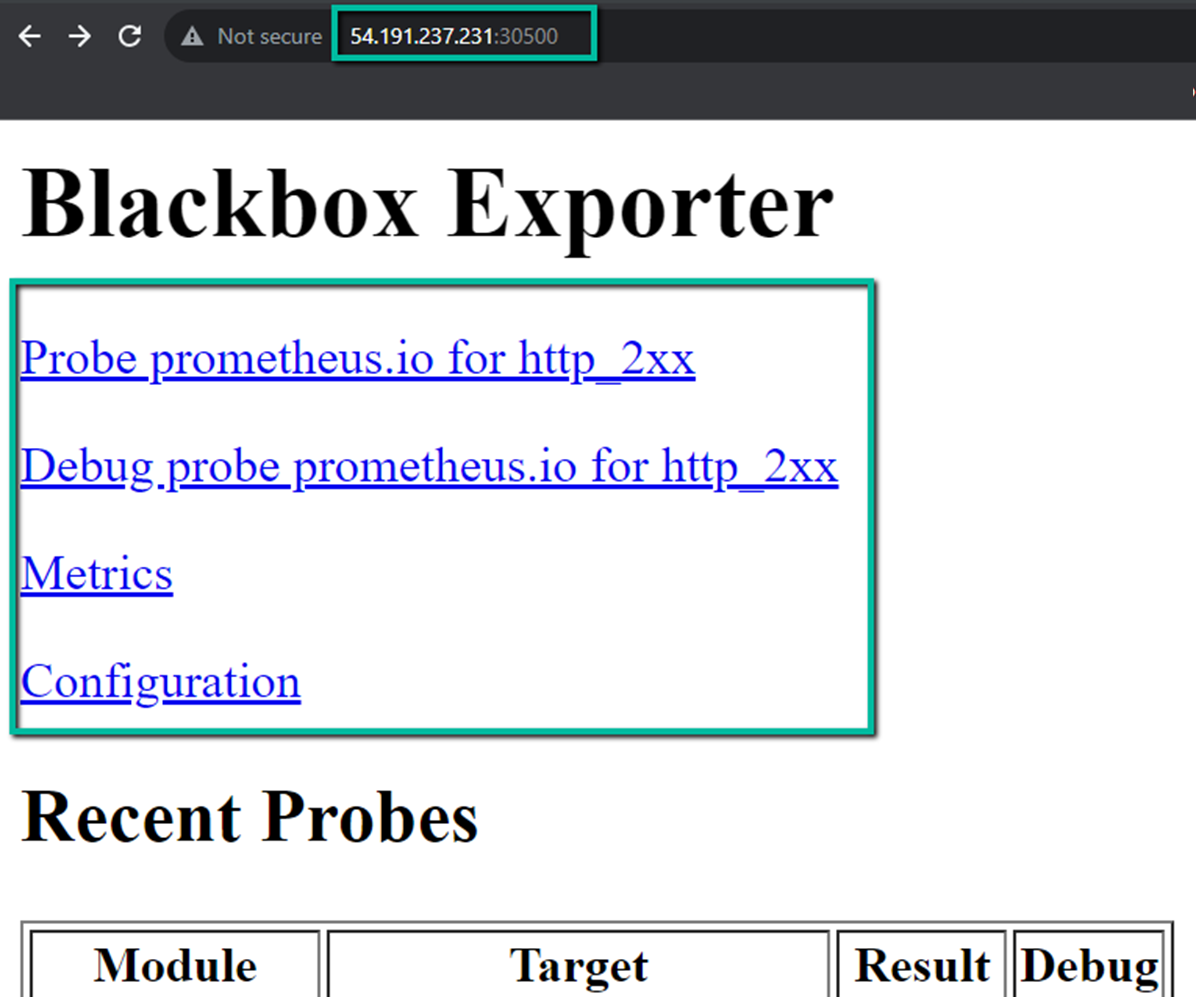
This time you can't see any results in this dashboard because we haven't mentioned the target anywhere.
We can add the targets, only in the Prometheus configuration file, so for that, we have to do some modifications in the Prometheus configuration file.
Step 4: Add Blackbox Job in Prometheus
You can directly make modifications to the Prometheus configmap file, for that first, you need to identify the configmap name.
To list them configmaps in the monitoring namespace, use the following command.
kubectl get configmaps -n monitoringOnce find the configmap name, use the below command to edit it.
kubectl edit configmap prometheus-server-conf -n monitoringThere is an alternative method to edit the ConfigMap, for that, you need to find the ConfigMap YAML manifest.
If you find the file name, open it with any text editor utility. In my case, the Prometheus configmap file name is config-map.yaml.
vim config-map.yamlAdd this content inside this file, under the scrape_configs section.
- job_name: 'blackbox-exporter-metrics'
        metrics_path: /probe
        params:
          module: [http_endpoint]
        static_configs:
          - targets:
            - https://www.google.com
            - devopscube.com
            - https://prometheus.io
        relabel_configs:
         - source_labels: [__address__]
           target_label: __param_target
         - source_labels: [__param_target]
           target_label: instance
         - target_label: __address__
           replacement: "blackbox-exporter.monitoring.svc:9115"
In the params section, http_endpoint is the module name, if you don't remember, verify your Blackbox configmap yaml file.
Under the static_configs, targets should be given, for testing purposes.
I have given three websites so that the Blackbox Exporter will monitor these website endpoints and collect the metrics based on their health and availability.
The replacement of the value indicates that from where the Prometheus has to scrape the metrics.
Once the modifications are completed, you can deploy this configuration in Prometheus.
kubectl apply -f config-map.yamlSometimes it would take a few minutes to reflect the changes in the Prometheus dashboard.
If you are not able to find the changes in the Prometheus dashboard, then you can perform the rollout restart deployment.
To restart the rollout, use the following command.
kubectl rollout restart deployment prometheus-deployment -n monitoringReplace the prometheus-deployment with your deployment name.
You have to really aware when you perform rollout restart, because until the restart completed, the Prometheus won't scrape the metrics.
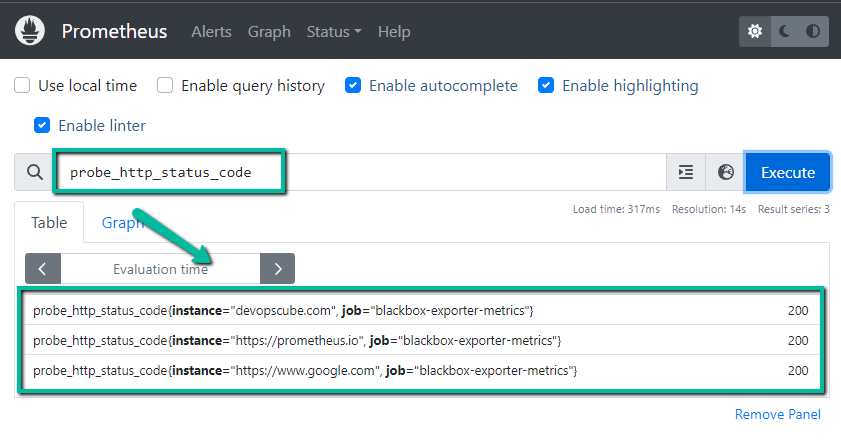
Step 5: Make Queries from Prometheus
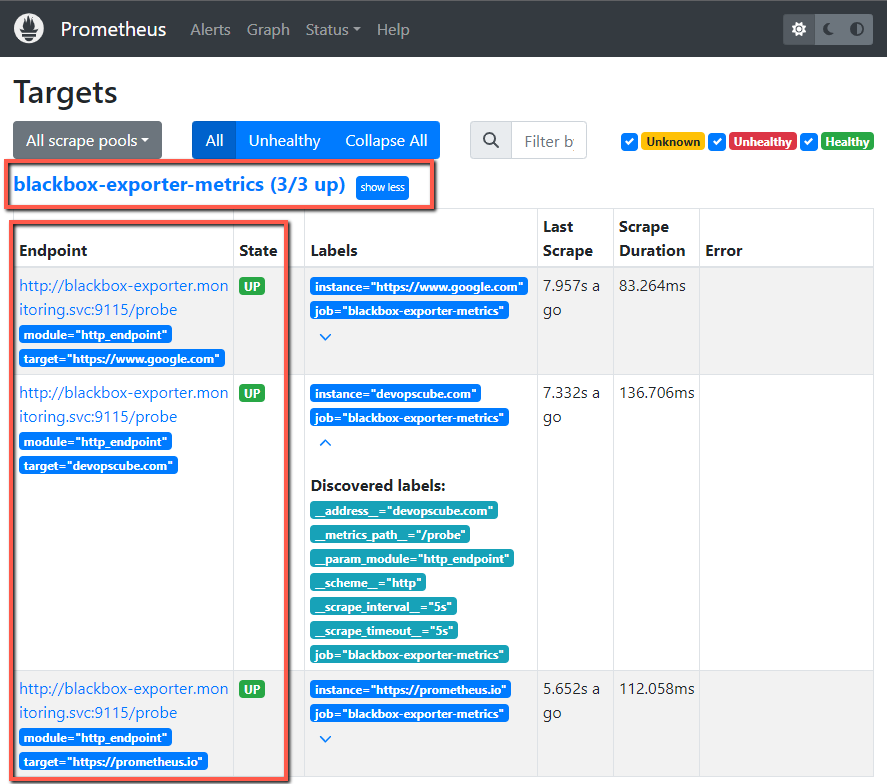
Once the configuration is completed, Prometheus will scrape the metrics from the Blackbox Exporter based on the scrape interval.
I am using the probe_http_status_code metric to see the results.
Prometheus output
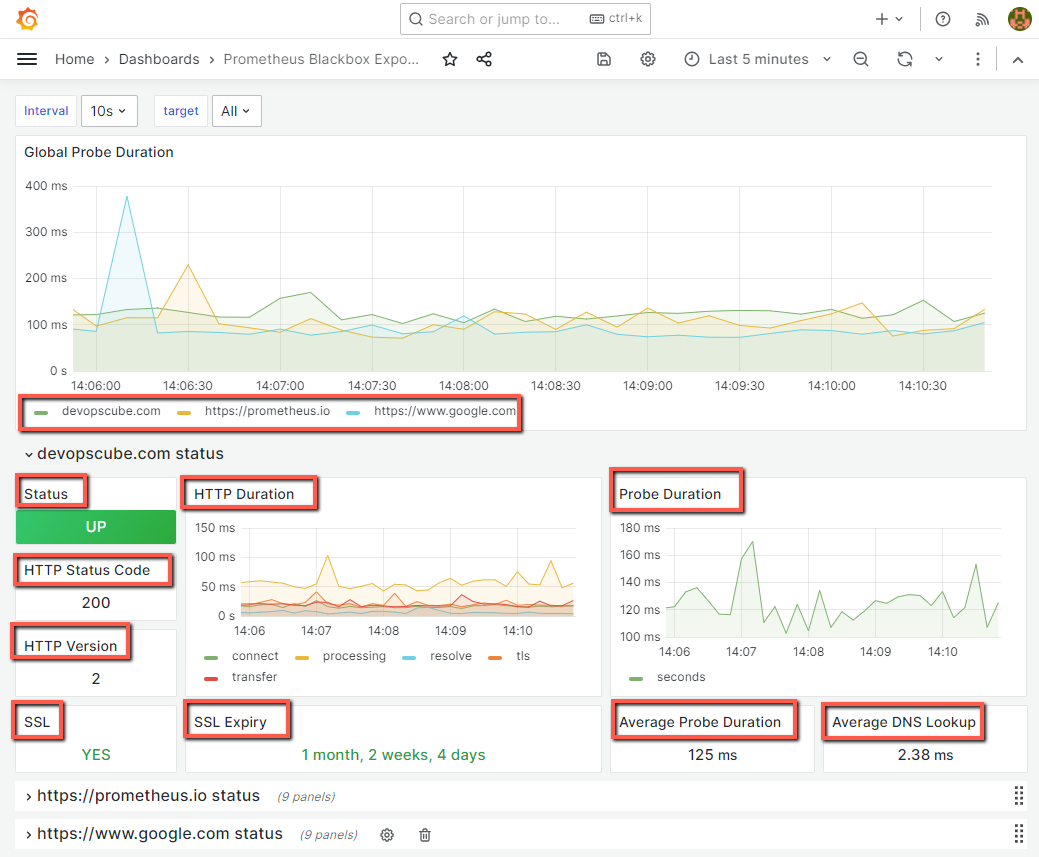
Step 6: Visualize the Metrics using the Grafana
This time I am not going to make a query using the Grafana. Instead of that, I am using a dashboard template to visualize the important probe metrics of all the endpoints.
Grafana output
Conclusion
I have already done this test setup using Linux virtual machines, this time I implemented the setup in Kubernetes and I didn't want to make this test setup more complicated so I just used only one module to probe the metrics from the endpoint.
When you test or deploy this setup, adjust the values for your needs and try to use other modules and endpoints to know the difference and use cases.
