

In this article, we will look at an easy way to set up a Prometheus pushgateway on Kubernetes with a practical example of pushing metrics from an app.
There are scenarios where Prometheus can't pull the metrics from the endpoint, for example, batch jobs or short-lived jobs.
In that kind of situation, we can use the service or application itself to push the metrics to Prometheus.
As we know, Prometheus can only pull the metrics; however, there is an option called Pushgateway where applications can push the metrics. Prometheus will then pull the retained metrics from the Pushgateway.
If you want to know more about the push gateway, I suggest you read the push gateways section in the detailed Prometheus Architecture.
Setting Up the Prometheus Pushgateway on Kubernetes
I am implementing this into an existing monitoring setup so I will use the Namespace monitoring in each configuration file.
If you want to set up the Prometheus on your cluster, click here.
Step 1: Create a Pushgateway Deployment Manifest
We don't need the ConfigMap for the Pushgateway, because most of our configuration will be on the target side and in the Prometheus configuration.
Create a Deployment file pushgateway-deployment.yaml and add the following contents.
apiVersion: apps/v1
kind: Deployment
metadata:
  name: pushgateway
  namespace: monitoring
spec:
  replicas: 1
  selector:
    matchLabels:
      app: pushgateway
  template:
    metadata:
      labels:
        app: pushgateway
    spec:
      containers:
      - name: pushgateway
        image: prom/pushgateway:latest
        ports:
        - containerPort: 9091
Here, I am using the latest Pushgateway image, you can specify the particular version if you want and the default port number of the Pushgateway is 9091.
To apply this configuration on a cluster, use the following command.
kubectl apply -f pushgateway-deployment.yamlTo view the list of deployments in the monitoring Namespace.
kubectl get deployments -n monitoring -o wideFrom the output, you can ensure the Deployment is properly placed.
Step 2: Create a Pushgateway Service
Create a service configuration file push gateway-service.yaml and add the contents to it.
apiVersion: v1
kind: Service
metadata:
  name: pushgateway
  namespace: monitoring
spec:
  selector:
    app: pushgateway
  type: NodePort
  ports:
    - port: 9091
      targetPort: 9091
      nodePort: 31500
I want to access the Pushgateway dashboard over the Internet, for that, I am using the spec.type: NodePort, and also I have specified the port number, which is 31500.
To apply this configuration on Kubernetes, use the following command.
kubectl apply -f pushgateway-service.yamlTo view the list of available Services in the monitoring Namespace.
kubectl get svc -n monitoring -o wideOnce the configuration is completed, we can able to access the Pushgateway dashboard over the internet, for that, we need one of the instance public IPs and the node port number.
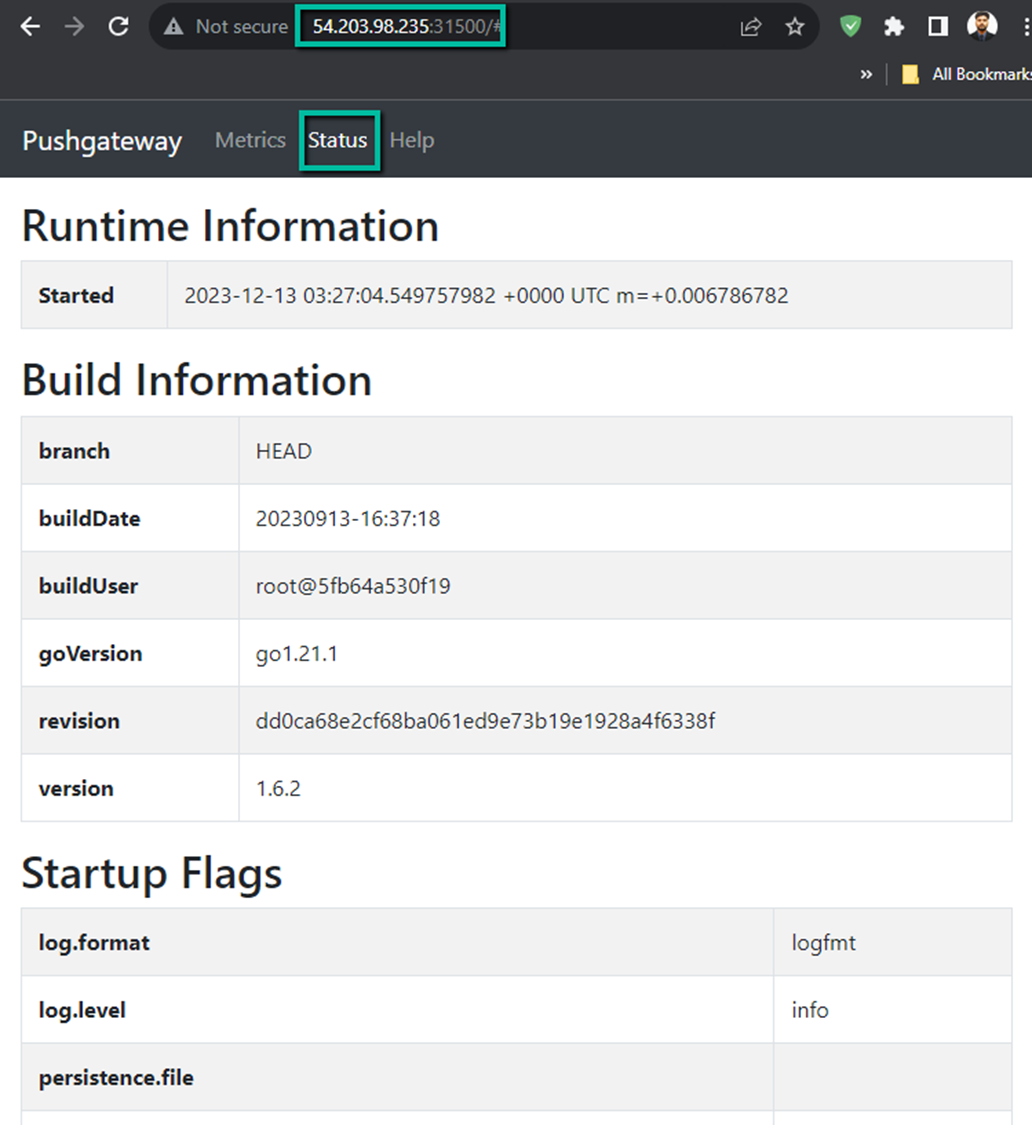
If the configuration is properly done, you will get this dashboard, now in the Metrics section, no data will be available, also Prometheus will not scrape the metrics.
First, we need to add a job to the existing Prometheus configuration.
Step 3: Add Pushgateway Job in Prometheus
Find the Prometheus ConfigMap Object or the YAML manifest and open it with a text editor.
vim config-map.yaml Your Prometheus ConfigMap file name would be different, so find and provide the correct name.
Add the following job configuration under the scrape configs section.
- job_name: "pushgateway"
        honor_labels: true
        static_configs:
        - targets: [pushgateway.monitoring.svc:9091]
Ensure the target value, here, pushgateway is my service name and monitoring is the Namespace name, if you have given a different name, replace it with your values or provide the IP of the the Pushgateway.
To apply the configuration and reflect the changes in the Prometheus, use the following command.
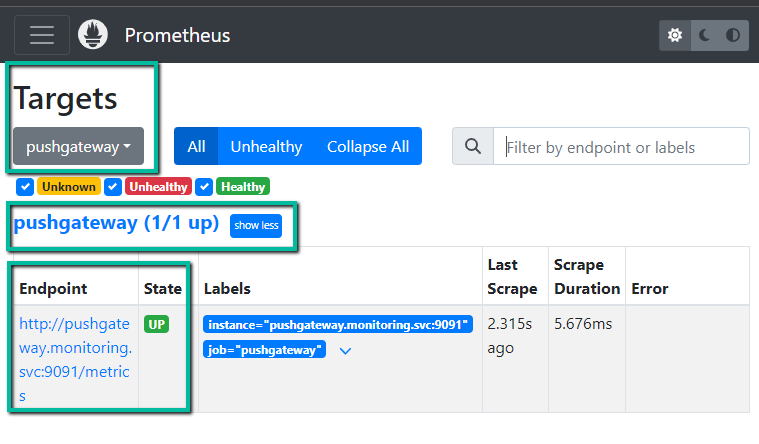
kubectl apply -f config-map.yamlCheck your Prometheus dashboard target section to verify that the configuration is properly done.
If you can't see the updates in the target, then perform the rollout restart to reflect the changes in the dashboard.
kubectl rollout restart deployment prometheus-deployment -n monitoringYour Prometheus deployment and the Namespace name would be different, so ensure before executing the command.
This process might interrupt the scrapping for a few seconds, be aware of that otherwise your certain metrics would be skipped from scrapping.
How to Test the Prometheus Pushgateway?
For testing, I am using a containerized Python script.
Create a deployment file app-deployment.yaml and add the contents.
apiVersion: apps/v1
kind: Deployment
metadata:
  name: python-app
spec:
  replicas: 1
  selector:
    matchLabels:
      app: pushgateway-python-app
  template:
    metadata:
      labels:
        app: pushgateway-python-app
    spec:
      containers:
      - name: pushgateway-python-app
        image: techiescamp/pushgateway-python-app:latest
        ports:
        - containerPort: 8085
This testing image is available in the Dockerhub public repository so that you can use the same image for testing purposes.
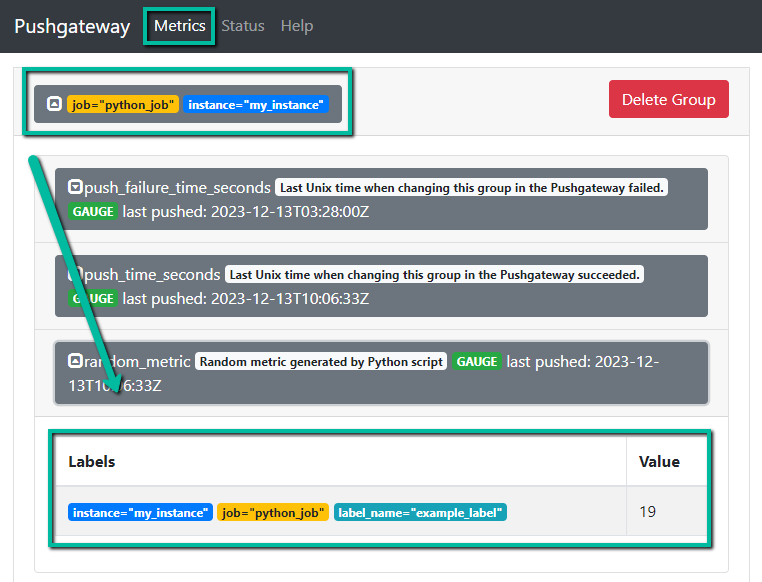
If you use the same image, the container will generate some random values and push those as metrics in the Pushgateway.
To deploy this in the cluster, use the following command.
kubectl apply -f app-deployment.yaml -n monitoringTo list the deployments, use the following command.
kubectl get deployments -n monitoringIf the deployment is successfully done, we can see metrics in the Pushgateway dashboard.
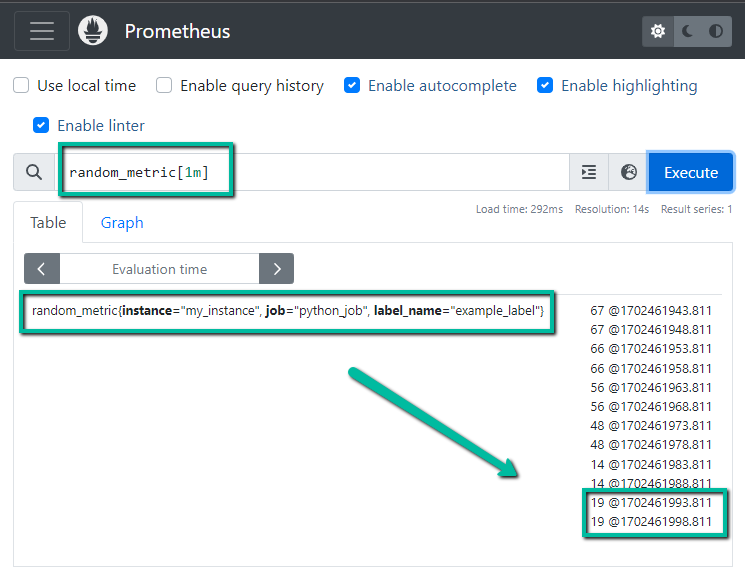
Let's try to make a query with this same metric random_metrics in the Prometheus, if we are getting values there, we can ensure the Prometheus is scraping the metrics from the Pushgateway
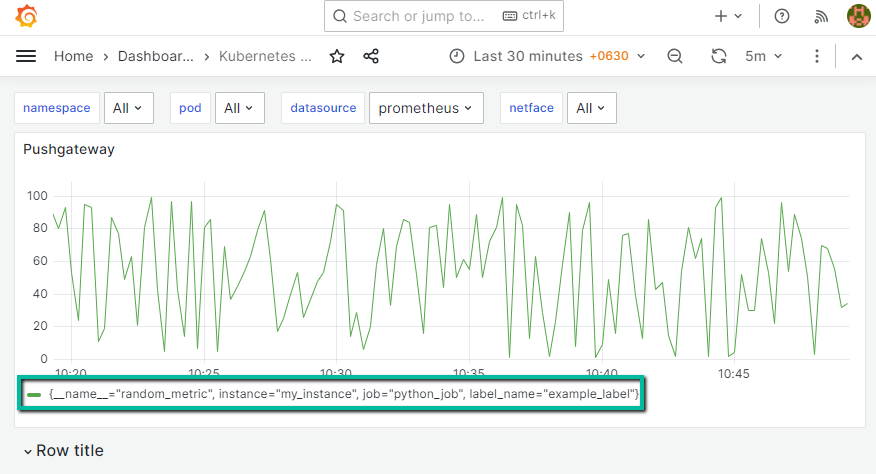
Now, we know Prometheus is successfully scraping so visualization is also possible in Grafana.
If you want to install Grafana on your Kubernetes cluster, please refer to this blog.
Why is Pushgateway important?
We often set cronjobs in Kubernetes, these jobs will start in the defined time and exit when the job is completed. we can't be sure that the Prometheus will scrape the metrics before it exits.
With the help of Pushgateway, when the job executes, the metrics will be sent to the Pushgateway.
For some jobs we can't even know when it executes and when it ends, for example, we can say services, are activated when there is necessary, in that situation if we need metrics then the Pushgateway would be a good option.
Conclusion
Pushgateway is always a custom setup because you will decide what metrics you have to push from the target, so it is very useful for that kind of specific situation.
I believe this setup gives you an overall idea of how to set the Pushgateway on your cluster.
