

Grafana is an open-source lightweight dashboard tool. It can be integrated with many data sources like Prometheus, AWS cloud watch, Stackdriver, etc. Running Grafana on Kubernetes
In our previous posts, we have looked at the following.
This tutorial explains how to run Grafana on Kubernetes cluster. Using Grafana you can simplify Kubernetes monitoring dashboards from Prometheus metrics.
Grafana Kubernetes Manifests
All the Kubernetes manifests (YAML files) used in this tutorial are hosted on Github as well. You can clone it and use it for the setup.
git clone https://github.com/bibinwilson/kubernetes-grafana.gitDeploy Grafana On Kubernetes
Let's look at the Grafana setup in detail.
Step 1: Create a file named grafana-datasource-config.yaml
vi grafana-datasource-config.yamlCopy the following contents.
Note: The following data source configuration is for Prometheus. If you have more data sources, you can add more data sources with different YAMLs under the data section.
apiVersion: v1
kind: ConfigMap
metadata:
  name: grafana-datasources
  namespace: monitoring
data:
  prometheus.yaml: |-
    {
        "apiVersion": 1,
        "datasources": [
            {
               "access":"proxy",
                "editable": true,
                "name": "prometheus",
                "orgId": 1,
                "type": "prometheus",
                "url": "http://prometheus-service.monitoring.svc:8080",
                "version": 1
            }
        ]
    }
Step 2: Create the configmap using the following command.
kubectl create -f grafana-datasource-config.yamlStep 3: Create a file named deployment.yaml
vi deployment.yamlCopy the following contents on the file.
apiVersion: apps/v1
kind: Deployment
metadata:
  name: grafana
  namespace: monitoring
spec:
  replicas: 1
  selector:
    matchLabels:
      app: grafana
  template:
    metadata:
      name: grafana
      labels:
        app: grafana
    spec:
      containers:
      - name: grafana
        image: grafana/grafana:latest
        ports:
        - name: grafana
          containerPort: 3000
        resources:
          limits:
            memory: "1Gi"
            cpu: "1000m"
          requests:
            memory: 500M
            cpu: "500m"
        volumeMounts:
          - mountPath: /var/lib/grafana
            name: grafana-storage
          - mountPath: /etc/grafana/provisioning/datasources
            name: grafana-datasources
            readOnly: false
      volumes:
        - name: grafana-storage
          emptyDir: {}
        - name: grafana-datasources
          configMap:
              defaultMode: 420
              name: grafana-datasources
Note: This Grafana deployment does not use a persistent volume. If you restart the pod all changes will be gone. Use a persistent volume if you are deploying Grafana for your project requirements. It will persist all the configs and data that Grafana uses.
Step 4: Create the deployment
kubectl create -f deployment.yamlStep 5: Create a service file named service.yaml
vi service.yamlCopy the following contents. This will expose Grafana on NodePort 32000. You can also expose it using ingress or a Loadbalancer based on your requirement.
apiVersion: v1
kind: Service
metadata:
  name: grafana
  namespace: monitoring
  annotations:
      prometheus.io/scrape: 'true'
      prometheus.io/port:   '3000'
spec:
  selector:
    app: grafana
  type: NodePort
  ports:
    - port: 3000
      targetPort: 3000
      nodePort: 32000
Step 6: Create the service.
kubectl create -f service.yamlNow you should be able to access the Grafana dashboard using any node IP on port 32000. Make sure the port is allowed in the firewall to be accessed from your workstation.
http://<your-node-ip>:32000You can also use port forwarding using the following command.
kubectl port-forward -n monitoring <grafana-pod-name> 3000 &For example,
vagrant@dcubelab:~$ kubectl get po -n monitoring
NAME                       READY   STATUS    RESTARTS   AGE
grafana-64c89f57f7-kjqrb   1/1     Running   0          10m
vagrant@dcubelab:~$ kubectl port-forward -n monitoring grafana-64c89f57f7-kjqrb 3000 &
You will be able to access Grafana a from http://localhost:3000
Use the following default username and password to log in. Once you log in with default credentials, it will prompt you to change the default password.
User: admin
Pass: admin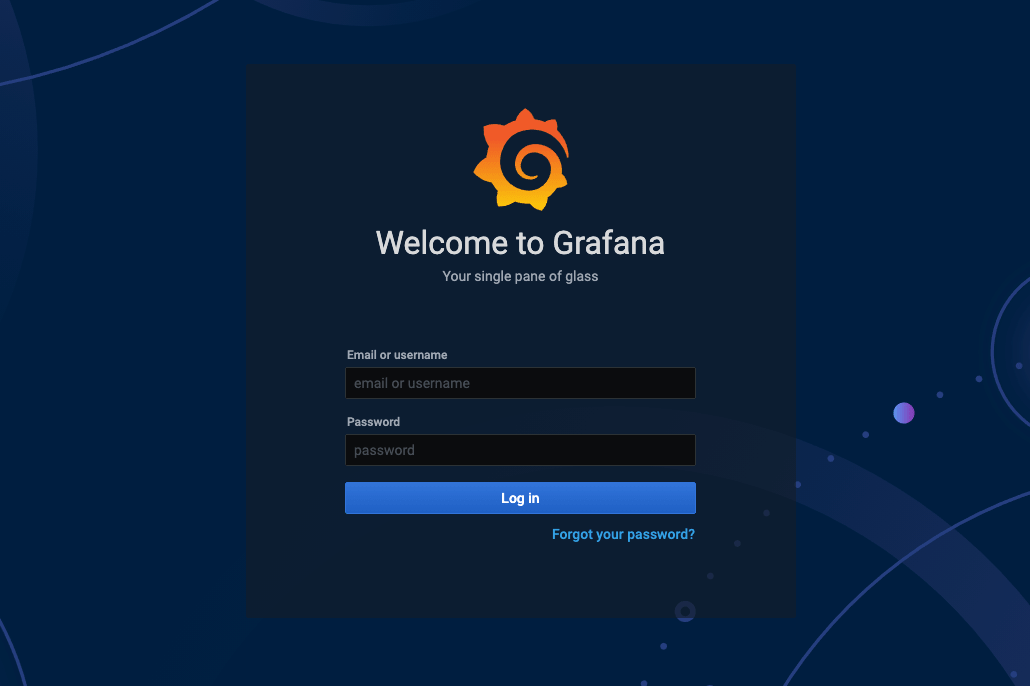
Create Kubernetes Dashboards on Grafana
Creating a Kubernetes dashboard from the Grafana template is pretty easy. There are many prebuilt Grafana templates available for Kubernetes. You can easily have prebuilt dashboards for ingress controllers, volumes, API servers, Prometheus metrics, and much more.
To know more, see Grafana templates for Kubernetes monitoring
Follow the steps given below to set up a Grafana dashboard to monitor kubernetes deployments.
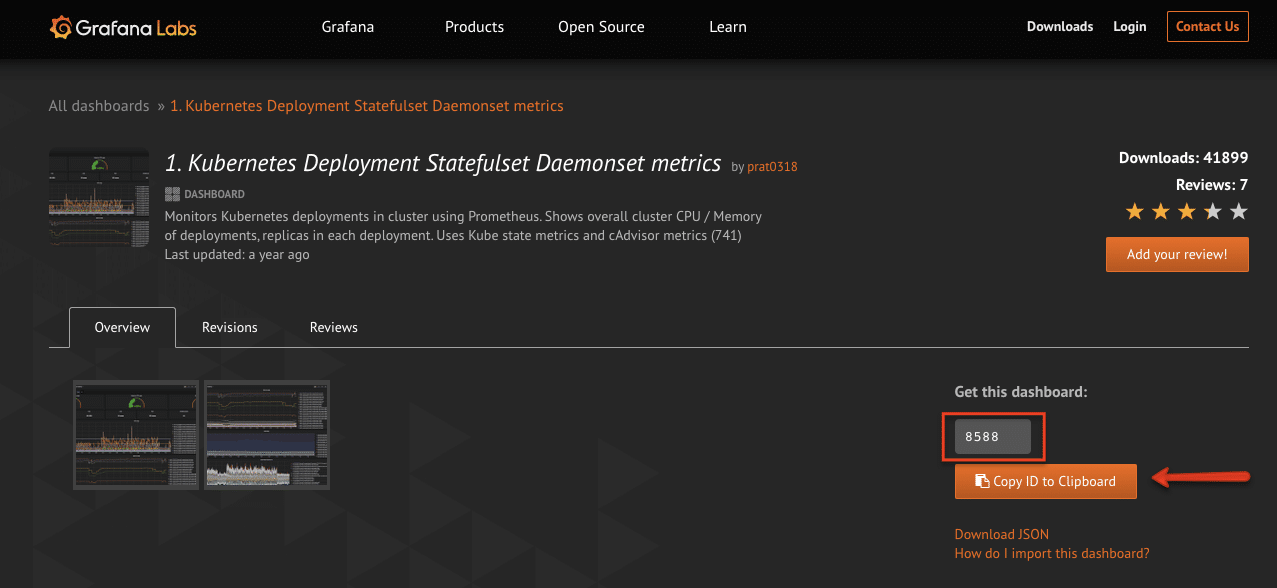
Step 1: Get the template ID from grafana public template. as shown below.
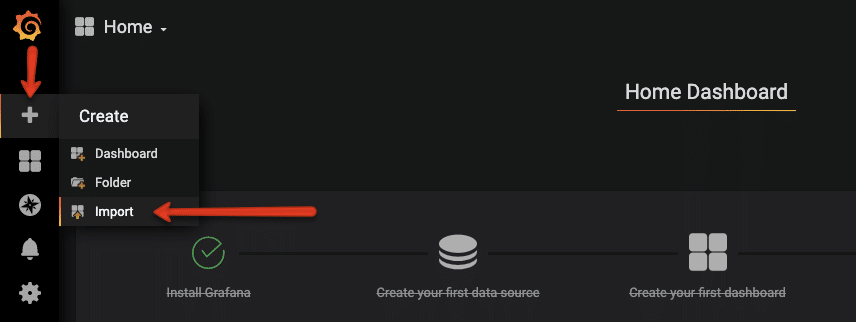
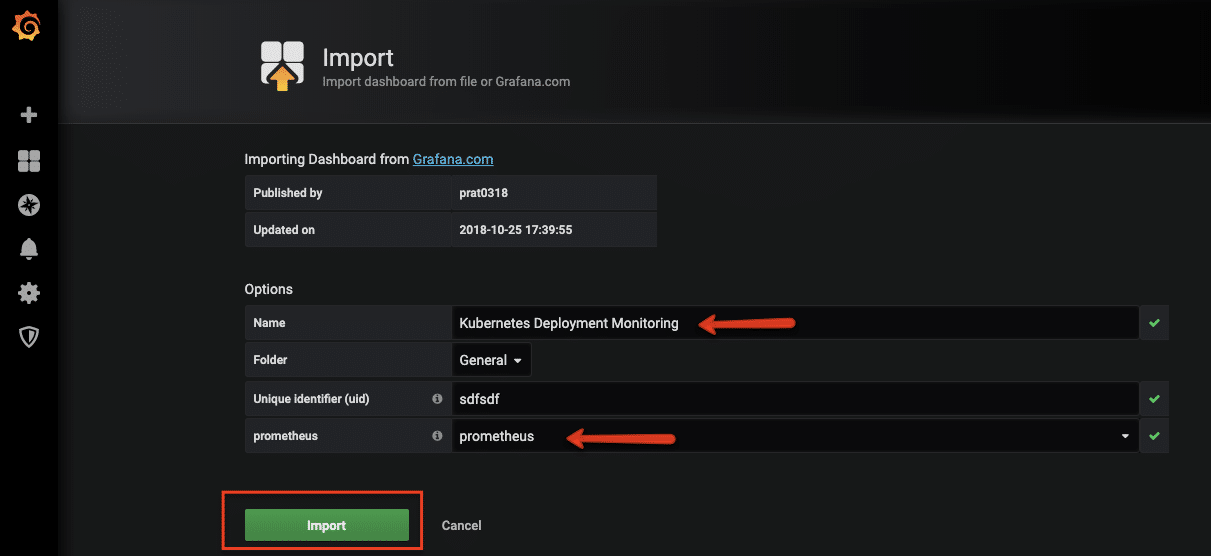
Step 2: Head over to the Grafana dashbaord and select the import option.
Step 3: Enter the dashboard ID you got in step 1
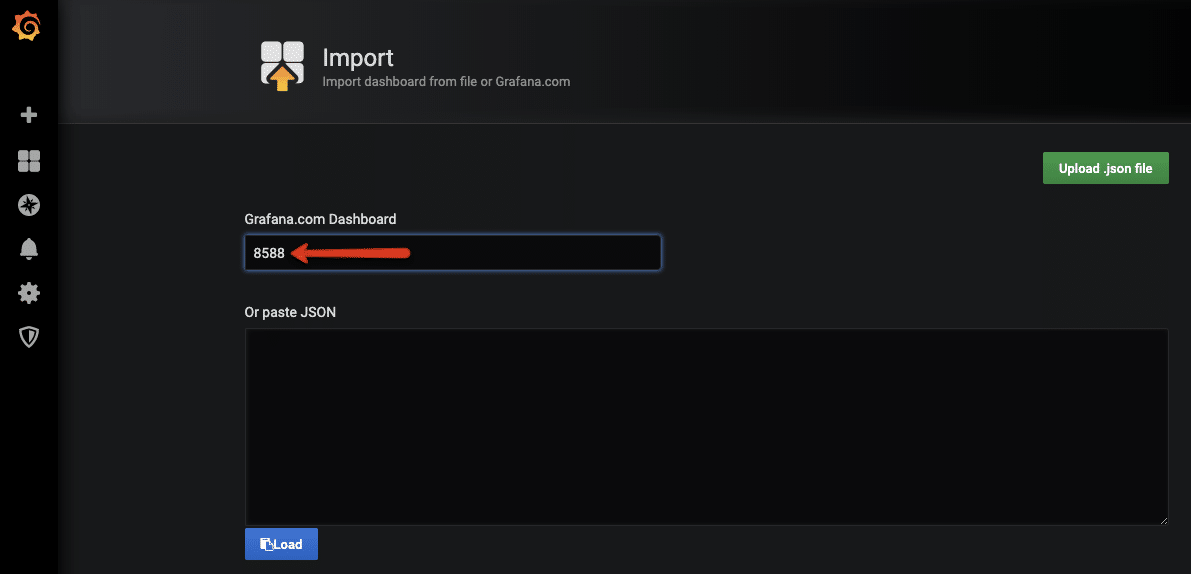
Step 4: Grafana will automatically fetch the template from the Grafana website. You can change the values as shown in the image below and click import.
Note: If you are behind the corporate firewall and cannot download the template using id, you can download the template JSON and paste the JSON in the text box to import it.
You should see the dashboard immediately.
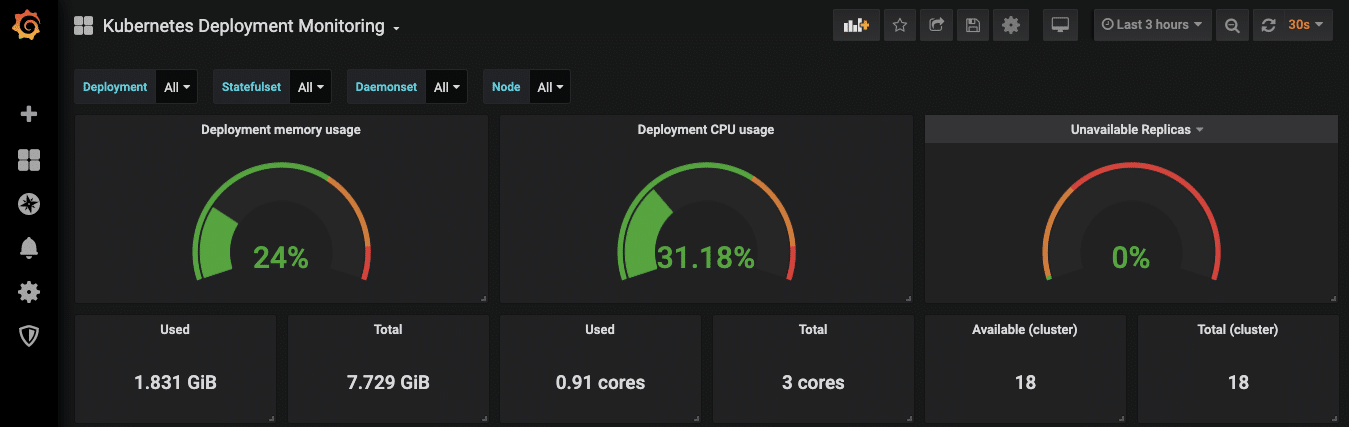
When Grafana is used with Prometheus, it uses PromQL to query metrics from Prometheus. You can use the same PromQL Prometheus queries to build custom dashboards on Grafana.
Conclusion
Grafana is a very powerful tool when it comes to Kubernetes monitoring dashboards.
It is used by many organizations to monitor their Kubernetes workloads. With the wide range of pre-built templates, you can get started with the templates pretty quickly. What more can you ask for right?
Let me know how you are using Grafana in your organization.
Also, let me know if you want to add more information to this article.