
![How To Push ec2 logs to Cloudwatch [Logs & Metrics]](https://storage.ghost.io/c/5f/2f/5f2f4d20-2abf-4534-8d40-7aa233aedd43/content/images/size/w2000/format/webp/2025/03/cloudwatch-application-logs-1.jpg)
In this blog, I will show you how to push ec2 logs to Cloudwatch using the Cloudwatch agent. You can also send ec2 system metrics to cloudwatch.
This article walks you through the steps involved in configuring the Cloudwatch agent on an ec2 instance and configuring it to push the logs and metrics generated by the applications & system services.
Here is what you are going to learn in this blog.
AWS Cloud Watch Agent Use Cases
AWS Cloudwatch logs service has the capability to store custom logs and process metrics generated from your application instances. Here are some example use cases for custom logs and metrics
- Web server (Nginx, Apache, etc ) access or error logs can be pushed to Cloudwatch logs it acts as central log management for your applications running on AWS
- Custom application logs (java, python, etc) can be pushed to cloudwatch and you can set up custom dashboards and alerts based on log patterns.
- Ec2 instance metrics/custom system metrics/ app metrics can be pushed to cloudwatch.
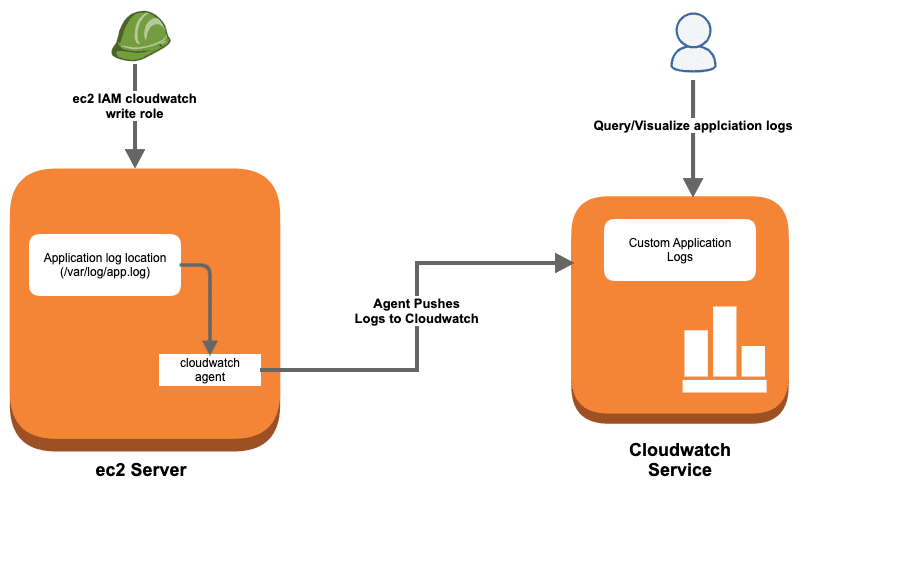
Application Logs To AWS Cloudwatch Workflow
You can send logs from any number of ec2 sources to Cloudwatch. All you need to have is a Cloudwatch agent running on your instance.
Here is what you have to do
- Create a custom ec2 IAM role with Cloudwatch log write access
- Install Cloudwatch logs ec2 agent
- Configure log sources in the Cloudwatch agent configuration file.
- Start the agent with the configuration file.
- Validate logs in the Cloudwatch dashboard.
Let's get started with the setup.
Create an IAM role for Cloudwatch Agent
To set up AWS custom logs, first, you need to create and add a custom ec2 IAM role to your instance. This IAM role will have policies with write access to the Cloudwatch service so that all the logs from ec2 instances can be shipped to Cloudwatch.
Before creating a role, you need to create a custom policy.
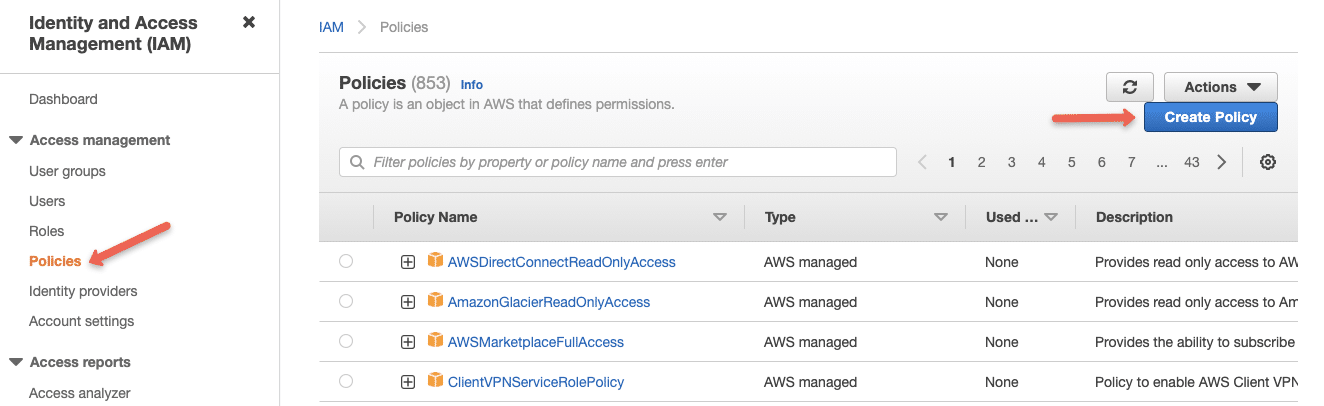
Step 1: Head over to AWS IAM --> Policies--> Create Policy
Step 2: Select the JSON option
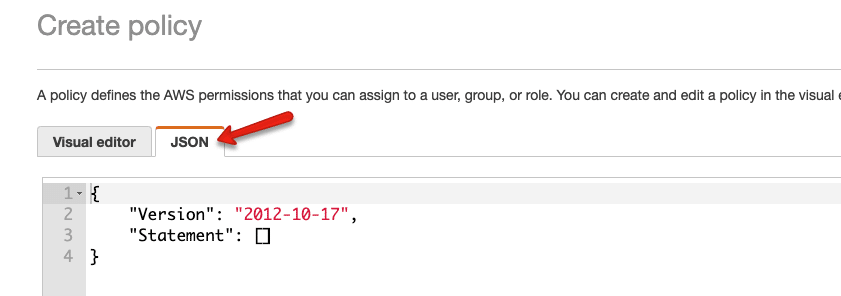
Step 3: Copy the following content in the policy block. We are allowing the required permissions and the logs arn details. Read AWS arn detailed guide to know more about arn.
"Version": "2012-10-17",
"Statement": [
{
"Effect": "Allow",
"Action": [
"logs:CreateLogGroup",
"logs:CreateLogStream",
"logs:PutLogEvents",
"logs:DescribeLogStreams"
],
"Resource": [
"arn:aws:logs:*:*:*"
]
}
]
}
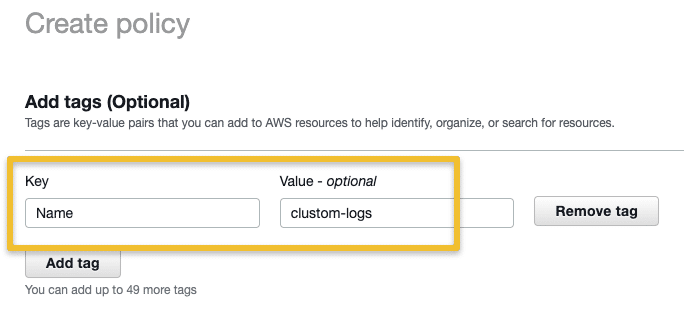
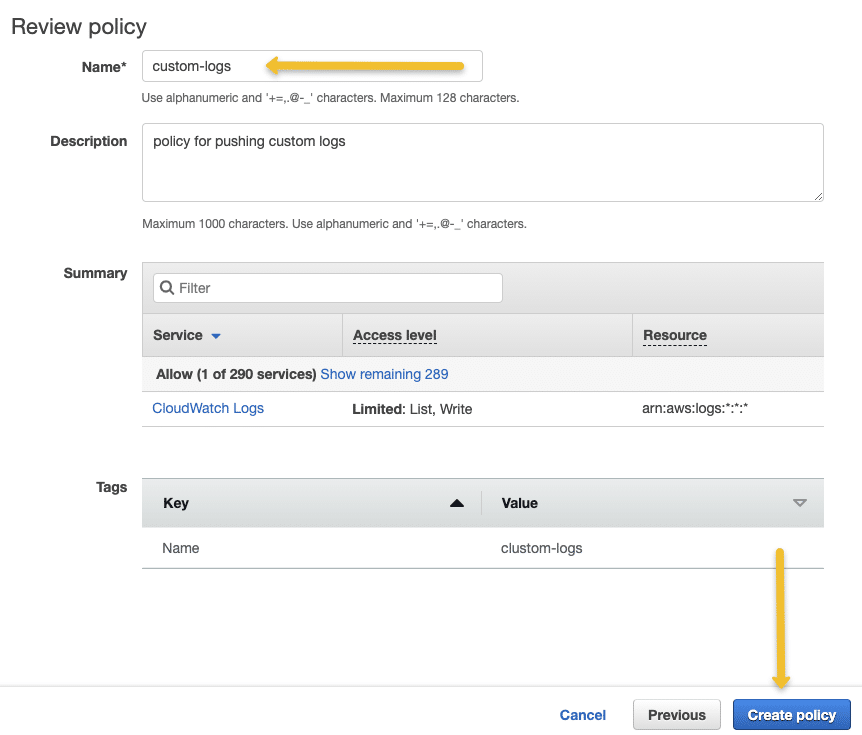
On the next page, add a tag to the policy. Give a name, and description for your policy, and click Next
On the next page, add a policy name, and description and click create policy.
Once you create the policy, you need to create a role with the custom policy you have created.
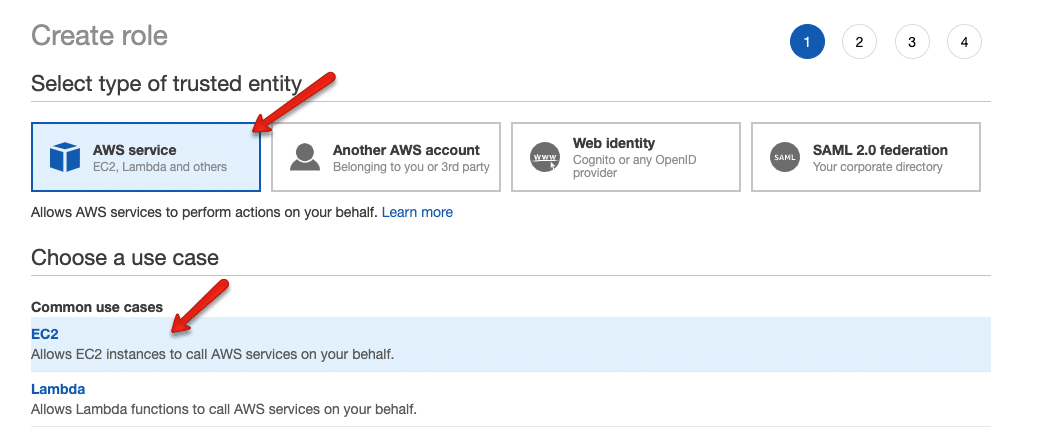
Step 4: Head over to AWS IAM --> Roles --> Create Role and select options as shown below.
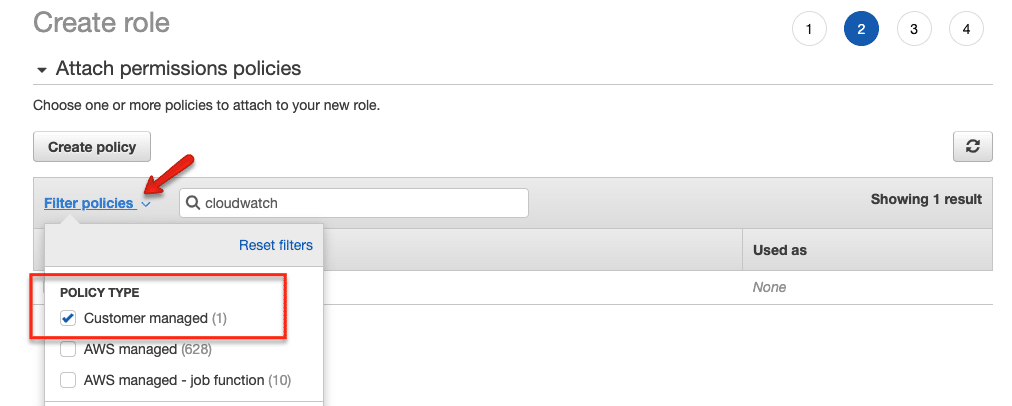
Step 5: From the filter, select "Customer Managed" and select the Policy you created in step 3.
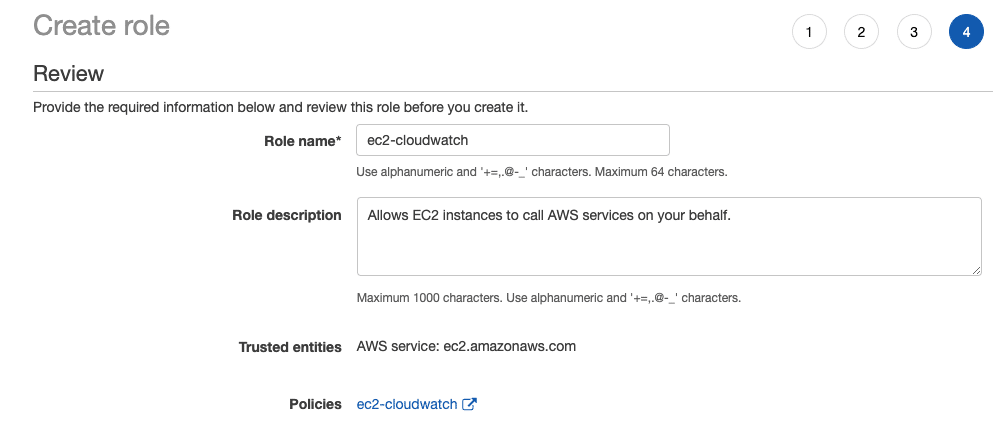
Step 6: Next, enter a role name and create the role.
Add the Cloudwatch Role to the Instance
Follow the steps given below to add the custom IAM role to the ec2 instance where you want to set up the cloud watch agent.
- Head over to ec2 and select the instance in which you want to configure the custom logs.
- Right-click for options and select
Securityand then chooseModify IAM Roleoption. - Select the custom cloud watch IAM role from the dropdown and save it.
Install Cloudwatch Logs Agent
SSH into the ec2 instance and follow the steps given below.
Step 1: Head over to the Cloudwatch agent downloads page. You can select region-wise packages as well.
Step 2: Download the appropriate agent installation file.
In my case it's ubuntu. I am downloading the latest Ubuntu package and installing it.
Redhat users,
https://s3.amazonaws.com/amazoncloudwatch-agent/redhat/amd64/latest/amazon-cloudwatch-agent.rpm
rpm -U amazon-cloudwatch-agent.rpm
Configure Cloudwatch Agent
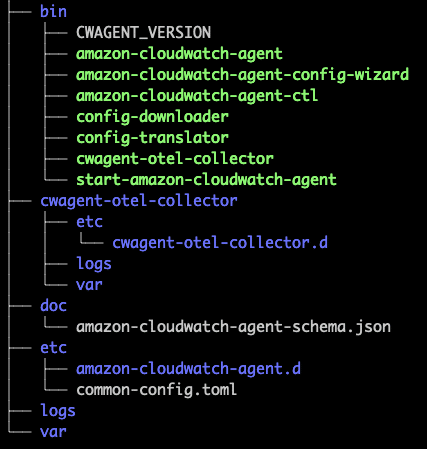
After the installation, you can find all the cloudwatch agent-related config files and executables in the following location.
/opt/aws/amazon-cloudwatch-agentHere is the tree structure of the files present in the directory.
If you are just starting with a cloud watch agent, it is better to run the cloud watch agent wizard that helps you create the log agent configurations.
sudo /opt/aws/amazon-cloudwatch-agent/bin/amazon-cloudwatch-agent-config-wizardIt prompts you with all the agent-related questions. Execute the following command to start the wizard.
For the question, Do you want to store the config in the SSM parameter store?, select No.
The final config files get stored in the following location
/opt/aws/amazon-cloudwatch-agent/bin/config.jsonIf you want to collect the system metrics, install collected on your server.
sudo apt-get update -y
sudo apt-get install collectd
In my case, I am going to replace the default config.json with a custom config.json that collects the following logs and system metrics using collectd.
- Cloudwatch agent logs
- System logs from /var/log/messages
- Nginx access logs from /var/log/nginx/access.log
- Nginx error logs from /var/log/nginx/error.log
Here is the final cloudwatch agent config.
{
	"agent": {
	  "metrics_collection_interval": 10,
	  "run_as_user": "root"
	},
	"logs": {
	  "logs_collected": {
		"files": {
		  "collect_list": [
			{
			  "file_path": "/opt/aws/amazon-cloudwatch-agent/logs/amazon-cloudwatch-agent.log",
			  "log_group_name": "/apps/CloudWatchAgentLog/",
			  "log_stream_name": "{ip_address}_{instance_id}",
			  "timezone": "Local"
			},
			{
			  "file_path": "/var/log/messages",
			  "log_group_name": "/apps/system/messages",
			  "log_stream_name": "{ip_address}_{instance_id}",
			  "timestamp_format": "%b %d %H:%M:%S",
			  "timezone": "Local"
			},
			{
			  "file_path": "/var/log/nginx/access.log",
			  "log_group_name": "/apps/webservers/nginx/access",
			  "log_stream_name": "{ip_address}_{instance_id}",
			  "timestamp_format": "%d/%b/%Y:%H:%M:%S %z",
			  "timezone": "Local"
			}
		  ]
		}
	  }
	},
	"metrics": {
	  "aggregation_dimensions": [
		[
		  "InstanceId"
		]
	  ],
	  "append_dimensions": {
		"AutoScalingGroupName": "${aws:AutoScalingGroupName}",
		"ImageId": "${aws:ImageId}",
		"InstanceId": "${aws:InstanceId}",
		"InstanceType": "${aws:InstanceType}"
	  },
	  "metrics_collected": {
		"collectd": {
		  "metrics_aggregation_interval": 60
		},
		"disk": {
		  "measurement": [
			"used_percent"
		  ],
		  "metrics_collection_interval": 10,
		  "resources": [
			"*"
		  ]
		},
		"mem": {
		  "measurement": [
			"mem_used_percent"
		  ],
		  "metrics_collection_interval": 10
		},
		"statsd": {
		  "metrics_aggregation_interval": 60,
		  "metrics_collection_interval": 10,
		  "service_address": ":8125"
		}
	  }
	}
  }
Now, let's start the Cloudwatch agent using the following.
sudo /opt/aws/amazon-cloudwatch-agent/bin/amazon-cloudwatch-agent-ctl -a fetch-config -m ec2 -c file:/opt/aws/amazon-cloudwatch-agent/bin/config.json -sYou can check the agent status using the following command.
sudo /opt/aws/amazon-cloudwatch-agent/bin/amazon-cloudwatch-agent-ctl -a status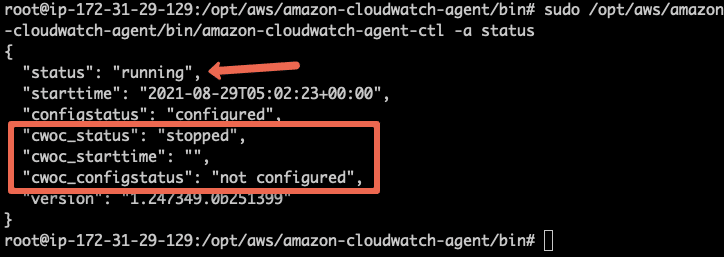
Validating Custom Logs in Cloudwatch Dashboard
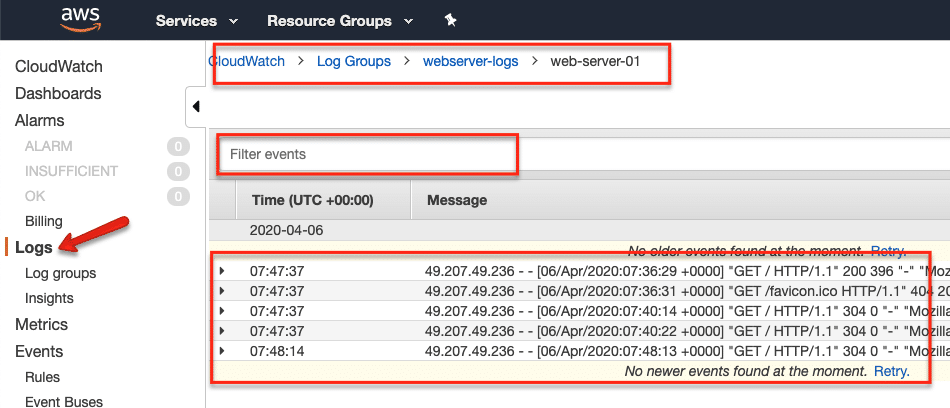
Once the setup is done, you can view all the configured logs under the cloudwatch dashboard (under the logs option)
- Go to Logs --> Log Groups and you will see the log group you mentioned in the agent configuration.
- Select the log group and you should see the instance identified you mentioned in the config.
- If you click the instance identifier, it shows all the logs. You can use the cloud watch filter option to filter and query required logs.
Conclusion
I have explained the Cloudwatch logs agent setup to push application logs to the Cloudwatch logging service. It is a manual setup.
If you want this to be automated, all the agent configuration has to be baked in the ec2 AMI. Few configurations can be added at the system startup using the user data scripts. Again, it depends on what workflow you are opting for.
Not only just logs, but you can also push custom metrics to cloudwatch for monitoring.
If you face any issues or have any different ideas, do let me know in the comment section.