

This Prometheus kubernetes tutorial will guide you through setting up Prometheus on a Kubernetes cluster for monitoring the Kubernetes cluster.
This setup collects node, pods, and service metrics automatically using Prometheus service discovery configurations.
By the end of this guide, you will:
- Understand all the core components of Prometheus
- Know the key Kubernetes objects and manifests involved in setting up Prometheus
- Learn how to update the Prometheus configuration
- Access the Prometheus dashboard using different methods
- Enable Alertmanager, kube-state-metrics, and Node Exporter
- Connect Grafana dashboards for clear and useful monitoring
About Prometheus
Prometheus is a high-scalable open-source monitoring framework. It provides out-of-the-box monitoring capabilities for the Kubernetes container orchestration platform.
Also, In the observability space, it is gaining huge popularity as it helps with metrics and alerts.
Explaining Prometheus is out of the scope of this article. If you want to know more about Prometheus, You can watch all the Prometheus-related videos from here.
However, there are a few key concepts I would like to list for your reference.
- Metric Collection: Prometheus uses the pull model to retrieve metrics over HTTP. There is an option to push metrics to Prometheus using
Pushgatewayfor use cases where Prometheus cannot Scrape the metrics. One such example is collecting custom metrics from short-lived kubernetes jobs & Cronjobs - Metric Endpoint: The systems that you want to monitor using Prometheus should expose the metrics on an
/metricsendpoint. Prometheus uses this endpoint to pull the metrics in regular intervals. - PromQL: Prometheus comes with
PromQL, a very flexible query language that can be used to query the metrics in the Prometheus dashboard. Also, the PromQL query will be used by Prometheus UI and Grafana to visualize metrics. - Prometheus Exporters: Exporters are libraries that convert existing metrics from third-party apps to Prometheus metrics format. There are many official and community Prometheus exporters. One example is, the Prometheus node exporter. It exposes all Linux system-level metrics in Prometheus format.
- TSDB (time-series database): Prometheus uses TSDB for storing all the data efficiently. By default, all the data gets stored locally. However, to avoid a single point of failure, there are options to integrate remote storage for Prometheus TSDB.
Prometheus Architecture
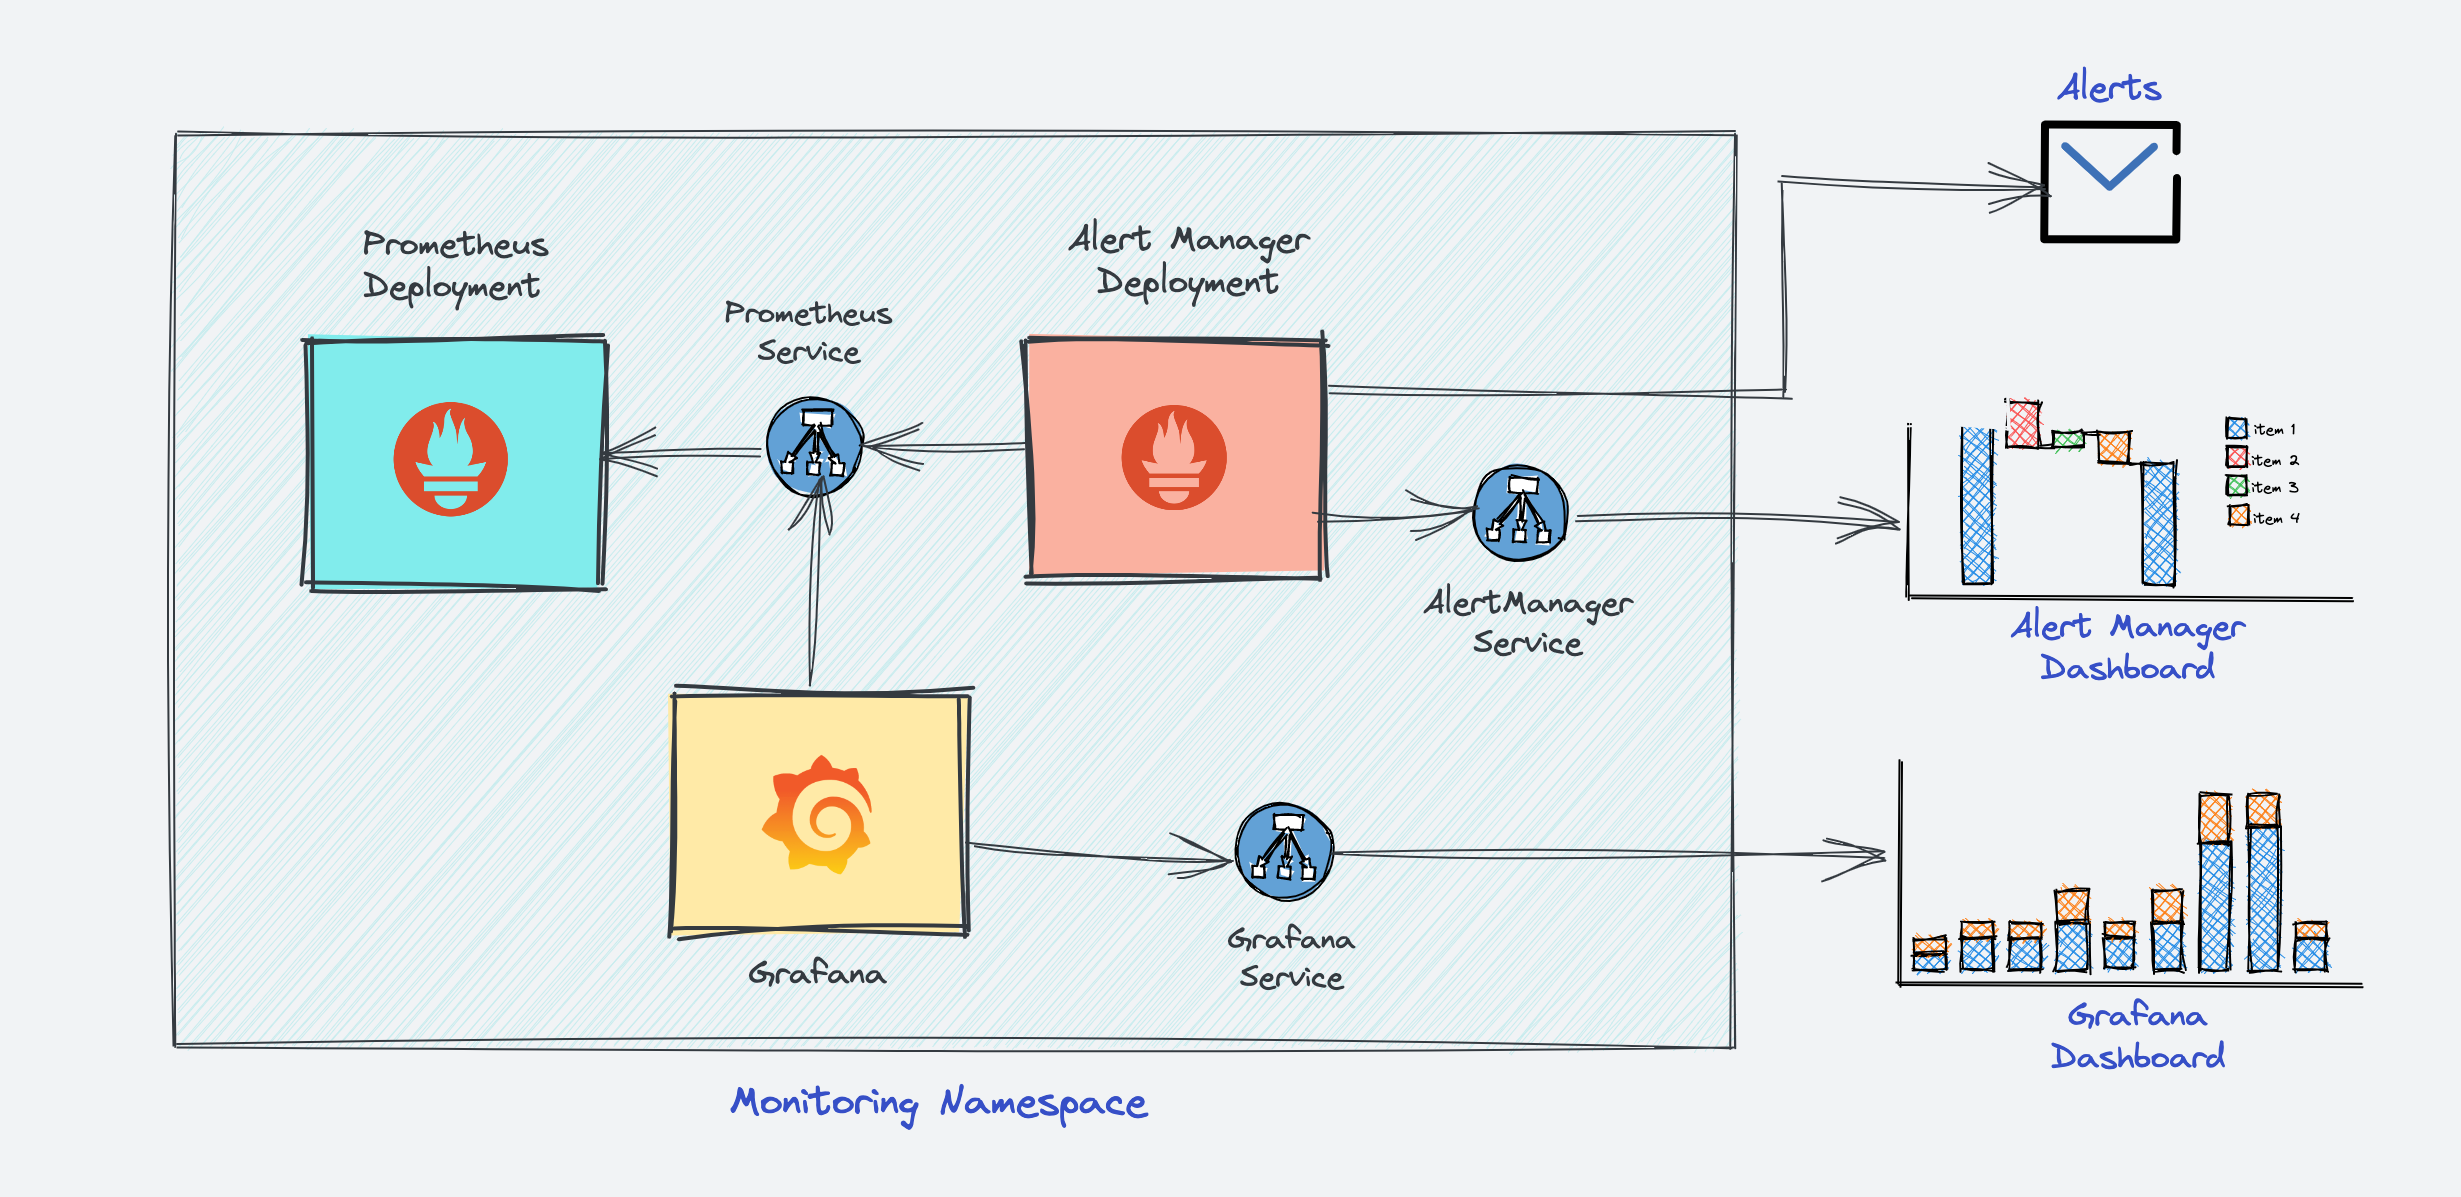
Here is the high-level architecture of Prometheus.
The Kubernetes Prometheus monitoring stack has the following components.
- Prometheus Server
- Alert Manager
- Grafana
In a nutshell, the following image depicts the high-level Prometheus kubernetes architecture that we are going to build. We have separate blogs for each component setup.
Prometheus Monitoring Setup on Kubernetes
I assume that you have a Kubernetes cluster up and running with kubectl setup on your workstation.
The latest Prometheus is available as a docker image in its official docker hub account. We will use that image for the setup.
Connect to the Kubernetes Cluster
Connect to your Kubernetes cluster and make sure you have admin privileges to create cluster roles.
ACCOUNT=$(gcloud info --format='value(config.account)')
kubectl create clusterrolebinding owner-cluster-admin-binding \
    --clusterrole cluster-admin \
    --user $ACCOUNT
Prometheus Kubernetes Manifest Files
All the configuration files I mentioned in this guide are hosted on Github. You can clone the repo using the following command.
git clone https://github.com/techiescamp/kubernetes-prometheusPlease don't hesitate to contribute to the repo for adding features.
You can use the GitHub repo config files or create the files on the go for a better understanding, as mentioned in the steps.
Let's get started with the setup.
Create a Namespace & ClusterRole
First, we will create a Kubernetes namespace for all our monitoring components. If you don't create a dedicated namespace, all the Prometheus kubernetes deployment objects get deployed on the default namespace.
Execute the following command to create a new namespace named monitoring.
kubectl create namespace monitoringPrometheus uses Kubernetes APIs to read all the available metrics from Nodes, Pods, Deployments, etc. For this reason, we need to create an RBAC policy with read access to required API groups and bind the policy to the monitoring namespace.
Step 1: Create a file named clusterRole.yaml and copy the following RBAC role.
get, list, and watch permissions to nodes, services endpoints, pods, and ingresses. The role binding is bound to the monitoring namespace. If you have any use case to retrieve metrics from any other object, you need to add that in this cluster role.apiVersion: rbac.authorization.k8s.io/v1
kind: ClusterRole
metadata:
name: prometheus
rules:
- apiGroups: [""]
resources:
- nodes
- nodes/proxy
- services
- endpoints
- pods
verbs: ["get", "list", "watch"]
- apiGroups:
- extensions
resources:
- ingresses
verbs: ["get", "list", "watch"]
- nonResourceURLs: ["/metrics"]
verbs: ["get"]
---
apiVersion: rbac.authorization.k8s.io/v1
kind: ClusterRoleBinding
metadata:
name: prometheus
roleRef:
apiGroup: rbac.authorization.k8s.io
kind: ClusterRole
name: prometheus
subjects:
- kind: ServiceAccount
name: default
namespace: monitoringStep 2: Create the role using the following command.
kubectl create -f clusterRole.yamlCreate a Config Map To Externalize Prometheus Configurations
All configurations for Prometheus are part of prometheus.yaml file and all the alert rules for Alertmanager are configured in prometheus.rules.
prometheus.yaml: This is the main Prometheus configuration which holds all the scrape configs, service discovery details, storage locations, data retention configs, etc)prometheus.rules: This file contains all the Prometheus alerting rules
By externalizing Prometheus configs to a Kubernetes config map, you don't have to build the Prometheus image whenever you need to add or remove a configuration. You just need to update the Configmap and restart the Prometheus pods to apply the new configuration.
The config map with all the Prometheus scrape config and alerting rules gets mounted to the Prometheus container in /etc/prometheus location as prometheus.yaml and prometheus.rules files.
Lets create the configmap.
Execute the following command to create the config map in Kubernetes.
kubectl create -f https://raw.githubusercontent.com/bibinwilson/kubernetes-prometheus/master/config-map.yamlIt creates two files inside the container.
job.The prometheus.yaml contains all the configurations to discover pods and services running in the Kubernetes cluster dynamically. We have the following scrape jobs in our Prometheus scrape configuration.
kubernetes-apiservers: It gets all the metrics from the API servers.kubernetes-nodes: It collects all the kubernetes node metrics.kubernetes-pods: All the pod metrics get discovered if the pod metadata is annotated withprometheus.io/scrapeandprometheus.io/portannotations.kubernetes-cadvisor: Collects all cAdvisor metrics.kubernetes-service-endpoints: All the Service endpoints are scrapped if the service metadata is annotated with prometheus.io/scrape and prometheus.io/port annotations. It can be used for black-box monitoring.
prometheus.rules contains all the alert rules for sending alerts to the Alertmanager.
Create a Prometheus Deployment
Step 1: Create a file named prometheus-deployment.yaml and copy the following contents onto the file. In this configuration, we are mounting the Prometheus config map as a file inside /etc/prometheus as explained in the previous section.
apiVersion: apps/v1
kind: Deployment
metadata:
  name: prometheus-deployment
  namespace: monitoring
  labels:
    app: prometheus-server
spec:
  replicas: 1
  selector:
    matchLabels:
      app: prometheus-server
  template:
    metadata:
      labels:
        app: prometheus-server
    spec:
      containers:
        - name: prometheus
          image: prom/prometheus
          args:
            - "--storage.tsdb.retention.time=12h"
            - "--config.file=/etc/prometheus/prometheus.yml"
            - "--storage.tsdb.path=/prometheus/"
          ports:
            - containerPort: 9090
          resources:
            requests:
              cpu: 500m
              memory: 500M
            limits:
              cpu: 1
              memory: 1Gi
          volumeMounts:
            - name: prometheus-config-volume
              mountPath: /etc/prometheus/
            - name: prometheus-storage-volume
              mountPath: /prometheus/
      volumes:
        - name: prometheus-config-volume
          configMap:
            defaultMode: 420
            name: prometheus-server-conf

        - name: prometheus-storage-volume
          emptyDir: {}
Step 2: Create a deployment on monitoring namespace using the above file.
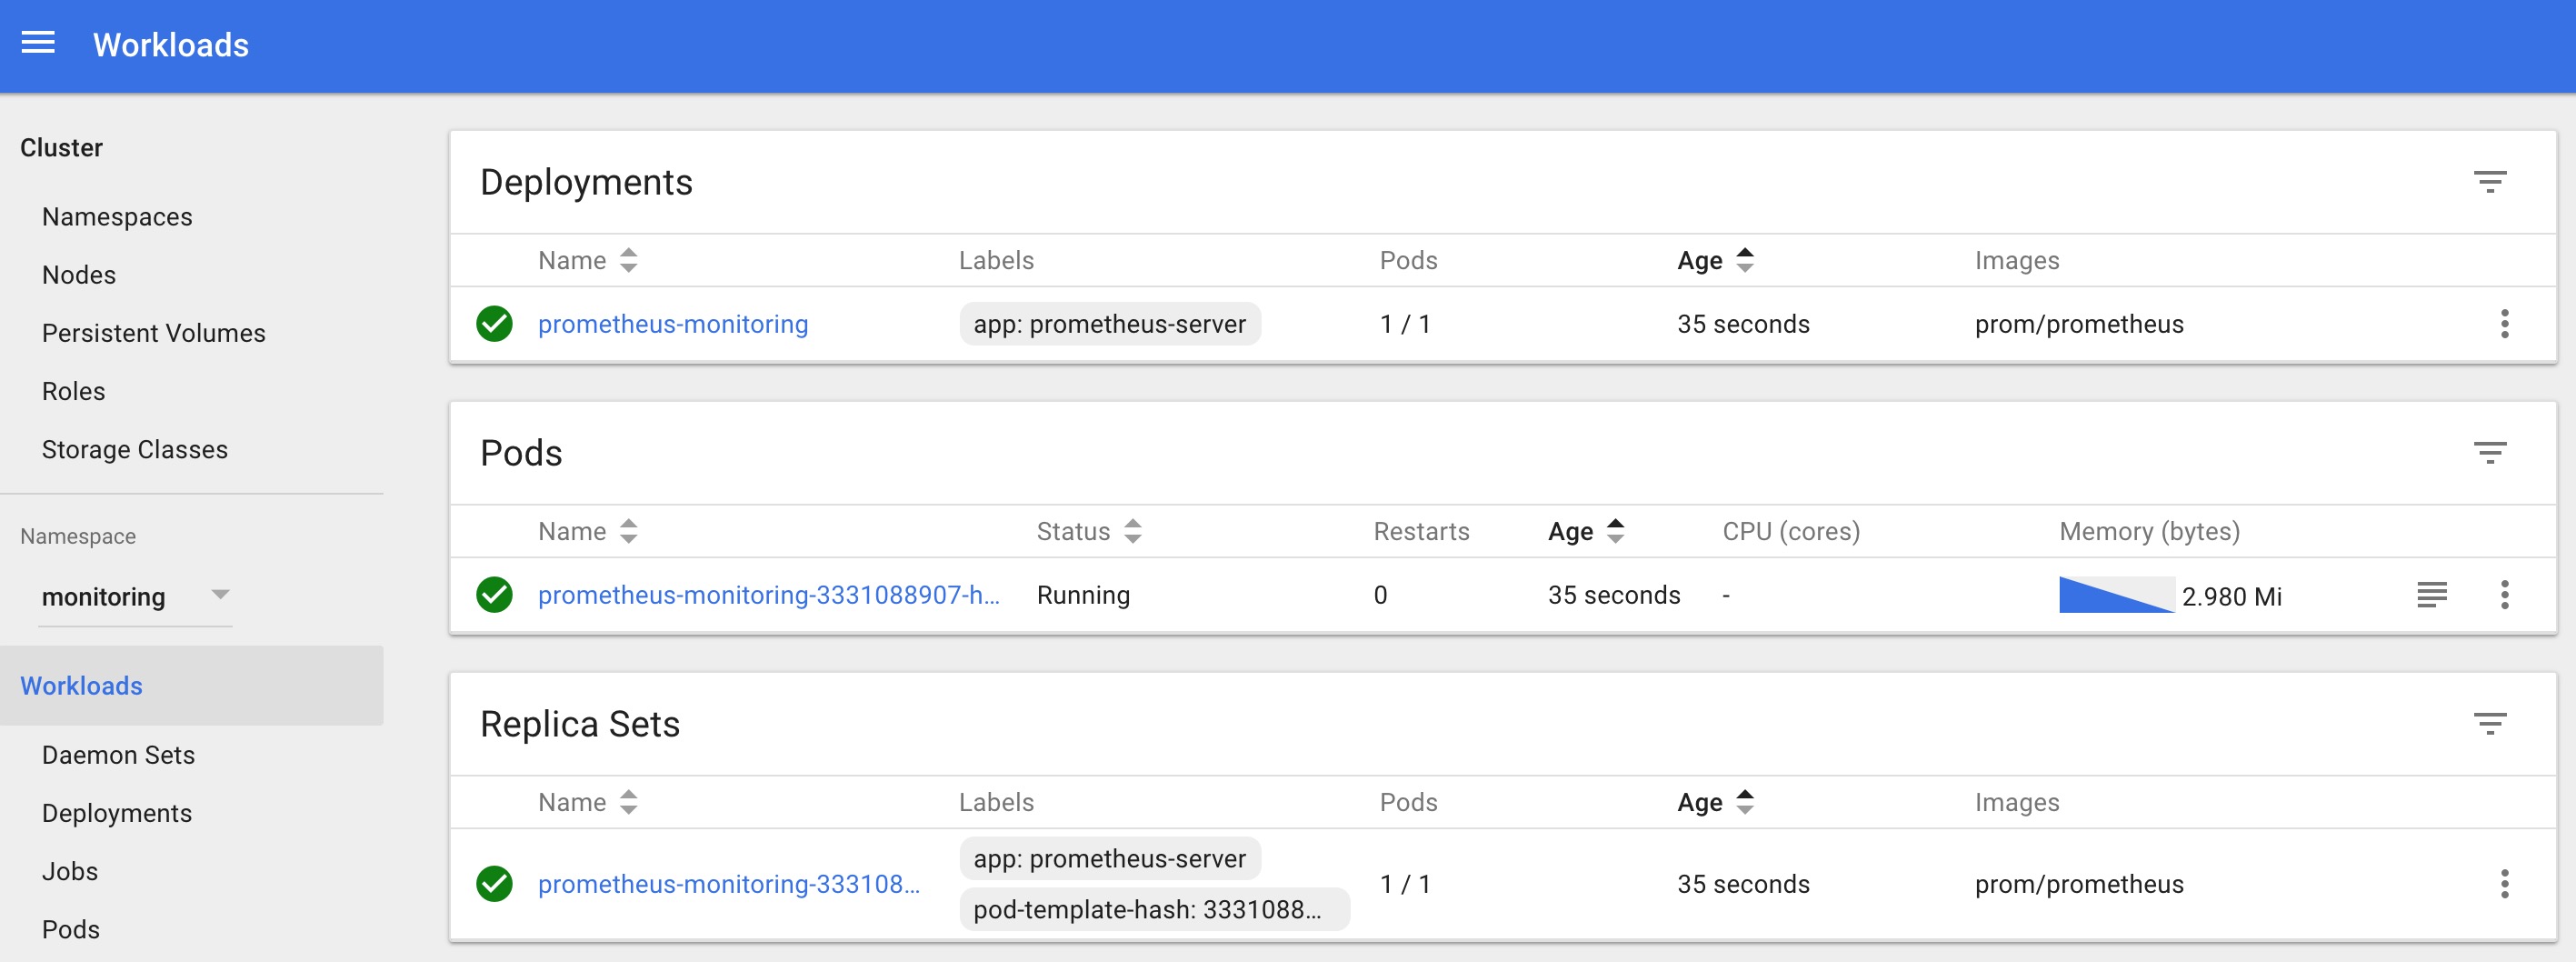
kubectl create -f prometheus-deployment.yaml Step 3: You can check the created deployment using the following command.
kubectl get deployments --namespace=monitoringYou can also get details from the kubernetes dashboard as shown below.
Connecting To Prometheus Dashboard
You can view the deployed Prometheus dashboard in three different ways.
- Using Kubectl port forwarding
- Exposing the Prometheus deployment as a service with NodePort or a Load Balancer.
- Adding an Ingress object if you have an Ingress controller deployed.
Let's have a look at all three options.
Method 1: Using Kubectl port forwarding
Using kubectl port forwarding, you can access a pod from your local workstation using a selected port on your localhost. This method is primarily used for debugging purposes.
Step 1: First, get the Prometheus pod name.
kubectl get pods --namespace=monitoringThe output will look like the following.
➜  kubectl get pods --namespace=monitoring
NAME                                     READY     STATUS    RESTARTS   AGE
prometheus-monitoring-3331088907-hm5n1   1/1       Running   0          5m
Step 2: Execute the following command with your pod name to access Prometheus from localhost port 8080.
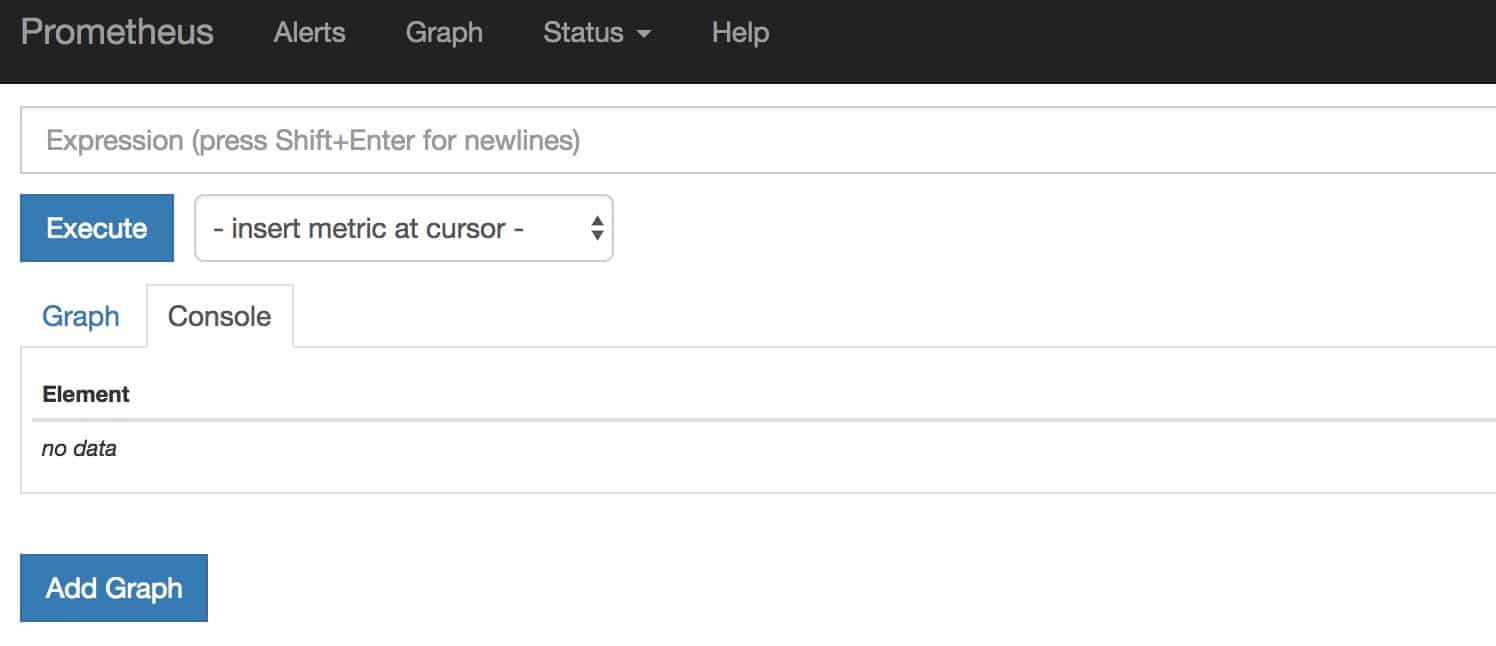
kubectl port-forward prometheus-monitoring-3331088907-hm5n1 8080:9090 -n monitoringStep 3: Now, if you access http://localhost:8080 on your browser, you will get the Prometheus home page.
Method 2: Exposing Prometheus as a Service [NodePort & LoadBalancer]
To access the Prometheus dashboard over a IP or a DNS name, you need to expose it as a Kubernetes service.
Step 1: Create a file named prometheus-service.yaml and copy the following contents. We will expose Prometheus on all kubernetes node IP's on port 30000.
apiVersion: v1
kind: Service
metadata:
  name: prometheus-service
  namespace: monitoring
  annotations:
      prometheus.io/scrape: 'true'
      prometheus.io/port:   '9090'
spec:
  selector:
    app: prometheus-server
  type: NodePort
  ports:
    - port: 8080
      targetPort: 9090
      nodePort: 30000
The annotations in the above service YAML makes sure that the service endpoint is scrapped by Prometheus. The prometheus.io/port should always be the target port mentioned in service YAML
Step 2: Create the service using the following command.
kubectl create -f prometheus-service.yaml --namespace=monitoringStep 3: Once created, you can access the Prometheus dashboard using any of the Kubernetes node's IP on port 30000. If you are on the cloud, make sure you have the right firewall rules to access port 30000 from your workstation.
Step 4: Now, if you browse to status --> Targets, you will see all the Kubernetes endpoints connected to Prometheus automatically using service discovery as shown below.
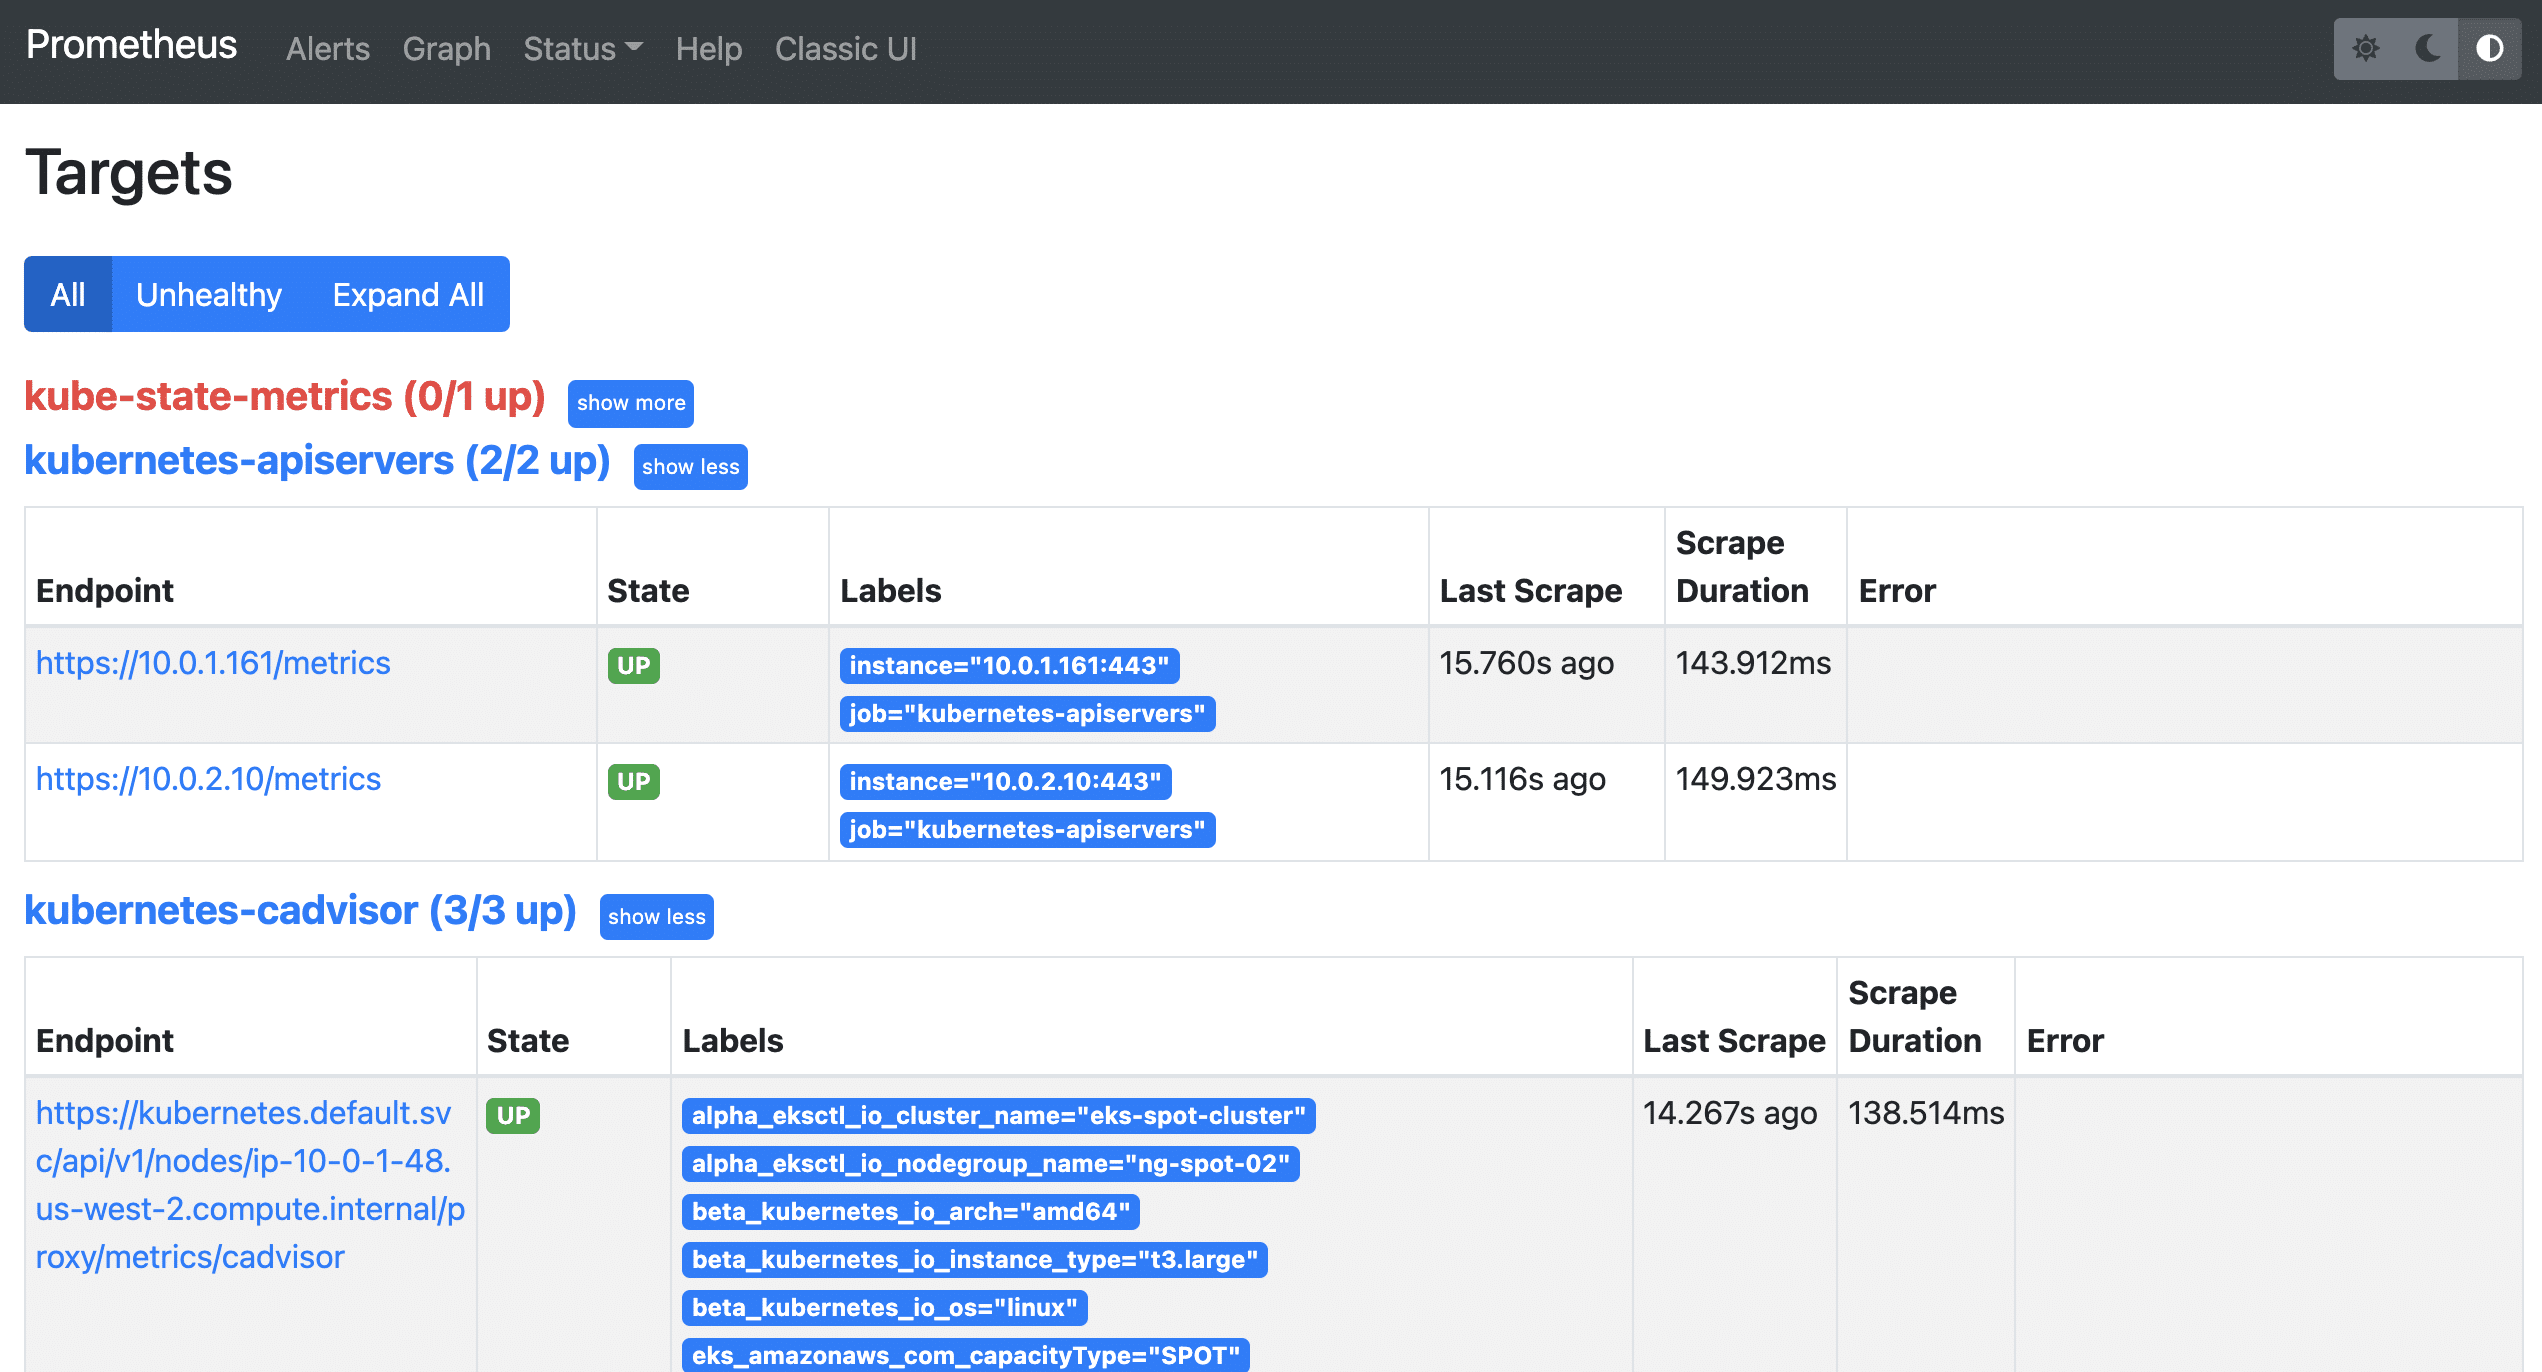
The kube-state-metrics down is expected and I'll discuss it shortly.
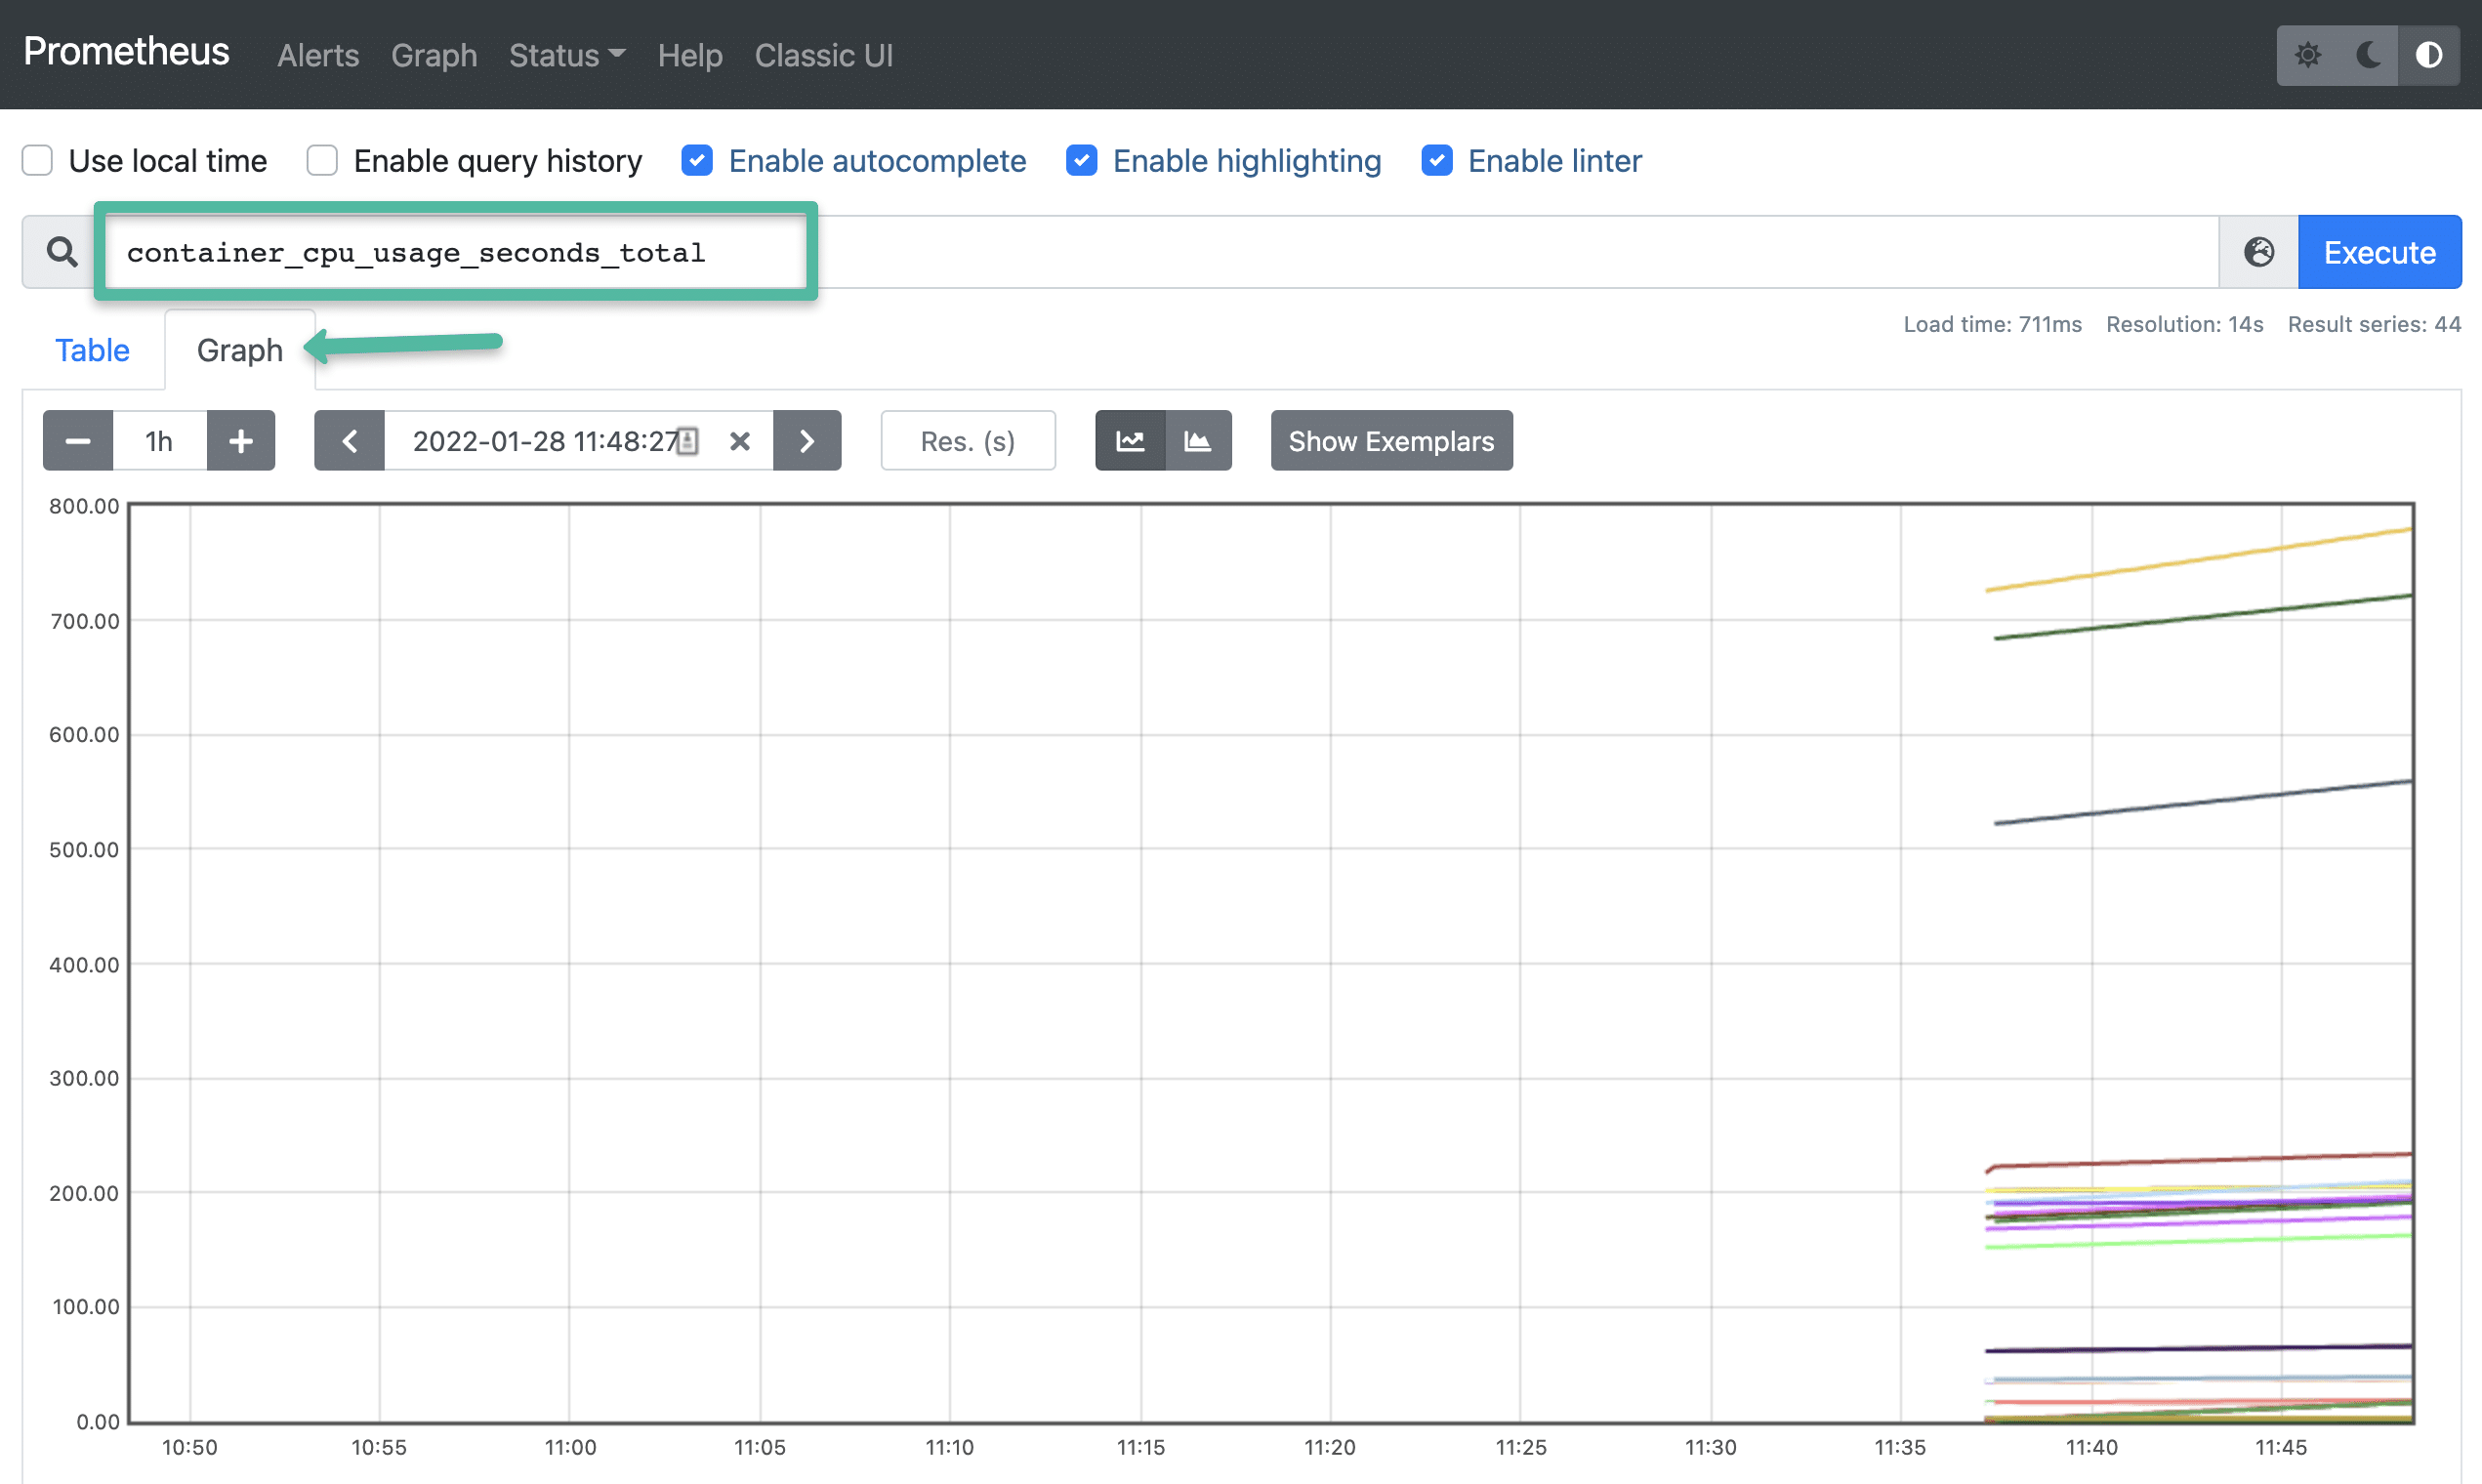
Step 5: You can head over to the homepage and select the metrics you need from the drop-down, and get the graph for the time range you mention. An example graph for container_cpu_usage_seconds_total is shown below.
Method 3: Exposing Prometheus Using Ingress
If you have an existing ingress controller setup, you can create an ingress object to route the Prometheus DNS to the Prometheus backend service.
Also, you can add SSL for Prometheus in the ingress layer. You can refer to the Kubernetes ingress TLS/SSL Certificate guide for more details.
Here is a sample ingress object. Please refer to this GitHub link for a sample ingress object with SSL
apiVersion: extensions/v1beta1
kind: Ingress
metadata:
  name: prometheus-ui
  namespace: monitoring
  annotations:
    kubernetes.io/ingress.class: nginx
spec:
  rules:
  # Use the host you used in your kubernetes Ingress Configurations
  - host: prometheus.example.com
    http:
      paths:
      - backend:
          serviceName: prometheus-service
          servicePort: 8080
Setting Up Kube State Metrics
Kube state metrics service will provide many metrics that are not available by default.
Please make sure you deploy Kube state metrics to monitor all your Kubernetes API objects like deployments, pods, jobs, cronjobs etc.
Please follow this article to setup Kube state metrics on Kubernetes ==> How To Setup Kube State Metrics on Kubernetes
Setting Up Alertmanager
Alertmanager handles all the alerting mechanisms for Prometheus metrics. There are many integrations available to receive alerts from the Alertmanager (Slack, email, API endpoints, etc)
I have covered the Alert Manager setup in a separate article. Please follow ==> Alert Manager Setup on Kubernetes
Setting Up Grafana
Using Grafana, you can create dashboards from Prometheus metrics to monitor the Kubernetes cluster.
The best part is, you don't have to write all the PromQL queries for the dashboards.
There are many community dashboard templates available for Kubernetes. You can import it and modify it as per your needs. I have covered it in the article.
Please follow this article for the Grafana setup ==> How To Setup Grafana On Kubernetes
Setting Up Node Exporter
Node Exporter will provide all the Linux system-level metrics of all Kubernetes nodes.
I have written a separate step-by-step guide on node-exporter daemonset deployment. Please follow Setting up Node Exporter on Kubernetes
The scrape config for node-exporter is part of the Prometheus config map. Once you deploy the node-exporter, you should see node-exporter targets and metrics in Prometheus.
Prometheus Production Setup Considerations
For the production Prometheus setup, there are more configurations and parameters that need to be considered for scaling, high availability, and storage. It all depends on your environment and data volume.
For example, Prometheus Operator project makes it easy to automate Prometheus setup and its configurations.
If you have multiple production clusters, you can use the CNCF project Thanos to aggregate metrics from multiple Kubernetes Prometheus sources.
Thanos provides features like multi-tenancy, horizontal scalability, and disaster recovery, making it possible to operate Prometheus at scale with high availability.
With Thanos, you can query data from multiple Prometheus instances running in different kubernetes clusters in a single place, making it easier to aggregate metrics and run complex queries.
Additionally, Thanos can store Prometheus data in an object storage backend, such as Amazon S3 or Google Cloud Storage, which provides an efficient and cost-effective way to retain long-term metric data.
Conclusion
In this comprehensive Prometheus kubernetes tutorial, I have covered the setup of important monitoring components to understand Kubernetes monitoring.
Also, If you are learning Kubernetes, you can check out my Kubernetes beginner tutorials where I have 60+ comprehensive guides.
Let me know what you think about the Prometheus monitoring setup by leaving a comment.
You can also use this setup to prepare for the Prometheus Certified Associate Certification.