

In this blog, we will look into a step-by-step guide to setup Grafana Loki on Kubernetes using Helm.
We will also look at setting up Alloy which is an agent for Loki to collect logs and setup Grafana for querying logs using Loki.
Grafana Loki is an open-source log aggregation system that supports large-scale log management. It is a widely adopted tool for organizations observability stack.
If you want to learn in detail about Grafana Loki's architecture, read the detailed Grafana Loki Architecture blog.
Pods that will be deployed for Loki are listed below:
- Loki (sts) - The Loki pod contains all its components, like ingester, distributor, etc.
This pod is responsible for compressing the logs into chunks and storing them, whether it's configured for the local filesystem or the external object storage. - Loki-canary (daemonset): This is a health check pod for Loki. It sends dummy logs to check Loki's performance, such as latency and success rates.
- Loki-chunks-cache (sts): This caches the log chunks that have been recently queried so that the same chunk can be queried faster next time.
- Loki-gateway (deployment): This is an Nginx Ingress pod that routes requests to the correct Loki components. It will be more helpful if you use it with Loki Micro Services.
- Loki-results (sts): This caches the results from previous queries for faster query if the same query is used next time.
Loki Workflow
A workflow overview of Loki is shown in the diagram below.
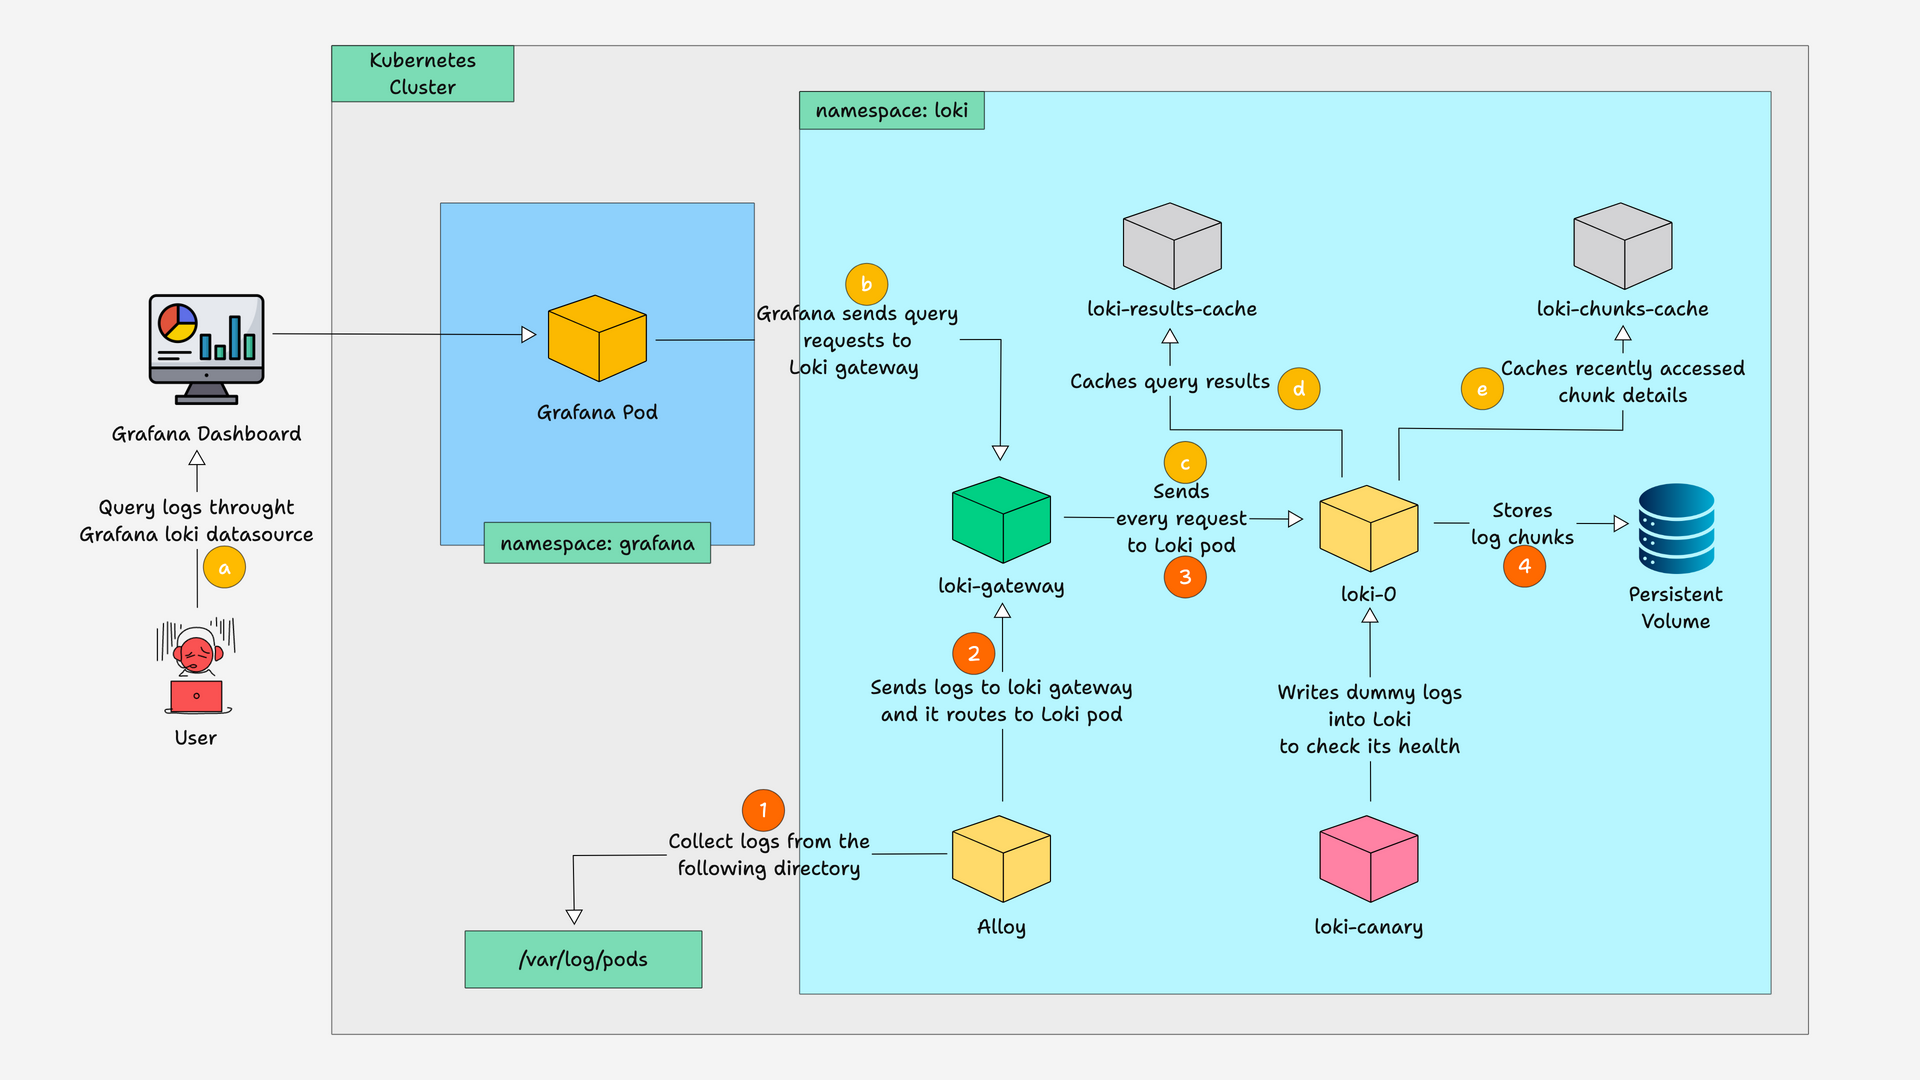
Let me explain the diagram
- The diagram shows two types of workflow, one given in numbers and the other in letters. Let's see about numbers first.
- It starts with
Grafana Alloy, a Loki log-collecting agent that collects logs from the/var/log/podsdirectory. - The collected logs are sent to
Loki-gateway, which routes them to theLoki pod. - In this Loki setup,
log ingestion,compression, andstoragehappen inside the same pod. Once it is done, it stores the compressed log chunks in thePV. - The letter flow starts with a
userquery the logs through theGrafana dashboard. GrafanaSends the query requests to theLoki gatewayand it routes the request to the Loki pod.- After getting the query request, the Loki pod sends back the correct logs based on the query.
- The query results are then stored in the
result cache, and the recently accessed chunk info is cached in thechunk cache. - And there is
canary, which sends dummy logs to Loki pod to check its health.
Setup Prerequisites
The following are the prerequisites for this setup.
- Kubernetes Cluster
- Kubectl
- Helm installed in your system
Steps to Setup Grafana Loki on Kubernetes
If you are ready with the prerequisites, follow the steps below to set up Loki on Kubernetes using Helm.
Step 1: Add Grafana repo
Add a Grafana repo to your system to download the helm chart and set up Loki. Run the following command to add the repo
helm repo add grafana https://grafana.github.io/helm-chartsOnce the repo is added, run the following command to update the repo to make sure the repo is up-to-date
helm repo updateNow, list every repo with the word Loki using the command
helm search repo lokiYou will get the list of repos with the word Loki as shown below
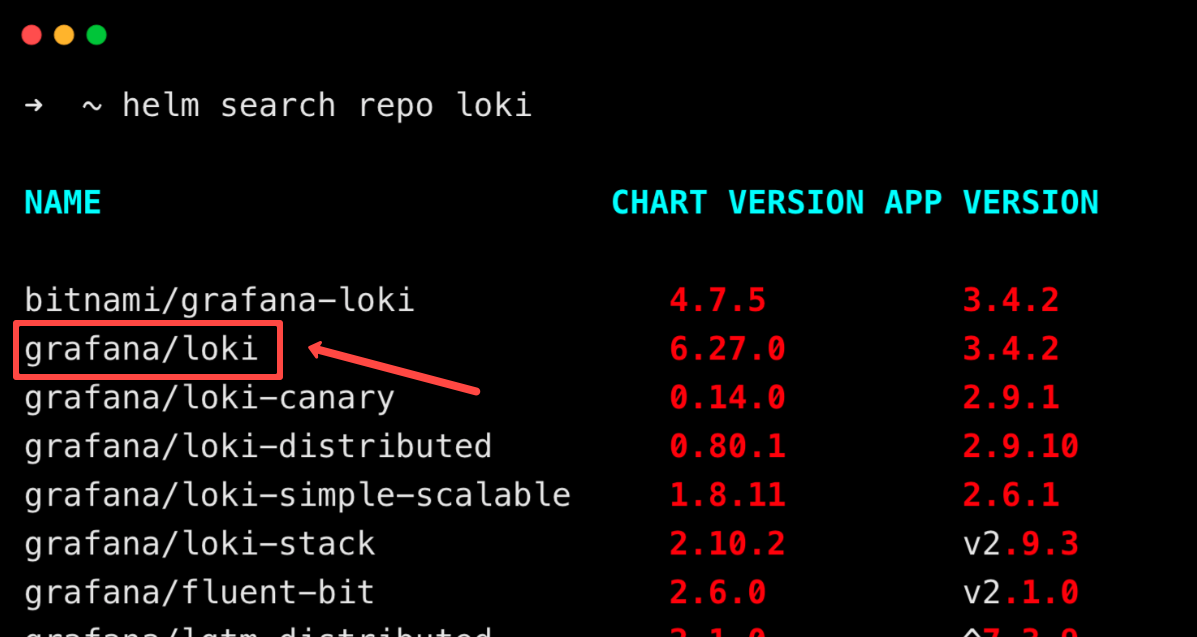
From these repos, we are going to use the grafana/loki Helm chart repo to deploy Loki.
Step 2: Customize the Loki Helm Values file
Before deploying, we need to update some configurations in the helm chart.
Use the below command to save the default values of the helm chart in a YAML file.
helm show values grafana/loki > loki.yamlYou can also use the custom values file that we created below.
loki:
  commonConfig:
    replication_factor: 1
  storage:
    type: 'filesystem'
    bucketNames:
      chunks: chunks
      ruler: ruler
      admin: admin
  schemaConfig:
    configs:
      - from: "2024-04-01"
        store: tsdb
        object_store: filesystem
        schema: v13
        index:
          prefix: loki_index_
          period: 24h
  storage_config:
    filesystem:
      directory: /tmp/loki/chunks
  pattern_ingester:
    enabled: true
  limits_config:
    allow_structured_metadata: true
    volume_enabled: true
  ruler:
    enable_api: true
  auth_enabled: false

minio:
  enabled: false

deploymentMode: SingleBinary

singleBinary:
  replicas: 1
  persistence:
    storageClass: gp2
    accessModes:
      - ReadWriteOnce
    size: 20Gi

  resources:
    requests:
      cpu: "1"
      memory: "2Gi"
    limits:
      cpu: "2"
      memory: "4Gi"

sidecar:
  image:
    repository: kiwigrid/k8s-sidecar
    tag: 1.30.0
  resources:
    requests:
      cpu: 50m
      memory: 50Mi
    limits:
      cpu: 100m
      memory: 100Mi

backend:
  replicas: 0
read:
  replicas: 0
write:
  replicas: 0

chunksCache:
allocatedMemory: 500In this, we are using the pods filesystem as storage for logs, which is a temporary storage.
For the production environment, configure external storage like AWS S3, Azure Blob Storage, etc.
deploymentMode: SingleBinary

singleBinary:
  replicas: 1
  persistence:
    storageClass: gp2
    accessModes:
      - ReadWriteOnce
    size: 20Gi
Note: By specifying the deployment mode asSingleBinary, we are deploying Loki asmonolithic.
It is a single binary deployment, which means all its components, such as the ingester, distributor, etc, run as a single pod.
The persistence volume configuration is also set with 20GB the storage, you can modify it as per your requirements.
Then, we configured the resource limit and requested the Loki and sidecar containers.
chunksCache:
  allocatedMemory: 1024
We have also set the allocatedMemory for chunksCache pod to 1GB, by default it allocates 8GB for the pod, and it results in the chunksCache pod in the pending state with the following error.
Warning FailedScheduling 96s (x2 over 97s) default-scheduler 0/2 nodes are available: 2 Insufficient memory. preemption: 0/2 nodes are available: 2 No preemption victims found for incoming pod.If you have more resources on your cluster, you can remove the above chunksCache allocatedMemory block from the values file.
Since Loki is deployed as a StatefulSet, the logs will be saved on the same persistent volume even if the Loki pod is deleted and deployed again.
Following are the images used in this Helm chart.
- grafana/loki
- nginxinc/nginx-unprivileged
- grafana/loki-canary
- grafana/loki-helm-test
- memcached
- prom/memcached-exporter
- kiwigrid/k8s-sidecar
Note: Setting up Loki as MicroService or Scalable mode is not so different from setting up Monolithic Loki, you just have to change the deployment mode in values file and increase the replicas of each Loki components.
Step 3: Deploy Loki
Once the values file is set, deploy the Loki Helm chart with the values file using the following command.
helm install loki grafana/loki -n loki --create-namespace -f loki.yamlThis creates a namespace loki and deploys the pods.
Once the above command completes running, run the following command to check if the Loki pods are deployed.
kubectl get po -n lokiYou will get the following output.
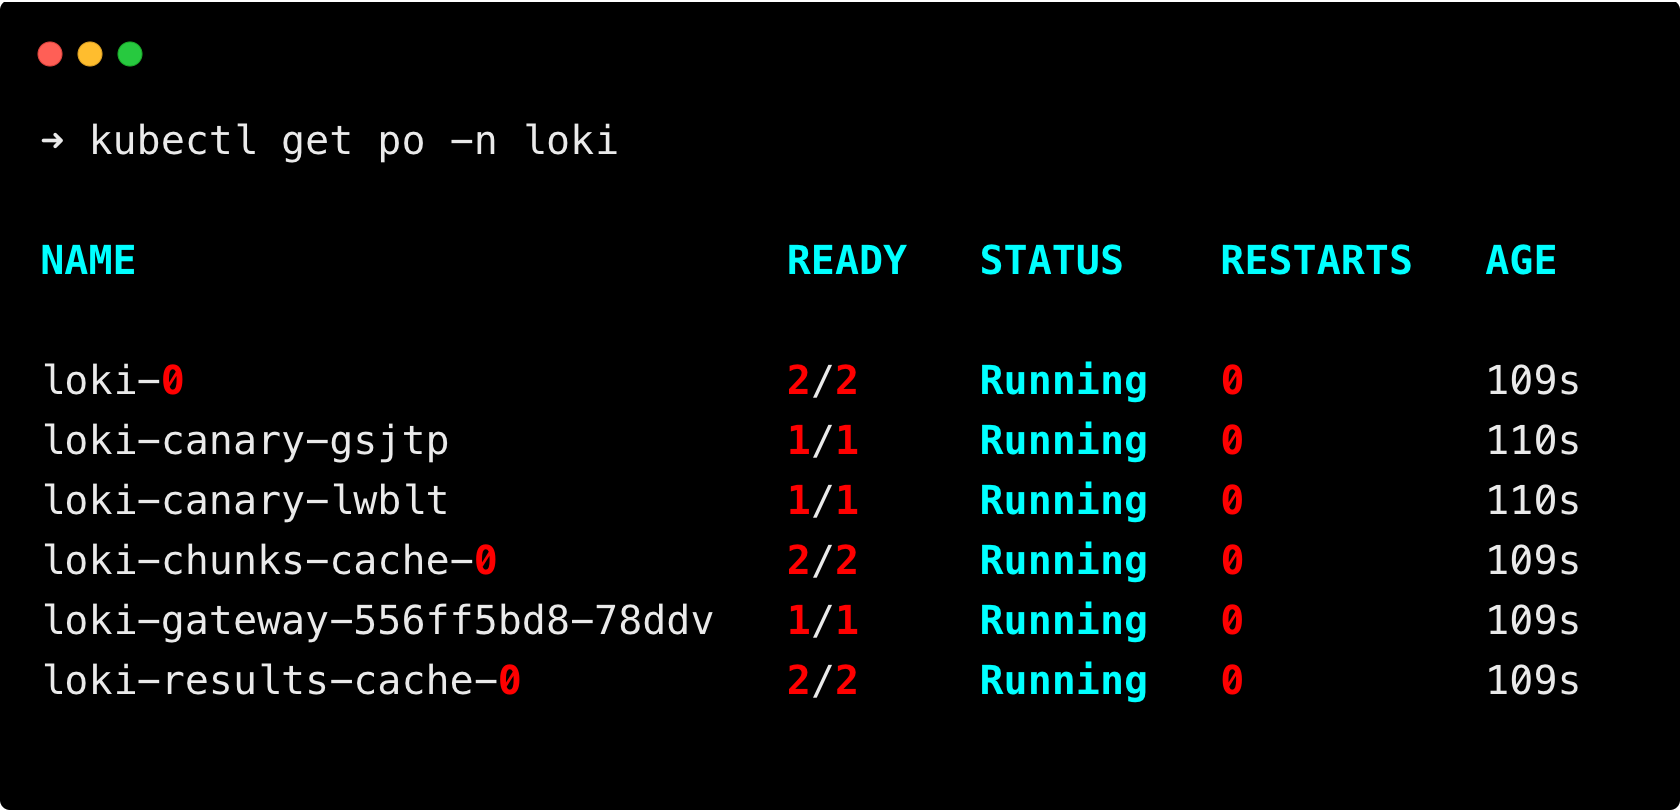
If every pod is running, move on to the next step.
Step4: Customize Grafana Alloy Helm Values file
The next step is to deploy Alloy, which is a log collecting agent for Loki.
Download the Alloy values file using the following command, if you need to make any changes.
helm show values grafana/alloy > alloy.yamlYou can also use our custom values file.
alloy:
  configMap:
    content: |-
      logging {
        level = "debug"
        format = "logfmt"
      }
      discovery.kubernetes "pods" {
        role = "pod"
      }
      discovery.relabel "pods" {
        targets = discovery.kubernetes.pods.targets

        rule {
          source_labels = ["__meta_kubernetes_namespace"]
          target_label = "namespace"
          action = "replace"
        }

        rule {
          source_labels = ["__meta_kubernetes_pod_label_app_kubernetes_io_name"]
          target_label = "app"
          action = "replace"
        }

        rule {
          source_labels = ["__meta_kubernetes_pod_container_name"]
          target_label = "container"
          action = "replace"
        }

        rule {
          source_labels = ["__meta_kubernetes_pod_name"]
          target_label = "pod"
          action = "replace"
        }
      }
      loki.source.kubernetes "pods" {
        targets    = discovery.relabel.pods.output
        forward_to = [loki.process.process.receiver]
      }
      loki.process "process" {
        forward_to = [loki.write.loki.receiver]

        stage.drop {
          older_than          = "1h"
          drop_counter_reason = "too old"
        }
        stage.match {
          selector = "{instance=~\".*\"}"
          stage.json {
            expressions = {
              level = "\"level\"",
            }
          }
          stage.labels {
            values = {
              level = "level",
            }
          }
        }
        stage.label_drop {
          values = [ "service_name" ]
        }
      }
      loki.write "loki" {
        endpoint {
          url = "http://loki-gateway/loki/api/v1/push"
        }
      }
  mounts:
    varlog: true
    dockercontainers: true

  resources:
    limits:
      cpu: 200m
      memory: 128Mi
    requests:
      cpu: 100m
      memory: 128Mi
We have added resource request and limit for alloy pods.
loki.write "loki" {
  endpoint {
    url = "http://loki-gateway/loki/api/v1/push"
  }
}
The above block specifies the loki gateway endpoint, where the logs must be sent.
By default the URL will be http://loki-gateway/loki/api/v1/push.
If you disabled Loki gateway, the URL will be changed, which will be Loki’s service URL http://loki:3100/loki/api/v1/push.
This URL will only work if both Loki and Alloy are deployed in the same namespace, if both are in different namespaces, the URL will be http://loki.loki.svc.cluster.local:3100/loki/api/v1/push.
Following are the images used in this Helm chart.
- grafana/alloy
- prometheus-operator/prometheus-config-reloader
Step 5: Install Grafana Alloy
Once the values file is set, deploy the Alloy application with the values file using the following command.
helm install grafana-alloy grafana/alloy -n loki -f alloy.yamlRun the following command to check if the alloy pods are deployed.
kubectl get po -n lokiYou will get the following output.
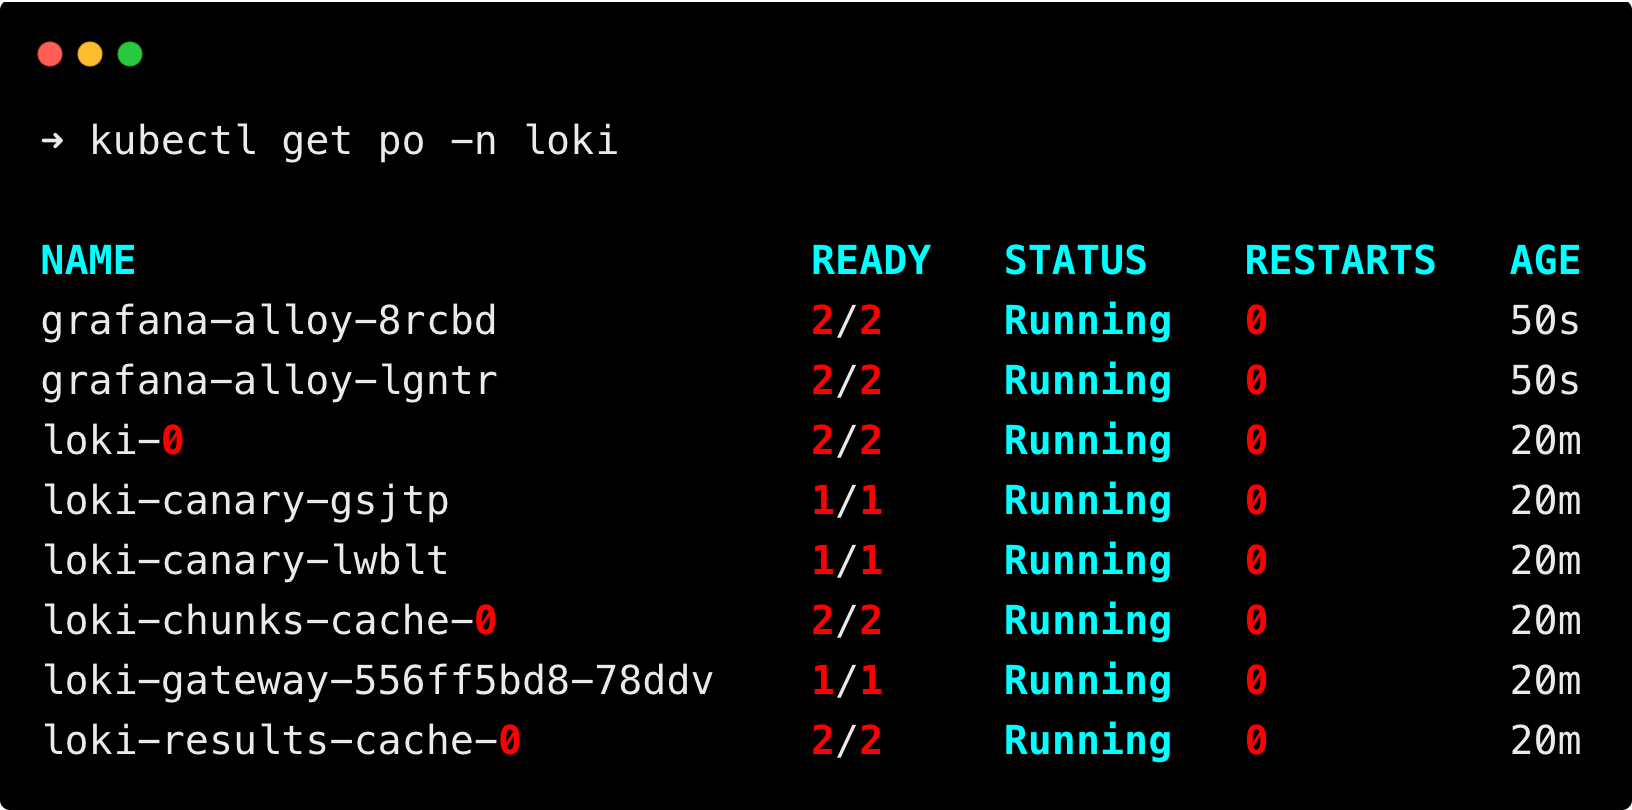
You can see the Alloy pods are deployed as Daemonset.
Step 6: Customize Grafana Helm Values file
The next step is to deploy Grafana, which we will use to query Loki and visualize it.
Download the Grafana values file using the following command, if you need to make any changes.
You can also use our custom values file.
image:
  repository: grafana/grafana
  tag: latest
  pullPolicy: IfNotPresent

resources:
  requests:
    cpu: 100m
    memory: 128Mi
  limits:
    cpu: 500m
    memory: 512Mi

datasources:
  datasources.yaml:
    apiVersion: 1
    datasources:
    - name: Loki
      type: loki
      url: http://loki-gateway.loki.svc.cluster.local
      access: proxy
      isDefault: false
      editable: true

service:
  type: NodePort
  port: 80
You can see we have added Loki as a datasource for Grafana, so we don't have to configure it manually after logging in to Grafana.
Also set the Grafana service Nodeport to access the UI using the node IP and nodeport.
Exposing service as NodePort is not recommended for production environment, user Load Balancers or Ingress to expose the application.
Following are the images used in this Helm chart.
- grafana/grafana
- bats/bats
- curlimages/curl
- library/busybox
- kiwigrid/k8s-sidecar
Step 7: Install Grafana
Once the values file is set, deploy Grafana with the values file using the following command.
helm install grafana grafana/grafana -n grafana --create-namespace -f g.yamlThis command will create a namespace grafana if not present and deploy the Grafana pod in it.
Run the following command to check if the Grafana pod is deployed.
kubectl get po -n grafanaYou will get the following output.
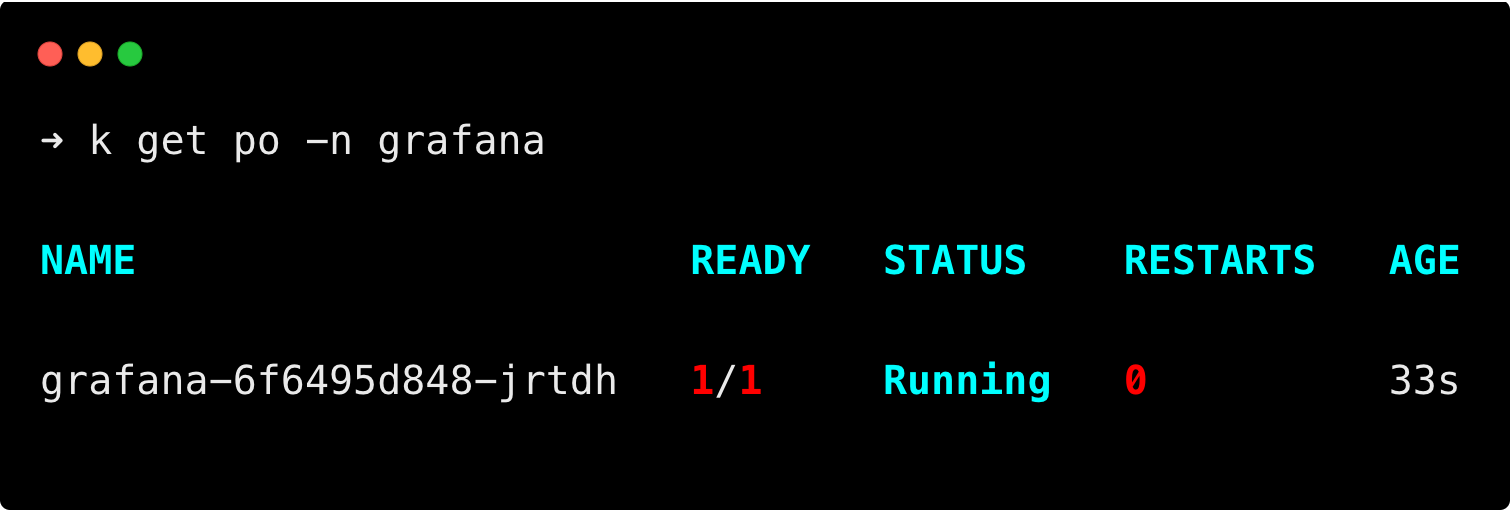
Since we have exposed the Grafana service as NodePort, we can access the Grafana dashboard using the node IP and node port assigned to your service.
Step 8: Log in to Grafana UI
Access your Grafana on the browser using the node IP and node port, you will get the following window.
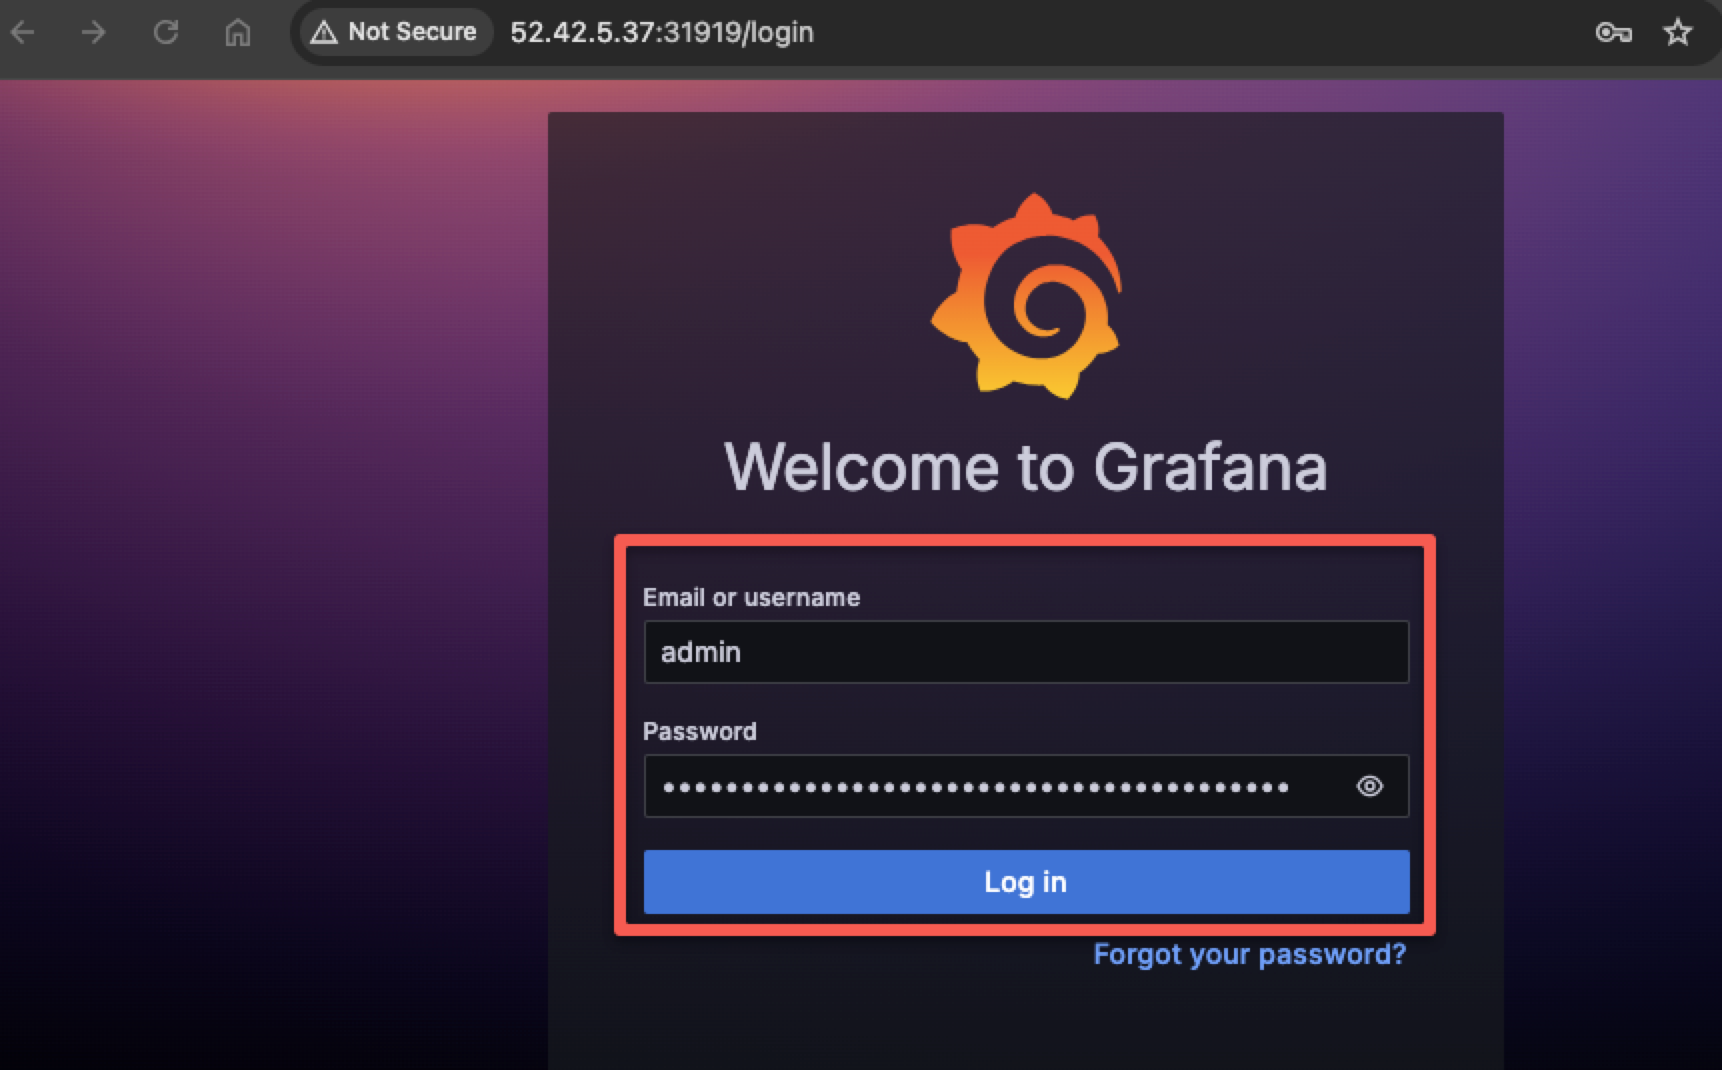
Login to Grafana using the username and password. Your default username will be admin and to get the password run the following command
kubectl get secret --namespace grafana grafana -o jsonpath="{.data.admin-password}" | base64 --decode ; echoThis command will show your password for Grafana. Use the password to log in to Grafana.
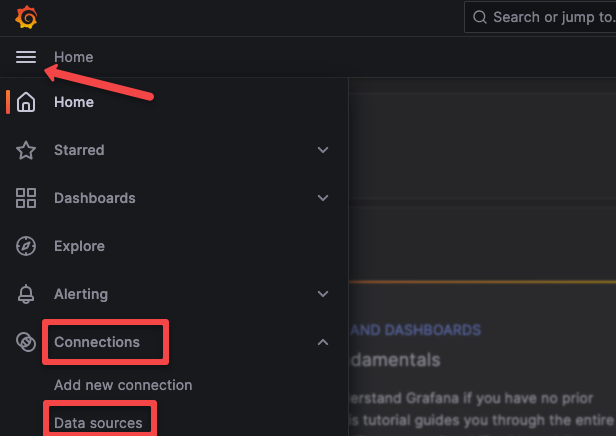
Once you log in, you can see the home screen of Grafana, press the three lines at the top left corner, you can see the menu, then go to Connections > Data sources as shown in the below image.
In the Data sources you can see Loki has been configured as default.
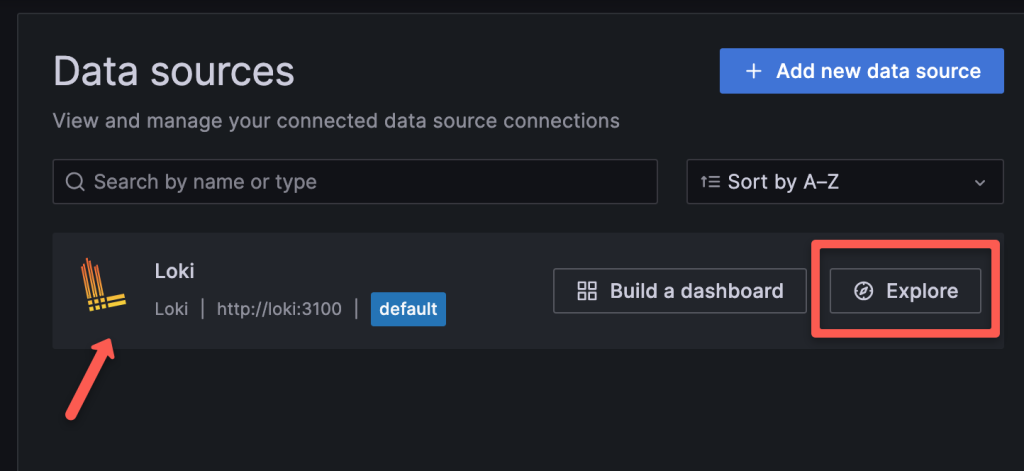
Now, check if you are getting logs.
Go to Explore by pressing the Explore button.
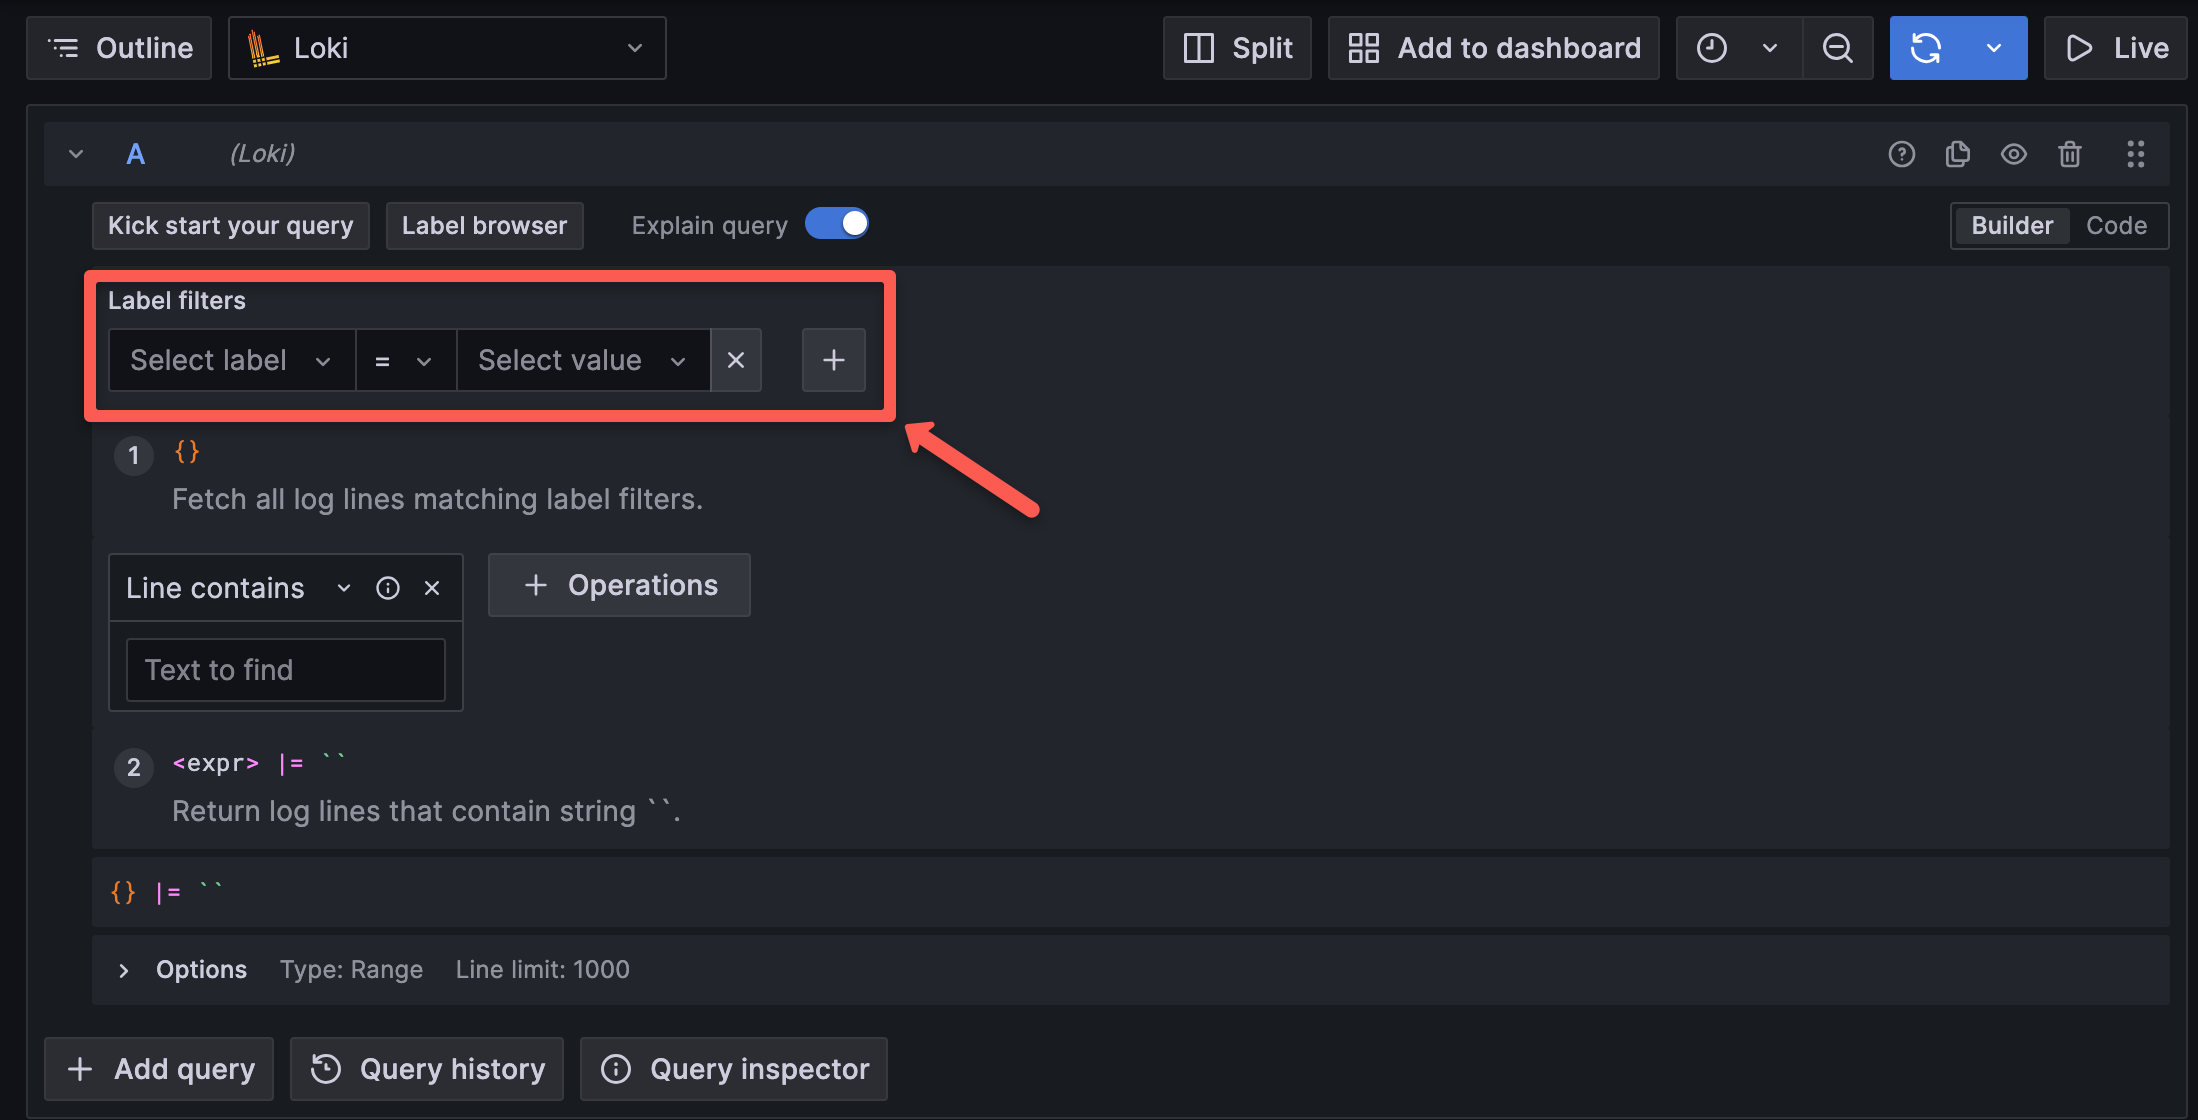
To query logs select a Label and Value, Loki will collect every log in your Kubernetes cluster and label it according to container, pod, namespace, and other objects of Kubernetes.
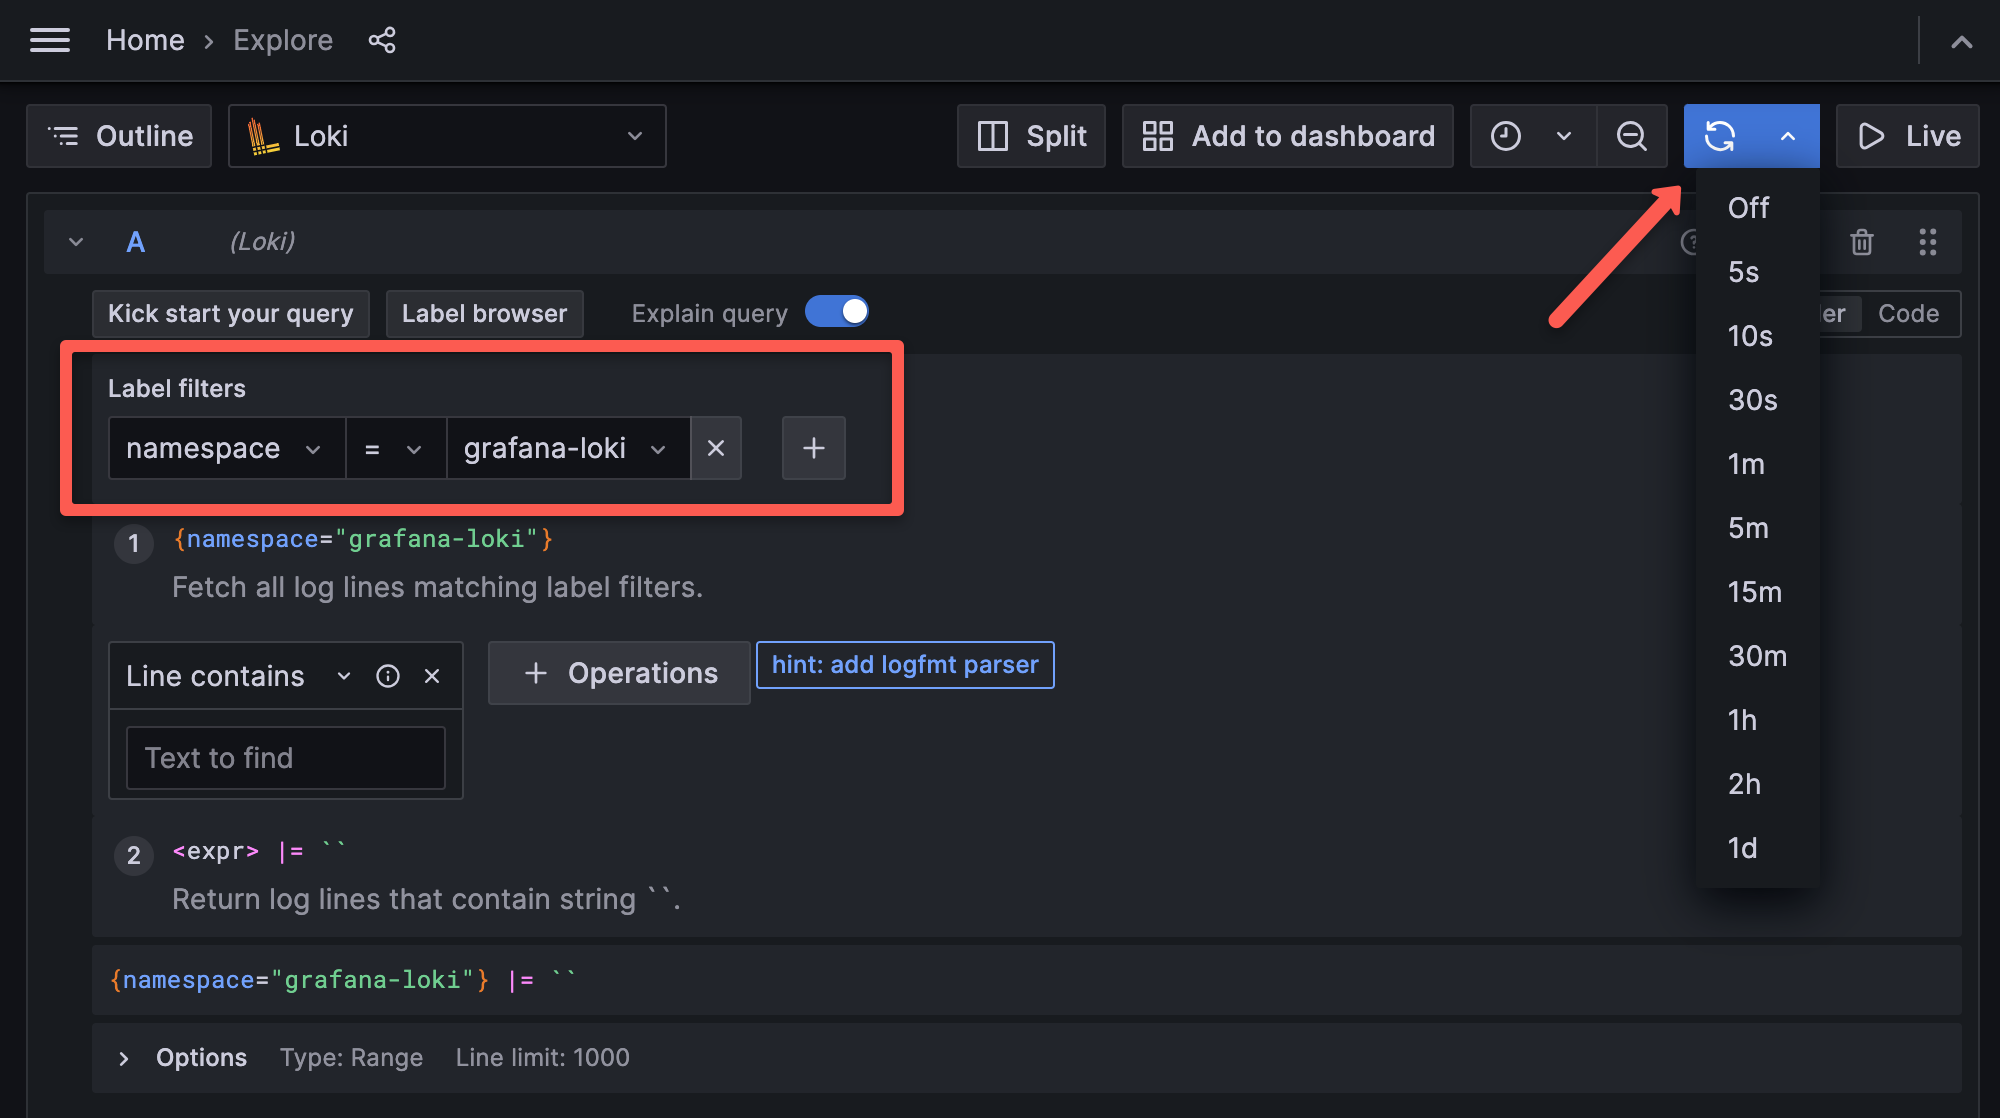
After selecting a Label and Value, press the Live button at the top right corner to query logs.
You can also set a time to query logs. For example, if you set the time to 5s it queries logs every 5s.
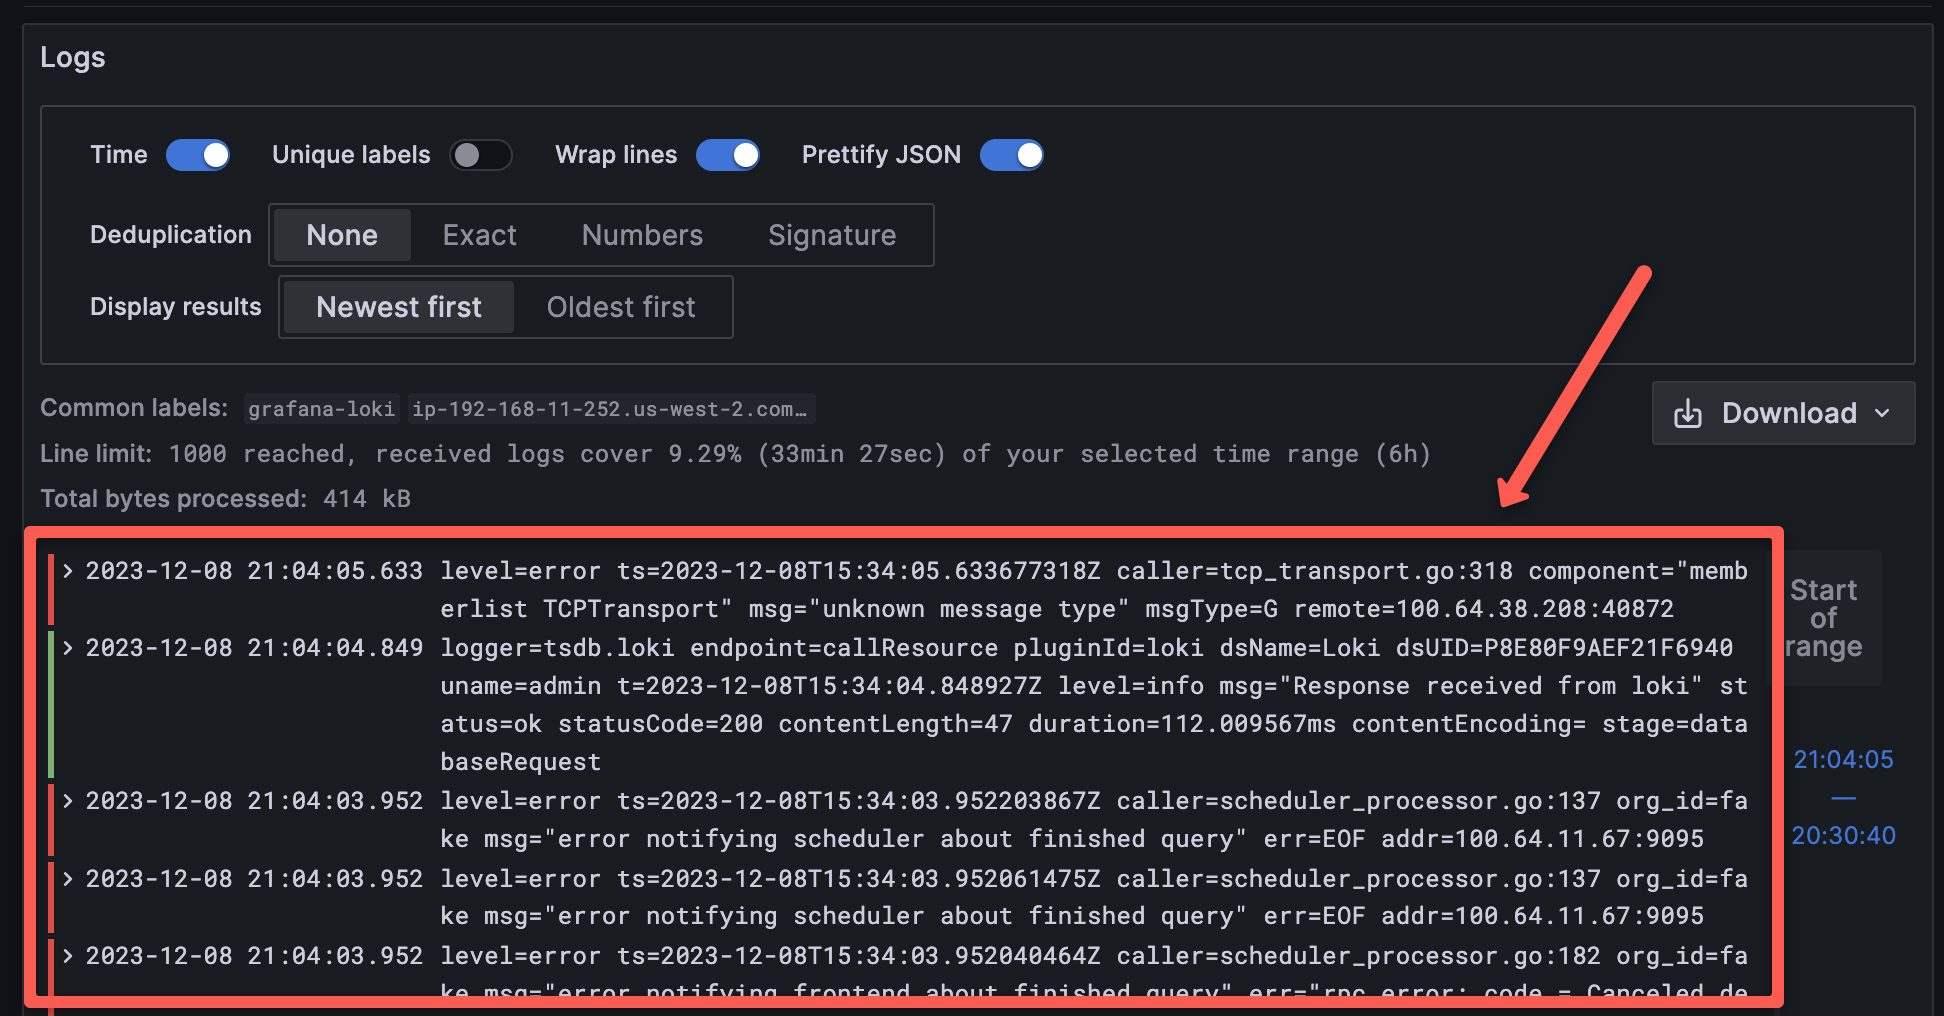
After pressing the Live button, scroll down to view the logs from the Label and Value you select.
Conclusion
I believe this helped you to set up the Loki on Kubernetes using Helm. We also learned how to query logs using Loki from the Grafana dashboard.
You can use our Configure S3 for Loki blog to add S3 as log storage for Loki.
If you want more detailed information about Grafana setup, you can use our guide on setting up Grafana on Kubernetes.
