

In this guide, we will look at Grafana Loki architecture and its components in detail.
By the end of this guide, you will understand:
- What is Loki
- Loki's key components such as distributors, ingesters, queriers etc.
- How logs move through the system, from collection to storage and querying
What is Grafana Loki?
Grafana Loki is an open-source log-gathering system, its function is to collect, store, and query logs.
Grafana Loki compresses the log and stores logs in chunks and stores them in filesystems or backend storage like AWS S3.
A chunk is a compressed file that contains log entries based on log volumes, so when a chunk size reaches its size limit it stores log in another chunk.
Whenever a chunk is stored it creates an index for each chunk. The index does not contain the content of the log, it only contains timestamps, labels of the chunk, and the location of the chunk.
The default retention period of logs is 24 hours, the minimum period is 1 hour and can be extended up to a maximum period of 30 days. Loki scales horizontally and has its query language LogQL.
Grafana Loki Architecture
The below diagram shows the architecture of Grafana Loki as well as its workflow of how it gathers logs.
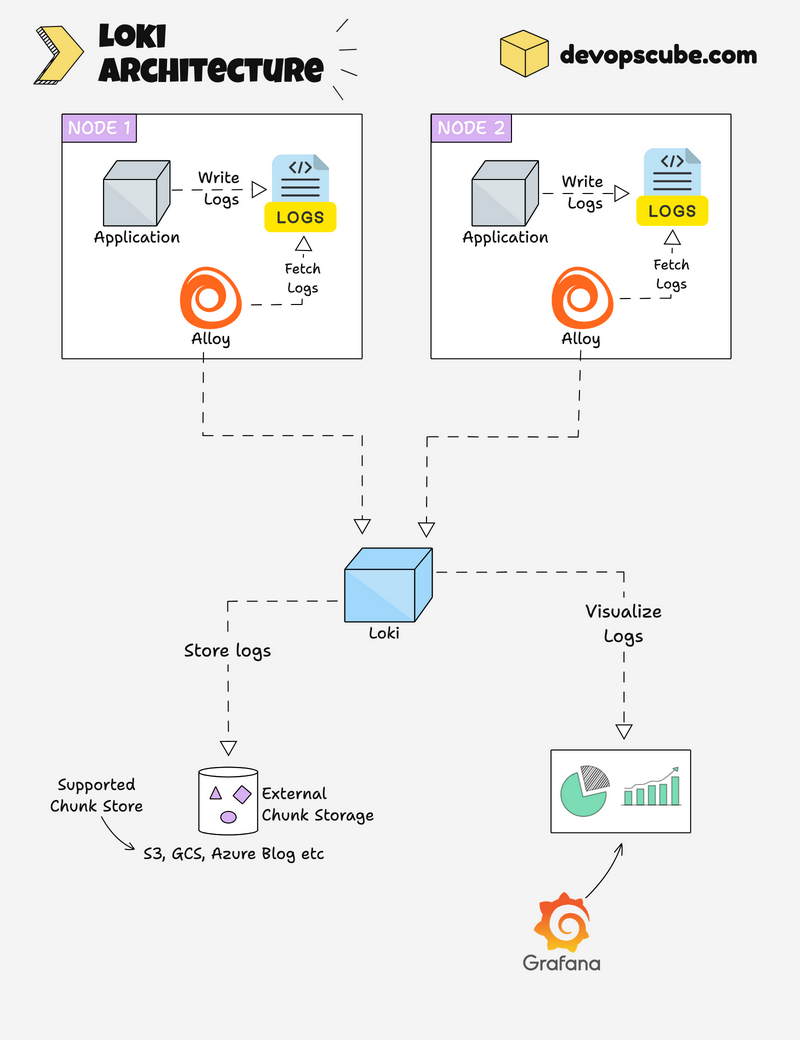
- Now, let's see how Grafana Loki Logging works. The diagram shows how Grafana Loki collects, stores, queries, and visualizes logs.
- In Grafana Loki, its agent is responsible for collecting logs from files, containers, pods, applications, and systems journals.
- Loki uses a log-collecting agent to collect logs. If you are using Loki in Kubernetes, the agent will be deployed as a daemonset because we need logs from every available node of the cluster.
- Grafana Alloy is the agent used in this architecture, Alloy collects every available log and send the logs to Loki.
- After receiving the logs from the collecting agent Alloy, Loki stores every log as a chunk which collects log messages in a single file to save storage space and effective retrieval.
- It also gives a label and timestamp to the chunk. Whenever a chunk is stored it creates an index for each chunk which contains a timestamp, label, and location of the chunk.
- Loki queries the logs using the LogQL query language, LogQL allows us to filter, aggregate, and analyze logs accounting to the label and values we choose.
- By adding Loki to Grafana you can visualize the queried logs or use LogCLI to query logs from your CLI.
Grafana Loki Components
Grafana Loki is made up of components such as alloy, distributor, ingester, querier, ruler, query frontend, and Grafana.
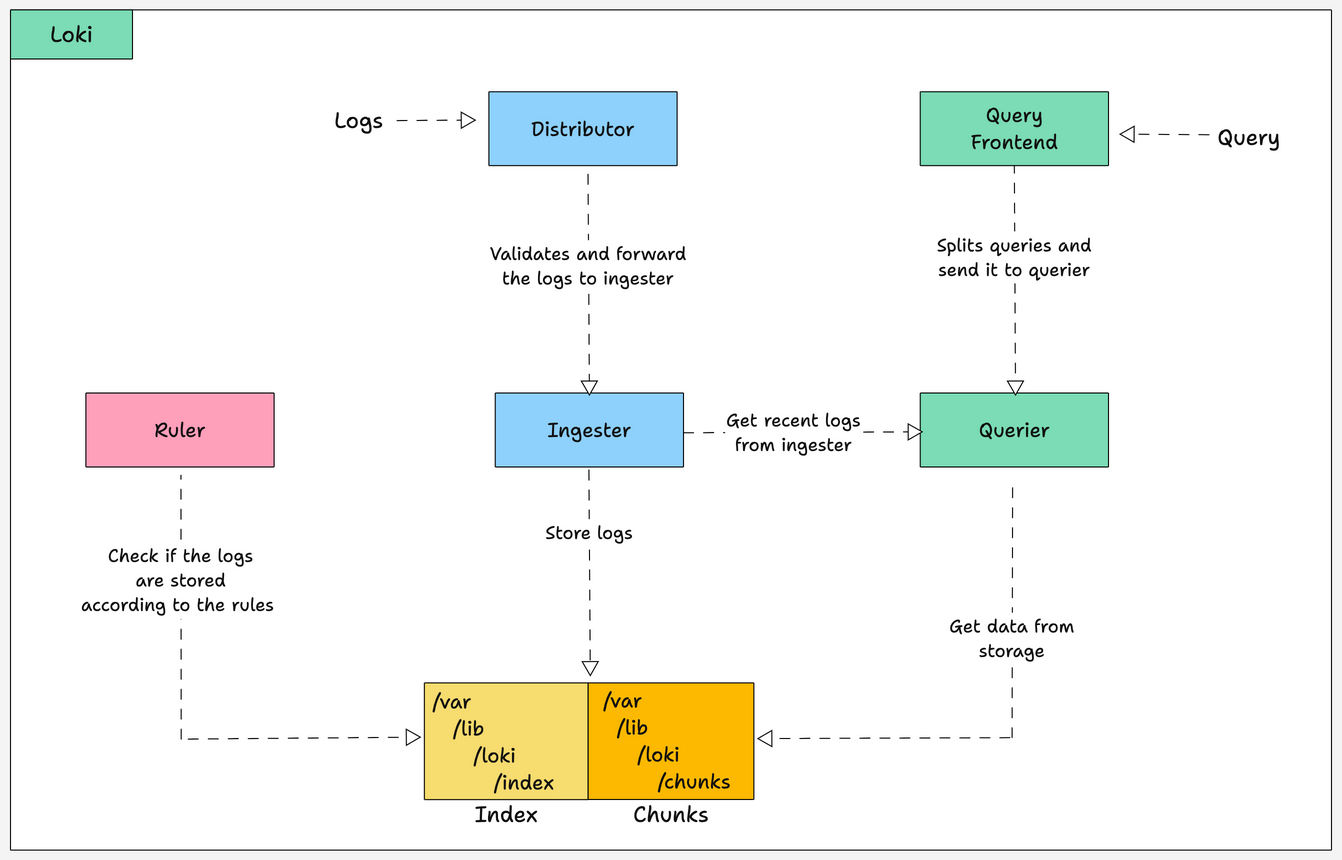
Given below is a high-level diagram of how components inside Loki interact.
Let's see about those components
Grafana Alloy:
Alloy is an important component that acts as a logging agent for Loki. Its function is to collect every log from the system, label it, and send it to Loki.
You have to install Alloy in every system you want to collect logs. Likewise, if you are using Loki on Kubernetes, you have to deploy Alloy in every node as a daemonset.
Distributor:
The Distributor is a stateless component that is responsible for handling and validating the logs received from log agents like Alloy and distributing the logs to the ingester.
When the distributor receives logs, first it validates the log if everything is according to the configuration like, valid labels, isn't older timestamps, and the log is not too long.
Once the validation is complete the distributor distributes the logs to every ingester based on the consistent hashing scheme to make sure to distribute to every available ingester equally.
Ingester:
The Ingester is responsible for storing and indexing the logs received from the distributor on its filesystem and transferring logs to persistent storage (long-term storage like S3) regularly.
Ingester sets a retention policy (automatic log deletion time) according to the configuration.
It uses a time-series database to store the log in a certain structural format, which eases the process of efficient querying and retrieving logs.
Ruler:
The ruler is a monitoring and alerting component of Loki. Its role is to check rules and trigger alerts based on the stored log data using LogQL queries.
It runs LogQL queries to check if the data is stored according to the rules, if not it triggers alerts.
Ruler can be integrated with Prometheus Alertmanager to send notifications if it detects any issues.
Querier:
As the name says Querier is responsible for querying logs from storage and ingesters using LogQL query language. It filters and aggregates logs according to user queries like timestamps, labels, etc.
Queriers caches the previous queries to prevent querying the same log again and again, it queries the log with the same timestamp, labels, and log message only once.
Query Frontend:
Query Frontend is a stateless component that interacts with the user, it is responsible for handling query requests, executing queries, and visualizing logs through the Grafana dashboard.
Query Frontend splits large queries into multiple smaller queries and runs all the queries at the same time, this prevents the large queries from causing memory issues in a single query and helps in faster execution.
Grafana:
Grafana is an open-source tool that helps in queries, visualize, and monitor logs. We can integrate Loki with Grafana and visualize the log data in the dashboard, graphs, or any other visualization format available in Grafana.
Grafana uses the query language LogQL to integrate with Grafana and also we can write LogQL queries in Grafana to filter and query logs.
Log Storage:
Loki stores log data to increase the efficiency of querying and receiving logs. It compresses log data into chunks organizes it according to time and gives a label and timestamp to it.
Then it creates an index in a key-pair format for each chunk with their log entries with the chunk timestamp and label.
For example, think index of a chunk like an index of a book.
Chunks and Index can be stored in various backend object storages or filesystems.
Once the chunks are stored it creates a retention period for the data and automatically deleted according to the retention period.
If you are using a filesystem as storage then the default storage paths for chunks and indexes are /var/lib/loki/chunks and /var/lib/loki/index.
Example of How Chunks and Indexes are Stored in Loki
As an example, imagine you are using a web server that generates a log containing a timestamp, HTTP request method, URL, and response code.
Each set of log entries would be compared into chunks like the below JSON format
{
  "timestamp": "2023-11-20T1:02:33.456Z",
  "labels": {
    "method": "GET",
    "url": "/products",
    "status": 200
  },
  "entry": "Request received for /products, responded with 200 OK"
}
The chunk file name will be in this format
2023-11-20T1-00-00.000Z-2023-11-20T1-15-00.000Z.chunkAs the name indicates the chunk contains logs from 20 November 2023, from time 1 AM to 1:15 AM.
Once the chuck is created an index is created for each chunk, the index would store the data about the chunk file and log entries in a key-value format as given below
{
  "2023-11-20T1:02:33.456Z": {
    "chunk": "2023-11-20T1-00-00.000Z-2023-11-20T1-15-00.000Z.chunk",
    "labels": {
      "method": "GET",
      "url": "/products",
      "status": 200
    }
  }
As shown in the above example index file it only stores chunk file name, timestamp, and label, it would not store the log message.
Features of Grafana Loki
The features offered by Grafana Loki are listed below.
Scalability:
Loki can scale according to the volume of logs. It scales horizontally by adding ingesters according to the log volumes, so you don't have to worry about heavy log traffic to slow down the process.
It distributes logs across multiple ingesters to prevent data loss during node failure because of heavy traffic and also it redirects logs to healthy ingester nodes to prevent downtime and data loss.
Efficiency:
Because Loki's compressing and storing log entries as chunks, it increases the storage space and decreases the time taken to retrieve logs even for large data.
With the help of indexes, Loki can easily locate queried logs based on timestamps and labels.
Multi-Tenancy:
Loki can collect and analyze logs from various sources like pods, containers, applications, etc at the same time, so we don't have to configure separate logging agents for different resources.
Even though it collects logs from various sources, it stores logs separately based on the sources like, separate storage files for containers and applications.
Log Rotation:
Loki assigned a retention policy to chunks when they are stored, it automatically deletes old logs according to the retention period, which helps to save storage space.
If you don't want to delete old logs you can also store logs in long-term object storage like AWS S3 and other object storage.
Difference Between Grafana Loki and EFK Stack
Now, let's see what makes Grafana Loki different from EFK Stack. The difference between Grafana Loki and EFK Stack are given below
Grafana Loki | EFK Stack |
|---|---|
| Loki itself collects logs, stores logs, and visualizes logs using Grafana | EFK Stack uses Elasticsearch for collecting and storing logs, Logstash for parsing and processing logs, and Kibana for visualizing logs |
| Loki compresses logs and stores them as chunks | EFK Stack stores each log entry in JSON files in Elasticsearch |
| Loki is known for its efficiency and scalability | EKS is known for its ability to adapt various environment |
| Scales horizontally | Scales vertically |
| Loki uses a distributed architecture | EFK Stack uses client-server architecture |
| Low usage of resources | High usage of resources |
| Uses Grafana to visualize logs | Uses Kibana to visualize logs |
Loki Deployment Modes
Loki can be deployed in various modes to suit different scalability and reliability requirements.
- Monolithic Mode: In this mode all components (ingester, ruler etc) run within a single process, suitable for small-scale deployments or testing environments.
- Microservices Mode: In this mode Each component runs as an independent service, offering maximum scalability and flexibility for large-scale deployments
Conclusion
In summary, Grafana Loki is a powerful and open-source tool for collecting, storing, querying, and visualizing logs.
It has features like scalability, log compression, multi-tenancy support, and automatic log rotation for effective monitoring and troubleshooting.
I believe this blog gives you a better understanding of Grafana Loki and its features.
If you want to get started with Loki, refer our detailed guide on setting up Loki on Kubernetes.
