

In this guide, we will look at the Prometheus setup on Kubernetes using a helm chart with all the best practices.
If you want to learn about all the Kubernetes objects involved in the Prometheus setup, you can follow the Prometheus on Kubernetes guide, where we used plain YAML manifest to deploy Prometheus.Prerequisites
For this setup, ensure you have the following prerequisites.
- Helm configured on your workstation or the CI server where you want to run the Helm commands. (v3.16.3 or higher)
- A working Kubernetes cluster (v1.30 or higher)
Prometheus Helm Chart Repo
The Prometheus community maintains all the Prometheus related Helm charts in the following GitHub repository.
https://github.com/prometheus-community/helm-charts/This repo contains Prometheus stack, exporters, Pushgateways, etc. You can install the required charts as per your requirements.
To get started, we will deploy the core Prometheus chart that installs the following.
Except for the Prometheus server, other components are installed from the dependency charts (sub-charts). If you check the Chart.yaml, you will find the added chart dependencies below.
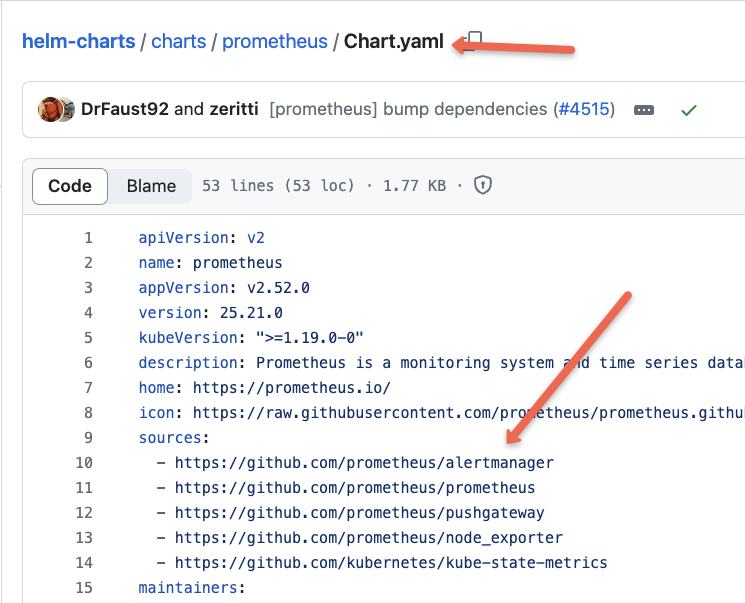
You can refer to this Prometheus Architecture blog to learn the complete workflow of Prometheus and its components.
Install Prometheus Stack Using Helm
Now, let's get started with the setup.
Follow the steps below to set up Prometheus using the community Helm chart.
Step 1: Add Prometheus Helm Repo
Add the Prometheus chart to your system using the following command.
helm repo add prometheus-community https://prometheus-community.github.io/helm-chartsYou can list all the charts in the repo using the following command. We are going to use the Prometheus chart.
helm search repo prometheus-communityBefore you deploy the Prometheus Helm chart, you can view all the YAML manifests by converting the chart to plain YAML files using the following command.
helm template prometheus-community prometheus-community/prometheus --output-dir prometheus-manifestsHere is the tree view of all the associated charts with YAML and Prometheus YAML.
➜  prometheus-manifests tree
.
└── prometheus
    ├── charts
    │   ├── alertmanager
    │   │   └── templates
    │   │       ├── configmap.yaml
    │   │       ├── serviceaccount.yaml
    │   │       ├── services.yaml
    │   │       └── statefulset.yaml
    │   ├── kube-state-metrics
    │   │   └── templates
    │   │       ├── clusterrolebinding.yaml
    │   │       ├── deployment.yaml
    │   │       ├── role.yaml
    │   │       ├── service.yaml
    │   │       └── serviceaccount.yaml
    │   ├── prometheus-node-exporter
    │   │   └── templates
    │   │       ├── daemonset.yaml
    │   │       ├── service.yaml
    │   │       └── serviceaccount.yaml
    │   └── prometheus-pushgateway
    │       └── templates
    │           ├── deployment.yaml
    │           ├── service.yaml
    │           └── serviceaccount.yaml
    └── templates
        ├── clusterrole.yaml
        ├── clusterrolebinding.yaml
        ├── cm.yaml
        ├── deploy.yaml
        ├── pvc.yaml
        ├── service.yaml
        └── serviceaccount.yaml
From the manifests, you can see that the Prometheus Helm chart deploys the following.
- Alertmanager (Statefulset)
- Kube State Metrics (Deployment)
- Prometheus Node Exporter (Daemonset)
- Prometheus Pushgateway (Deployment)
- Prometheus Server (Deployment)
Step 2: Customize Prometheus Helm Chart Configuration Values
While deploying Prometheus, it is very important to know the default values that are part of the values.yaml file.
If you are using the community chart for your project requirements, you should modify the values.yaml file as per your environment requirements.
You can write all the default values to a values.yaml file using the following command.
helm show values prometheus-community/prometheus > values.yamlThe following are the images used in this Prometheus Helm chart.
- quay.io/prometheus-operator/prometheus-config-reloader
- quay.io/prometheus/prometheus
The subcharts use the following images.
- quay.io/prometheus/alertmanager
- registry.k8s.io/kube-state-metrics/kube-state-metrics
- quay.io/prometheus/node-exporter
- quay.io/prometheus/pushgateway
You can customize the values to your needs. For example, the Prometheus Persistent Volume is set to 8Gi by default.
Note: If you are running from a corporate network, you might not have access to these public images. You should first push these images to the organization private registry first and then deploy the chart. Also, check if the security guidelines allow you to push community image to private registries.Step 3: Deploy Prometheus using the Helm Chart
First, create a namespace monitoring. We will deploy Prometheus in the monitoring namespace.
kubectl create namespace monitoringNow, let's deploy Prometheus using the values.yaml file.
Here, I am adding two parameters to create a Persistent Volume for Prometheus and AlertManager.
We can do the same configurations in the values.yaml as well.
I am using the EKS cluster for a demo, so the mentioned storage class gp2 is the default of the EKS cluster.
helm upgrade -i prometheus prometheus-community/prometheus \
    --namespace monitoring \
    --set alertmanager.persistence.storageClass="gp2" \
    --set server.persistentVolume.storageClass="gp2"
You will get the status as deployed on a successful deployment, as shown below.
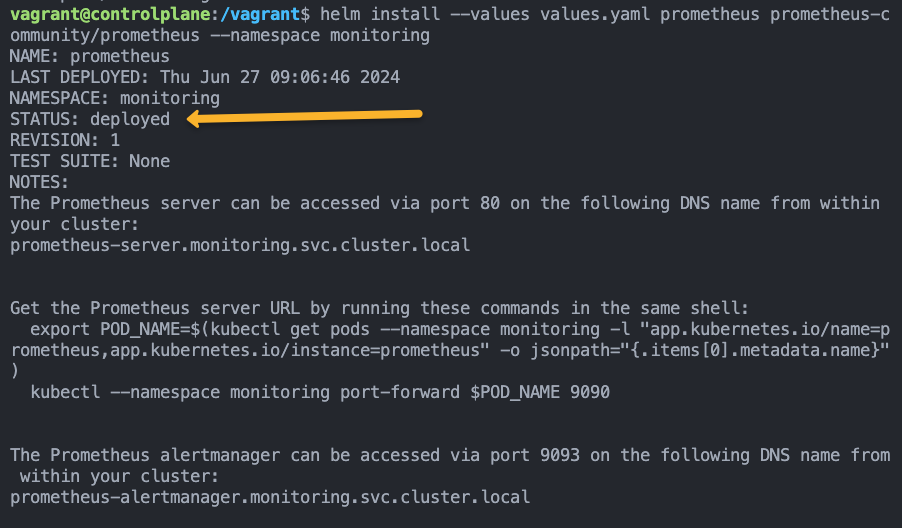
Before we access the Prometheus, we can check that all the components are deployed and running properly.
kubectl -n monitoring get all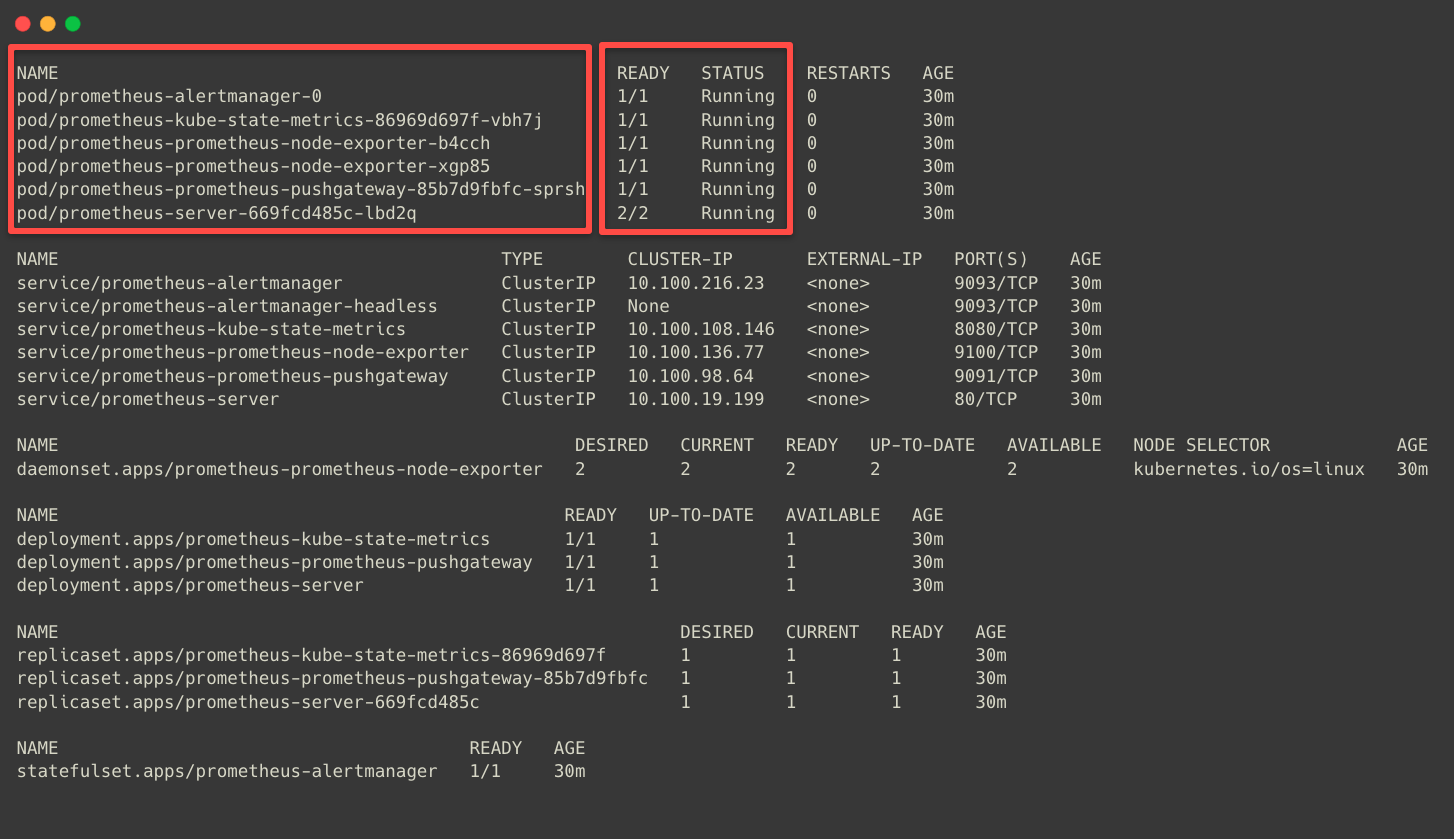
Step 4: Port Forward the Prometheus Pod
The above screenshot clearly shows that each Prometheus stack component has the Service type as Cluster IP, so it can only be accessed from inside the cluster.
But we need to access it from our local machine to see the dashboard, so we perform the port forwarding.
First, start with the Prometheus port forwarding, identify the Prometheus Pod name, and create that as an environment variable.
export POD_NAME=$(kubectl get pods --namespace monitoring -l "app.kubernetes.io/name=prometheus,app.kubernetes.io/instance=prometheus" -o jsonpath="{.items[0].metadata.name}")To perform port forwarding, use the following command.
kubectl --namespace monitoring port-forward $POD_NAME 9090The port forwarding is properly done; you will see the following output.
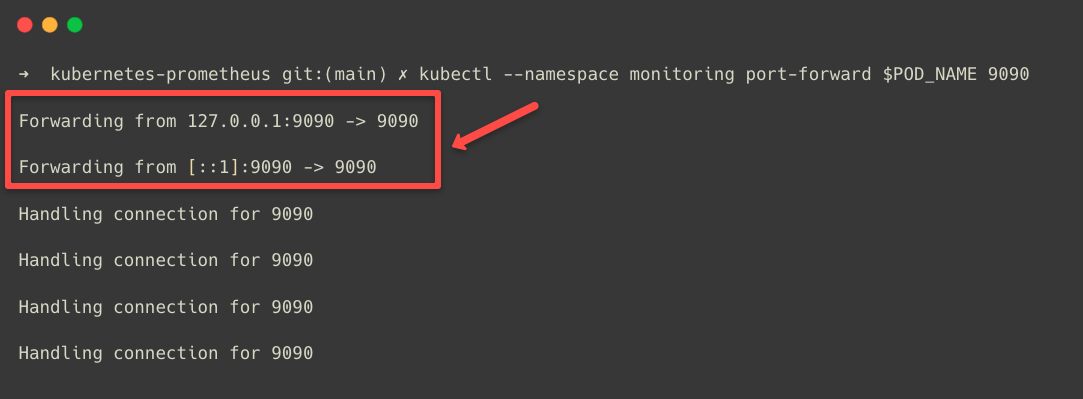
Don't close the terminal; meanwhile, open any of the web browsers from the same machine and paste this URL localhost:9090
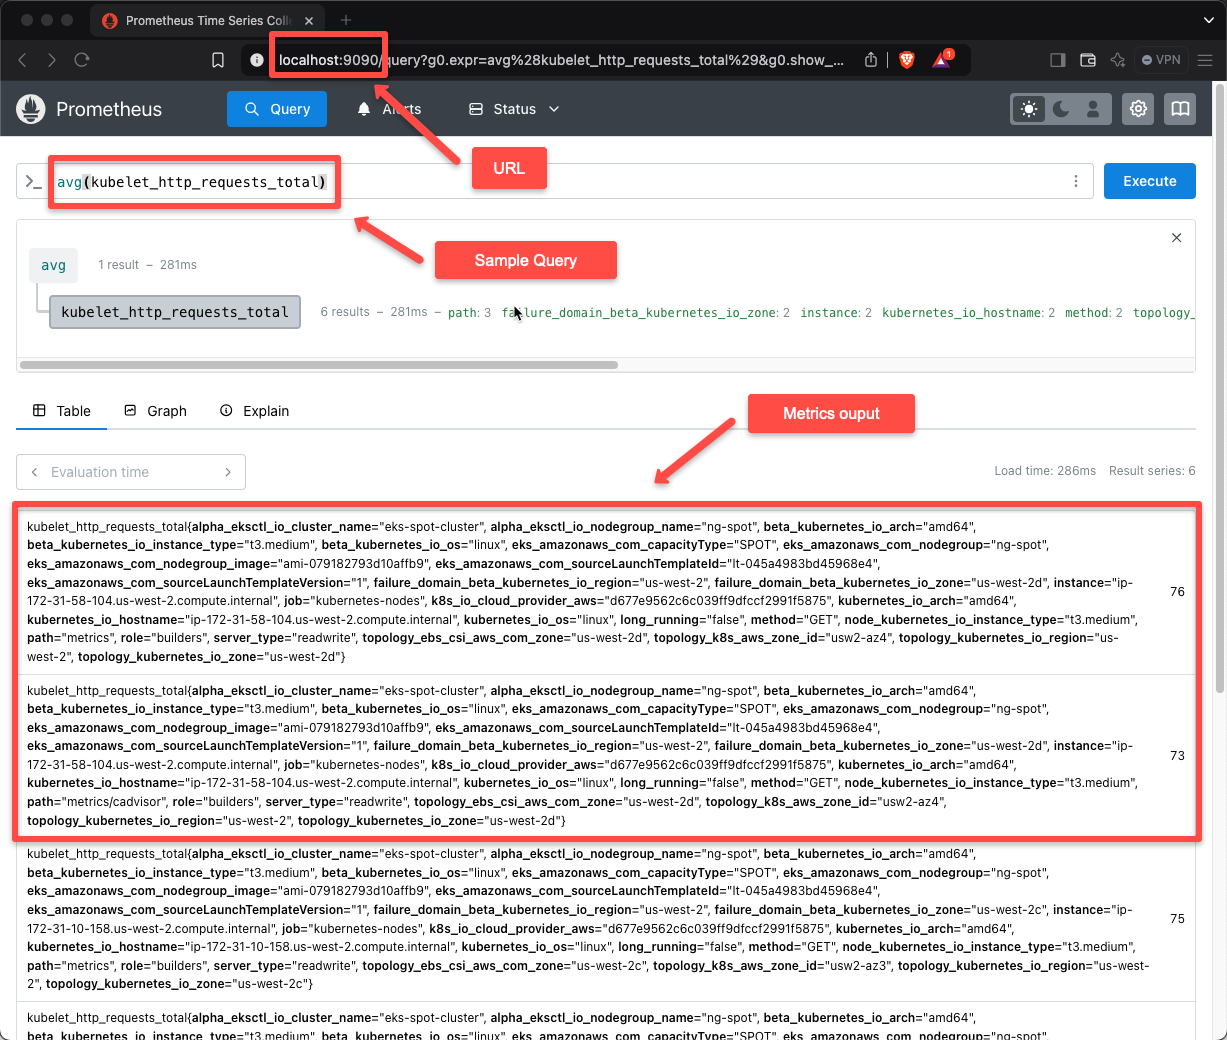
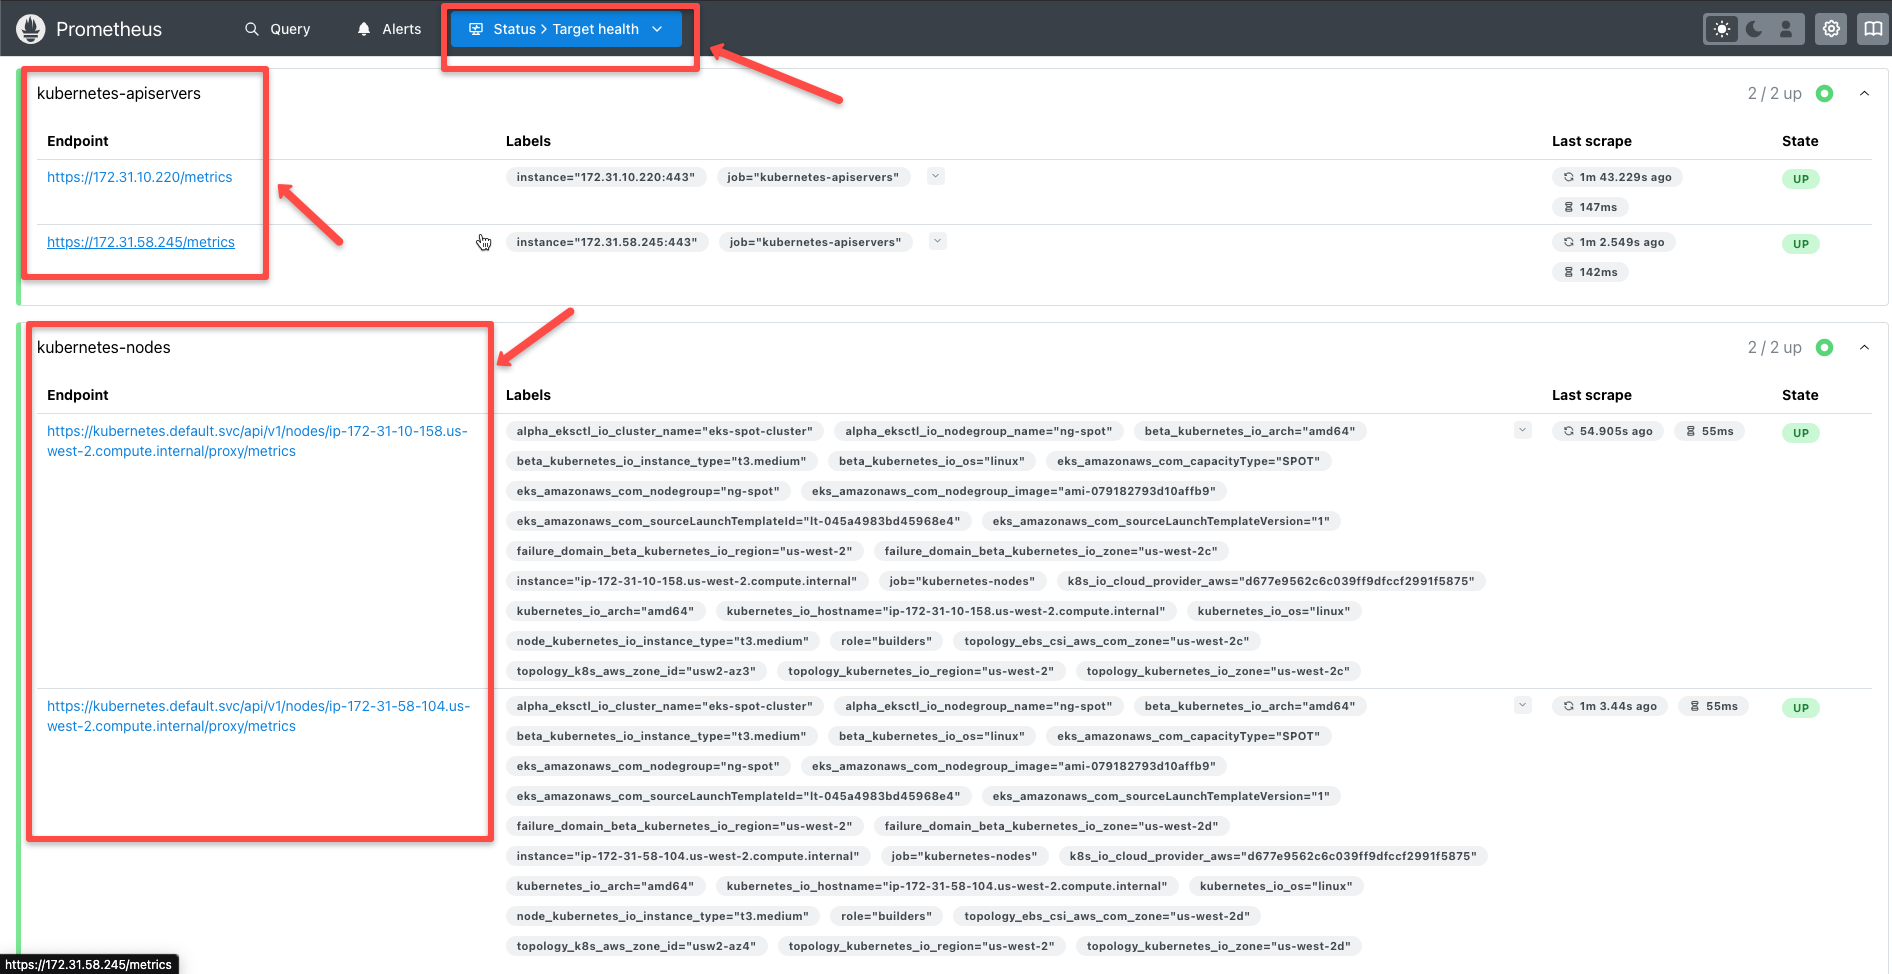
In the Target section, we can see the cluster resources that Prometheus is monitoring by default.
Now, we can try the Alertmanager port forwarding to see the dashboard.
export POD_NAME=$(kubectl get pods --namespace monitoring -l "app.kubernetes.io/name=alertmanager,app.kubernetes.io/instance=prometheus" -o jsonpath="{.items[0].metadata.name}")To perform a Port forward to the Alertmanager Pod, use the following command.
kubectl --namespace monitoring port-forward $POD_NAME 9093Same as Prometheus, use localhost URL from the browser, but this time use the Port 9093.
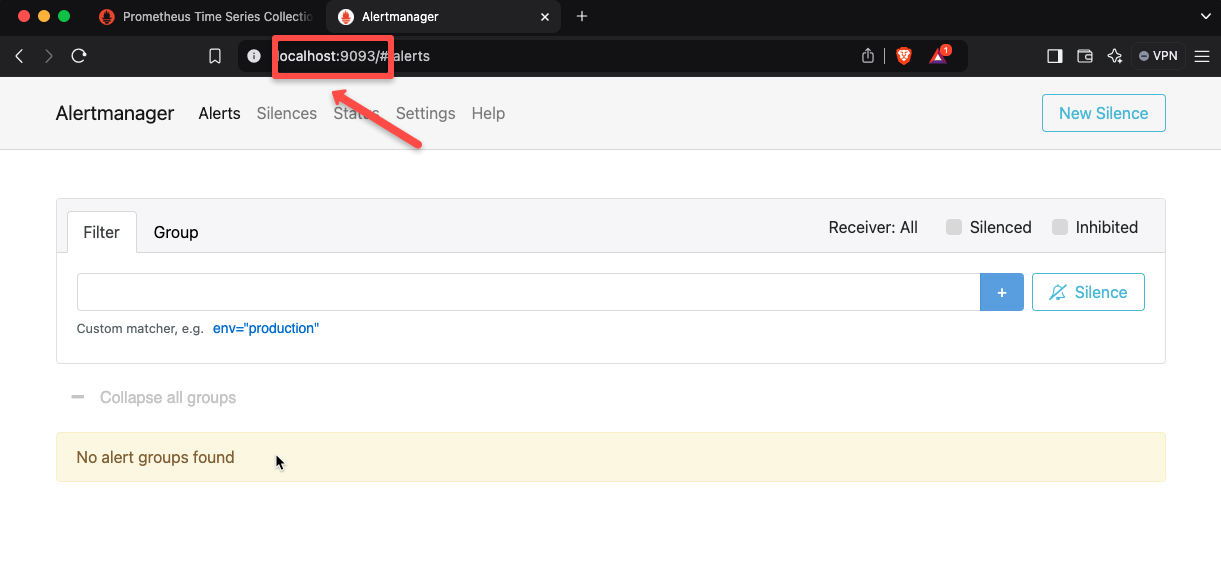
The Alertmanger is also working correctly, so the installation was successful.
Here, we have explored the port forwarding method to expose the Prometheus application.
Note: If you want a static endpoint to access the Prometheus via internal or external DNS, you can either use the type Node Port or Load Balancer service. Also you can use ingress to expose it via DNS. For TLS, use ingress TLS configurations.Prometheus Advanced Configuration
Given below are the advanced configurations and best practices you can change based on your requirements.
You can find the options below in the Helm values file itself.
Storage
By default, an 8 GB persistent volume will be attached to the Prometheus pod. If you want Prometheus to collect metrics from more workloads, increase the storage size.
server:
  persistentVolume:
     size: 20Gi
Retention by Time or Size
By default, the retention period for metrics will be 15 days, after 15 days, the metric will be deleted.
You can modify the retention by date or time.
You can modify the retention on the Helm chart, as shown below.
server:
  retention: 30d
    # OR
  retentionSize: 160Gi
This configuration deletes the metrics after 30 days, or if you choose size-based retention, it will be deleted once it reaches 160 GB.
Resource Limit and Request
By default, there will be no resource limit and request, but setting up resource limits and requests is important so that the pod can let the cluster know its resource requirements.
Below is an example of a resource request and limit.
server:
  resources:
    requests:
      cpu: "500m"
      memory: "512Mi"
    limits:
      cpu: "500m"
      memory: "512Mi"
If your Prometheus is collecting metrics from more workloads, increase the limits accordingly, or the pod will be restarted or OOMKILL because of insufficient resources.
Basic High Availability
For high availability, you can do the following:
- Specify to deploy as a statefulset
- Increase replicas to 2
- Change the update strategy to rolling update, which prevents the pods from terminating until a new pod is created.
- Set the pod anti-affinity to hard, which prevents replicas from being created in the same node.
server:
  replicaCount: 2
  strategy:
    type: RollingUpdate

  podAntiAffinity: hard

  statefulSet:
enabled: trueHow to Calculate Prometheus Resource Requirements for Real Projects?
We can calculate the estimated requirements of Prometheus stacks based on the project requirements.
Let us take a real project scenario.
Assume we are setting this up for a project in Kubernetes.
Understand your Project Environment
The following is the list of requirements for the project
- The cluster has 30 worker nodes
- Almost 400 pods are running in it
- We would need a standard Prometheus exporter such as
- Node Exporter
- Kubelet/cAdvisor
- kube-state-metrics
- kube-apiserver
- ETCD
- Scrape interval: 15 seconds
- Data retention: 15 days
Now, we need to know the volume of data that we are expecting.
Estimation of the Active Time Series
Prometheus stores the metrics as time series data
The following is the rough estimation of the data.
| Source | Series per Node | Total for 30 Nodes |
|---|---|---|
| node-exporter | 1,000 | 30,000 |
| kubelet + cAdvisor | 2,500 | 75,000 |
| kube-state-metrics (cluster-wide) | – | 30,000 |
| kube-apiserver (cluster-wide) | – | 5,000 |
| etcd (cluster-wide) | – | 3,000 |
Total = 30,000 + 75,000 + 30,000 + 5,000 + 3,000 = 143,000 series
Convert to Samples Per Second (SPS)
Each time series has multiple data points that are based on the scrape interval.
Prometheus scrapes data at intervals, so we calculate samples per second:
SPS = active_series ÷ scrape_interval
SPS = 172,000 ÷ 15 = ≈ 11,467 samples/second
Estimate Disk Storage
Assuming each sample takes around 1.5 bytes after compression.
So, daily data per replica is 11,467 × 86,400 × 1.5 ≈ 1.49 GB/day.
For 15 days, 2 replicas, and 20% overhead:
1.49 × 15 × 2 × 1.2 = ~54 GB total
We are rounding this up to 60 to 80 GB disk per Prometheus instance.
Now, we need to calculate the memory for Prometheus.
Estimate Memory
Prometheus keeps recent data in memory (head block) that usually requires ~2–3 KB per active series.
172,000 × 2.5 KB ≈ 430 MB for active data.
We also need to consider memory for queries, UI, and buffers:
So each Prometheus Pod should have a resource Request of 2 GB, a Limit of 4 GB
Estimate CPU
Prometheus is not a very CPU-heavy application, but queries and rule evaluations require CPU.
- Request: 2 vCPU
- Limit: 4 vCPU
Recommended Prometheus Flags
For the production setup, the following flags are essential.
--storage.tsdb.retention.time=15d- To define how long we want to keep the metrics--storage.tsdb.retention.size=70GB- How many metrics should be stored on the disk? Once the threshold is reached, old data will be deleted.--query.max-concurrency=40- Controls how many queries can run at a time.--web.enable-admin-api=false- This disables the Prometheus admin API as part of security.--enable-feature=exemplar-storage- To link the traces with the metrics.
Validate Resource Usage After Deployment
Once Prometheus is up and running, monitor the following metrics to know what resources need to be adjusted.
| Metric | Purpose |
|---|---|
prometheus_tsdb_head_series | Shows total active series |
rate(prometheus_tsdb_head_samples_appended_total[5m]) | Shows ingestion rate |
prometheus_tsdb_storage_blocks_bytes | Shows disk usage |
prometheus_rule_group_last_duration_seconds | Shows rule evaluation time |
up | Confirms targets are healthy |
Scaling Guidelines
For smaller setups like 10 nodes and ~150 Pods, we can use the following estimation.
- 40–60k series
- ~0.5 GB/day storage
- 20–30 GB disk
- 1–2 vCPU
- 1–2 GB RAM
For larger setups like 50-80 nodes, ~1,500–2,000 pods, we can consider the following:
- Scaling the resources, such as CPU/RAM/disk, to run the Prometheus stack without any issues.
- And if planning to store the metrics for the long-term, consider Thanos, Cortex, or Mimir with Prometheus.
When to Use Thanos, Cortex, or Mimir
If your requirements are any of the following, you can use Thanos or Cortex with Prometheus.
- You are expecting over 1–2 million time series or
- You want to store the metrics longer than 30–60 days or
- Multiple clusters that need a single view
Then switch to Prometheus + Thanos/Cortex/Mimir.
You will get scalable, long-term, and highly available metrics.
Final Recommendation
For a small to medium production cluster, use the following resources for Prometheus.
| Resource | Recommendation (per replica) |
|---|---|
| CPU | 2–4 vCPU |
| Memory | 2–4 GB |
| Disk | 60–80 GB (SSD) |
| Retention | 15 days |
| Scrape Interval | 15 seconds |
Conclusion
This guide provides a basic installation of the Prometheus stack using Helm. You will need to configure it to monitor your applications or endpoints.
Also, we have seen additional configurations and resource calculation of Prometheus.
For advanced configuration or production level setup, you can make use of Prometheus Operator, where every configuration is available as a Kubernetes CRD.
