

In this blog, we will look at the setup and configuration of the Prometheus JMX Exporter on a Kubernetes using a Java application.
To better understand the JMX exporter, we will use a Spring Boot Java application and export all the JMX metrics to the Prometheus server.
By the end of this guide, you will learn to:
- Setup JMX Exporter with Java application image
- Export JMX metrics to the Prometheus server
- Scrape JMX metrics of the app using Prometheus SD configs.
- Validate and query JMX metrics from the Prometheus dashboard.
Let’s dive right in.
Prerequisites
For setting up and testing this setup, you should have the following.
- Kubernetes cluster with deployment permissions.
- Prometheus Server running on Kubernetes.
JMX Exporter
First, let's understand how the JMX exporter works.
The following image shows the JMX Exporter workflow when deploying it on Kubernetes.
The MBean (Managed Bean) server, located within the Java Virtual Machine (JVM) of a Java application, acts as a repository for data related to the application's health and performance.
The MBean component exposes the application metrics such as status, actions, and operation information.
Java agents can access the Mbean server and get the health and performance data. Prometheus JMX Exporter is also a Java agent, which is capable of accessing the MBean server to access the data and transform that data into the Prometheus metric format.
Prometheus then scrapes the metrics from the JMX Exporter's default metric storage path, which is /metrics.
JMX Exporter Setup on Kubernetes
Follow the steps given below to setup JMX exporter with java applications on Kubernetes.
Step 1: Build Application Docker Image With JMX Agent
JMX Exporter Java agent should be run with the application on the runtime.
You can download the JMX exporter agent jar file from here -> JMX Exporter Download.
So when you build the Docker image for you application, you should add the JMX exporter along with the image.
Here is an example of a Dockerfile that has both Java application jar and jmx-agent jar file.
FROM techiescamp/jre-17:1.0.0

ENV APP_NAME=jmx-java-app
ENV JMX_PORT=5556

WORKDIR /app

COPY /java-agent/*.jar /app/jmx-agent.jar
COPY /java-app/*.jar /app/java.jar
COPY config.yaml /app/

CMD java -javaagent:jmx-agent.jar=${JMX_PORT}:config.yaml -jar java.jar
I have already built the docker image and pushed it to Dockerhub. If you are learning ot testing JMX, you can use the following image directly.
techiescamp/jmx-pet-clinic-app:latestStep 2: Create ConfigMap for the JMX Exporter
We need to create a ConfigMap named jmx-exporter-configmap.yaml object for the JMX configs. In this file, we will provide information to filter the required metrics from the MBean server.
This config avoids unnecessary metric collection limiting it to only the metrics we need.
Create jmx-exporter-configmap.yaml
apiVersion: v1
kind: ConfigMap
metadata:
  name: jmx-exporter-config
  namespace: monitoring
data:
  config.yaml: |-
    lowercaseOutputName: true
    lowercaseOutputLabelNames: true
    whitelistObjectNames: ["java.lang:type=Memory", "java.lang:type=GarbageCollector,*"]
Here, you can see that I have mentioned that the namespace value is monitoring, this is because I have all my monitoring components in that particular namespace.
If you want to use this same configuration, create a namespace with the same name before beginning the configuration.
In the data section, we can define what kind of metrics the JMX Exporter has to collect from the MBean server. In this configuration I have given a small example to filter memory-related metrics of the application.
To know more about the configuration, please visit the official documentation.
To deploy this configuration in the Kubernetes, use the following command.
kubectl apply -f jmx-exporter-configmap.yamlTo view the list configmaps in the monitoring namespace.
kubectl get configmaps -n monitoringStep 3: Create a Deployment Manifest for the Application
When creating the Deployment manifest, we have to expose the application and the metric ports, only then can we access the application and metrics over the Internet.
Create a deployment YAML file app-deployment.yaml.
apiVersion: apps/v1
kind: Deployment
metadata:
  name: jmx-java-app
  namespace: monitoring
spec:
  replicas: 2
  selector:
    matchLabels:
      app: jmx-java-app
  template:
    metadata:
      labels:
        app: jmx-java-app
    spec:
      containers:
        - name: jmx-java-app-container
          image: techiescamp/jmx-pet-clinic-app:latest
          ports:
            - containerPort: 8080
            - containerPort: 5556
          volumeMounts:
            - name: jmx-exporter-config-volume
              mountPath: /app/config.yaml
              subPath: config.yaml
      volumes:
        - name: jmx-exporter-config-volume
          configMap:
            name: jmx-exporter-config
Here, you can see I am exposing ports 8080 and 5556 outside the container.
One important thing here is the volumeMounts section. The mountPath is uses the configmap as volumes. It overwrites the container default /app/config.yaml
Now deploy the manifest.
kubectl apply -f app-deployment.yamlTo view the list of Deployments in the monitoring Namespace.
kubectl get deployments -n monitoringTo view the list of Pods in the monitoring Namespace.
kubectl get pods -n monitoring -o wideFor testing purposes, I have given two replicas, so we can see two Java application Pods running in the monitoring Namespace.
Step 4: Create a Service for Application
Create a Service manifest for the application app-service.yaml
apiVersion: v1
kind: Service
metadata:
name: jmx-java-app-nodeport
namespace: monitoring
spec:
selector:
app: jmx-java-app
ports:
- name: http
protocol: TCP
port: 8080
targetPort: 8080
nodePort: 30750
- name: jmx
protocol: TCP
port: 5556
targetPort: 5556
nodePort: 30850
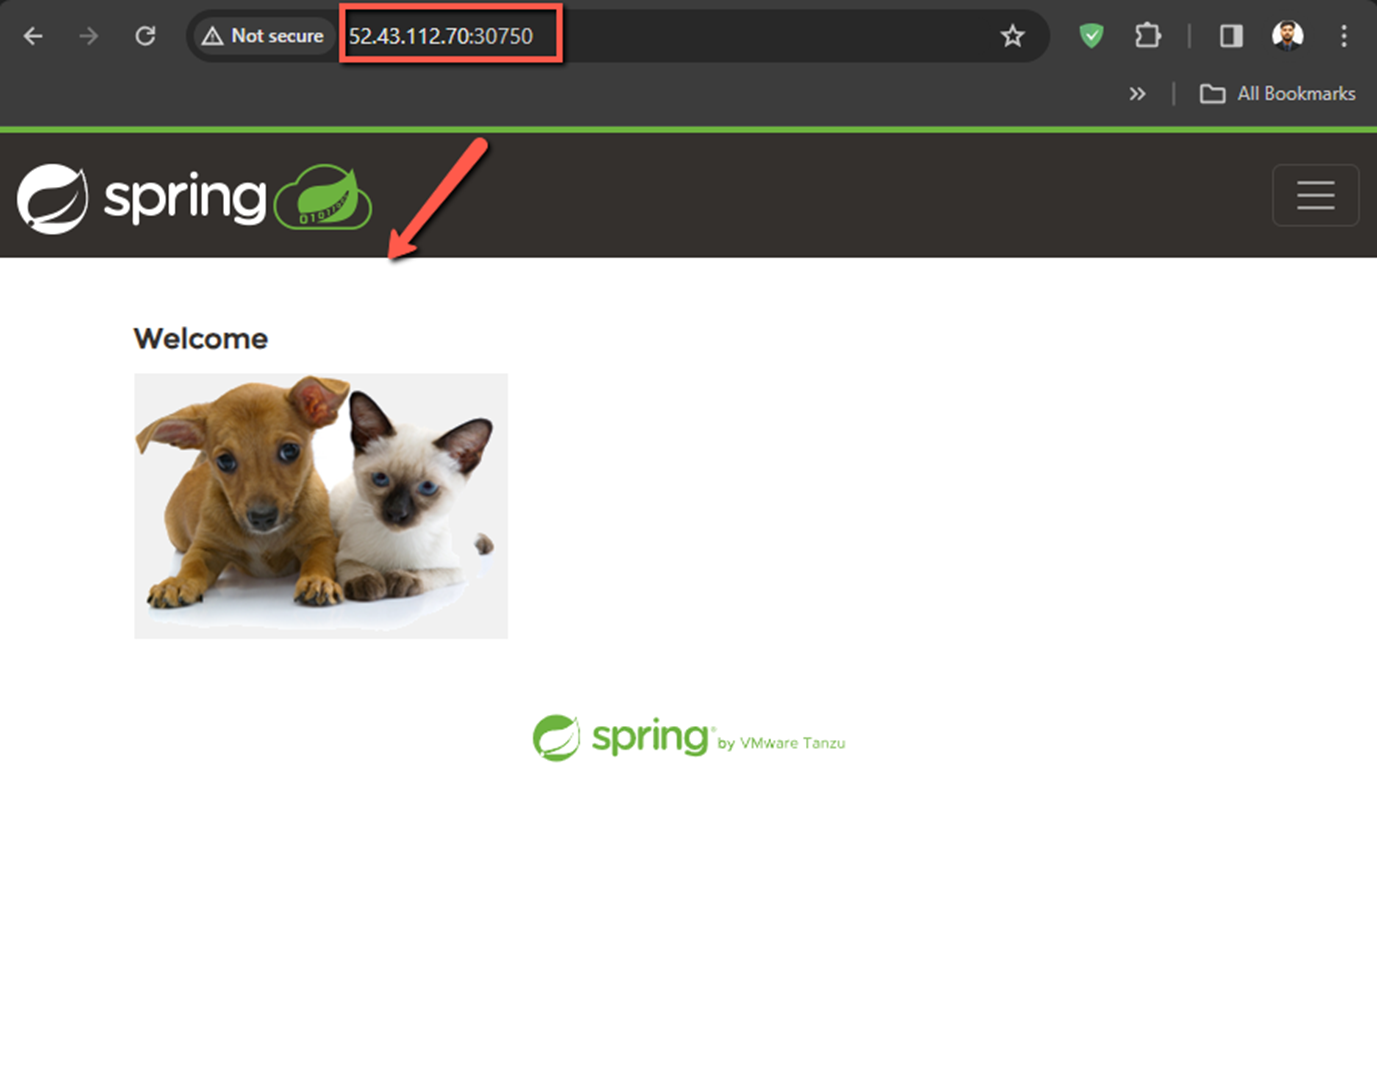
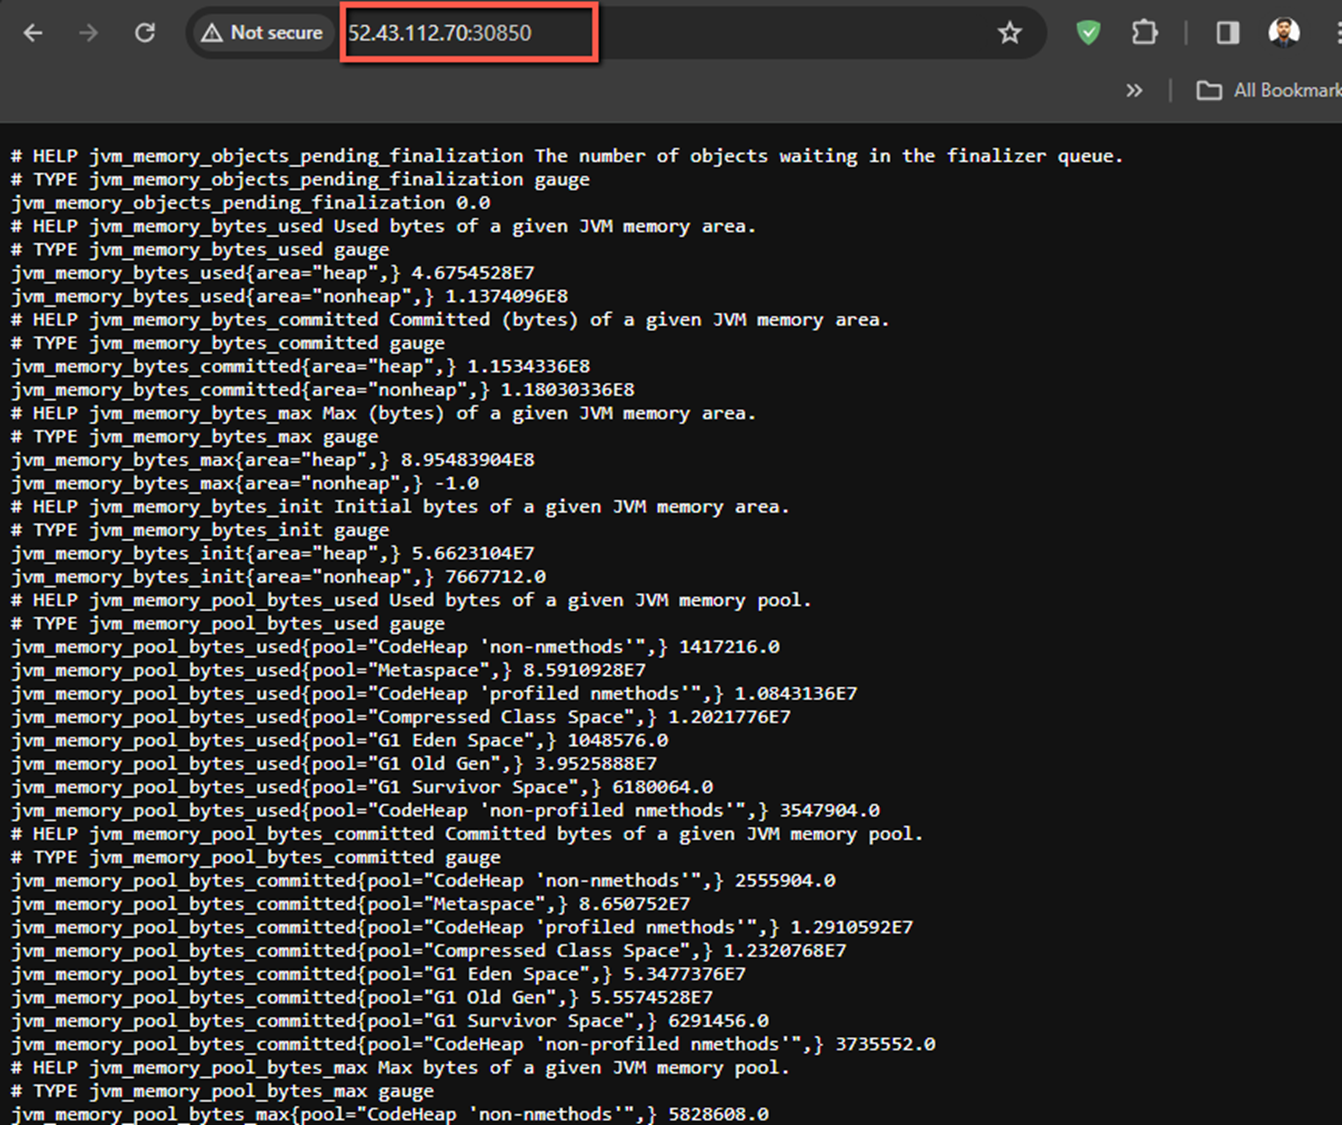
type: NodePortI want to access the application and the metrics over the internet so I am using the spec.type: NodePort, and defining the nodePort numbers such as 30750 for the application and 30850 for the metrics.
To apply this configuration, use the following command.
kubectl apply -f app-service.yamlTo view the list of Services in the monitoring Namespace.
kubectl get svc -n monitoringNow, let's try to access the application and metrics over the internet, for that, you need the Public IP of any one of the instances and the port numbers.
The output of the application
The output of the metrics.
Step 5: Add Scrape Config in Prometheus
Note: This configuration has to be done on the Prometheus server.
The JMX Exporter is successfully exposing the metrics of the Java application.
Now we add a job in the Prometheus server configuration file to scrape these metrics, and then only we can store them in TSDB or make queries.
Find the Prometheus ConfigMap, in my setup, the file name is config-map.yaml. Open it with a text editor.
vim config-map.yamlTo view the list of configmaps in the monitoring namespace.
kubectl get configmaps -n monitoringAdd the following contents inside the configuration file, under the scrape_configs.
If you are using a label selector in the deployment manifest, replace all the occurrences of jmx-java-app with the respective label.
scrape_configs:
    - job_name: 'jmx-java-app'
        kubernetes_sd_configs:
        - role: pod
          namespaces:
            names:
              - monitoring
        relabel_configs:
        - source_labels: [__meta_kubernetes_pod_label_app]
          action: keep
          regex: 'jmx-java-app'
        - source_labels: [__meta_kubernetes_namespace]
          target_label: namespace
        - source_labels: [__meta_kubernetes_pod_name]
          target_label: pod_name
        - target_label: __address__
          replacement: "jmx-java-app-nodeport:5556"
In this promtheus configuration, I am using the kubernetes_sd_configs service discovery method that automatically identifies the pods that belong to the jmx-java-app deployment using jmx-java-app label. So you don't need to manually provide the target details for scrapping the JMX metrics.
To apply this configuration, use the following command.
kubectl apply -f config-map.yamlIt might take a few minutes to replicate the changes in the Prometheus dashboard. If you dont see the changes, then perform a deployment rollout using the following command. Change the prometheus-deployment to your actual Prometheus deployment name.
kubectl rollout restart deployment prometheus-deployment -n monitoringStep 6: Validate JMX Metrics from Prometheus Dashboard
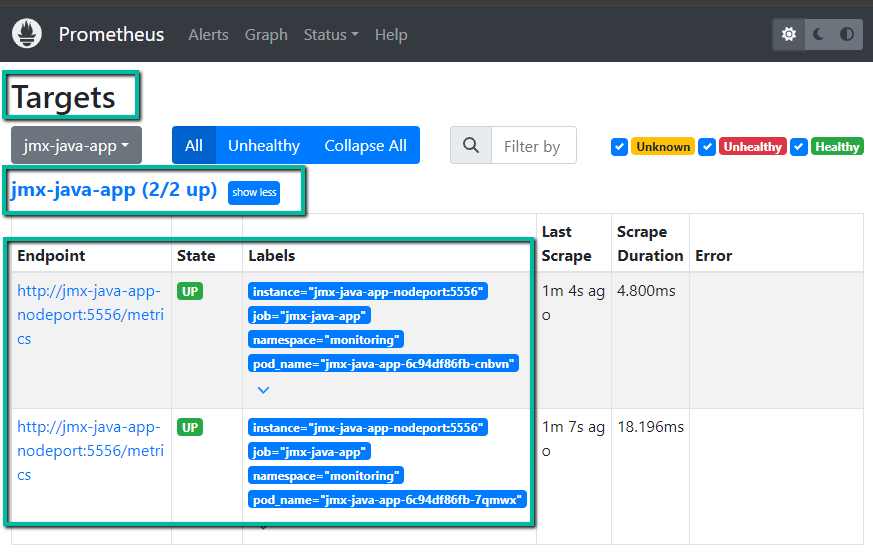
You can validate the JMX targets from the Prometheus dashbaord.
Under the Targets section, we can see the endpoint details, status, and other information as shown below.
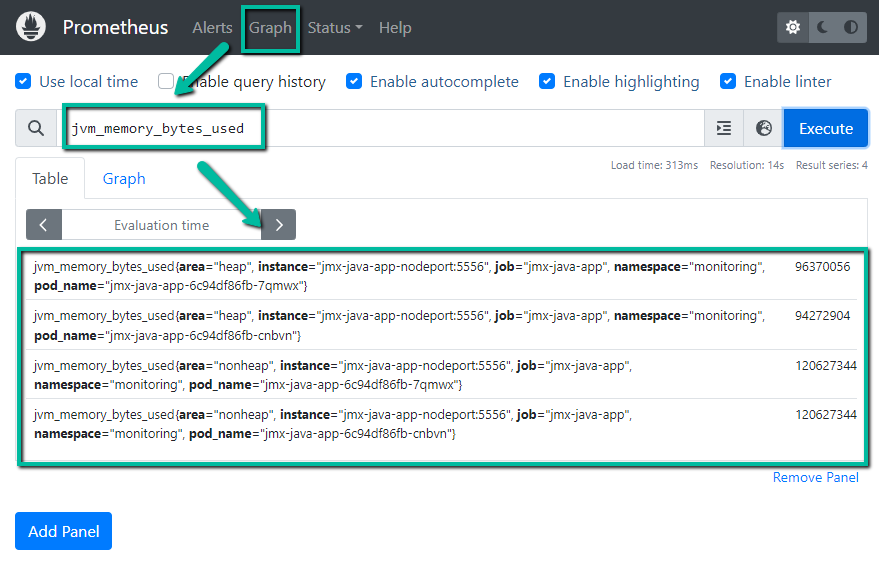
In the Graph section, we can make queries and get results. For example, the following dashboard shows jvm_memory_bytes_used metrics from the app.
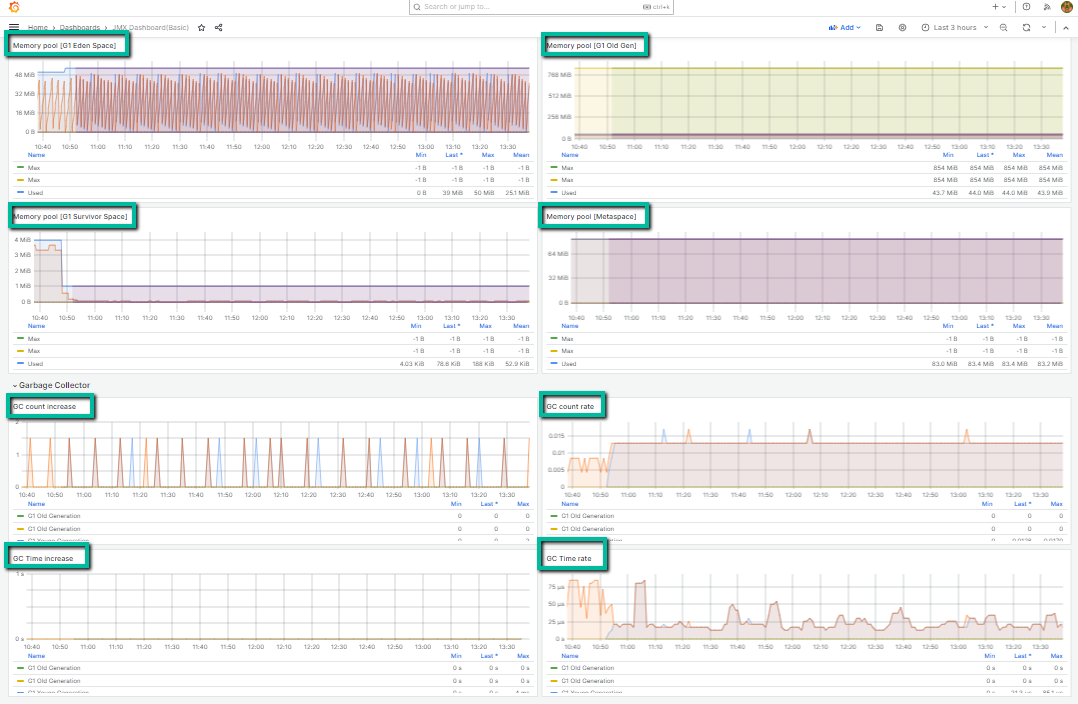
Step 6: Grafana Dashboard
We can visualize the JMX metrics in Grafana dashboards as per our requirements.
If you have a Grafana setup and added Prometheus as a data source, you can create dashboards using the JMX metrics templates. You check out visualizing Promtheus metrics on Grafana blog to know more.
Conclusion
In this blog we have covered steps to implement JMX Exporter on the Kubernetes cluster. You can make further configuration change that is suitable for your application.
Also, in the exporter Configmap, you can add other filter settings for the JMX Exporter to collect other metrics that is required for the monitoring.
Also, for setting for JMX exporter on Linux VM based prometheus setup, please refer this guide.
If you face any errors or need clarification on the setup, drop a comment below.
