


In a previous MLOps blog, we learned how Kubeflow Trainer helps run distributed training workloads on Kubernetes. But once model training is completed, we have a new problem.
How do we know:
- Where do we store the trained model?
- Which dataset created this model?
- How to compare models from different training runs?
- Which model version should go to production? and more..
This is where MLflow helps you.
In this blog, we will explore MLflow and its components in detail and provide a clear guide to using it effectively.
By the end of this guide, you will learn the following:
- What is Experiment Tracking?
- Understanding the MLflow Architecture
- How Kubeflow Pipelines Talk to MLflow
- Deploying MLflow on Kubernetes (Hands-on)
- Training an Employee Attrition Model Locally and Tracking Runs with MLflow (Hands-on)
- Registering and Managing Models in the MLflow Model Registry
Before we dive deep into MLflow, you need to understand what experiment tracking is.
This way, you will be able to relate to MLflow better.
What is Experiment Tracking?
In machine learning, each time you train a model, a new training run is created. An experiment is a collection of those training runs.
For training, we pick an algorithm, set the hyperparameters, point it to a dataset version, and train. If something changes, we train again.
We have explained this in the Training the Model newsletter.
Experiment tracking means automatically logging important information about a training run. For example, during every training run, the following four things get captured.
- Parameters: Algorithm, hyperparameters, dataset version.
- Metrics: Accuracy, F1 score, training time.
- Artifacts: The model file, environment files, etc
- Metadata: Info on artifact location, model signature, input example, custom metadata, etc.

It is similar to how we track commit SHA, build number, logs, etc in the CI system. So a training run without tracking is like a CI build without build history.
The most widely used tool for experiment tracking is MLflow.
What is MLflow?
MLflow is the Git for machine learning experiments.
It is an open-source platform for tracking and managing the complete lifecycle of a model.
Meaning, who trained it, with what parameters, on what data, what the results were, and which version is approved for production.
By tracking every training run, MLflow makes it easy for data scientists to compare experiments and identify which combination of data, parameters, and code produced the best-performing model.
Since all the metadata is stored, you can also reproduce a training run using the same code, parameters, and dataset.
The following diagram illustrates the components of MLflow.

MLflow operates as a client-server system, with four core components:
- MLflow SDK (Client): A Python package used to connect to the MLflow tracking server. You can install it on your local system or call it in ML training workflows to push the details to MLflow.
- Tracking server: A lightweight FastAPI-based web server with a UI and a REST API. Your training code sends data to it over HTTP.
- Backend store: A relational database that stores the metadata of experiments, runs, traces, etc. MLflow supports PostgreSQL, MySQL, SQLite, and MSSQL as backends.
- Artifact store: This component stores artifacts such as model weights, images, and data files. For our attrition model project, this is where
model.skopsends up after training. The artifact store is implemented using object storage services such as AWS S3, MinIO, GCS, Azure Blob Storage, etc.
MLFow Functional components
MLflow has the following three key functional components.
- MLflow Experiments: An experiment is a logical container for your ML work. For example, everything related to the attrition model is part of a single experiment.
- MLflow Run: A run is a single execution of your training code inside an experiment. Every run records the parameters, metrics, artifacts, and code version used for that training. If you train the model 50 times with different hyperparameters, you get 50 runs in a single experiment.
- Model Registry: A centralized repository for managing versioned machine learning models. Once you identify the best-performing model from your experiment runs, you can register it in the Model Registry.
You will understand all these better in the hands-on covered in the upcoming sections.
How Kubeflow Pipelines Talks to MLflow?
Here is the common question everyone has.
We already have Airflow, DVC, Feast, and Kubeflow in our stack. Where exactly does MLflow fit in the MLOps stack?
The integration happens inside the training script that runs as part of a Kubeflow Pipelines.
When the training component executes, the script connects to the MLflow Tracking Server using the configured tracking URI.

During training, it logs all model-related information to MLflow, including hyperparameters, evaluation metrics, model artifacts, and metadata.
Model artifacts are then pushed to the configured artifact store (such as Amazon S3).
Setup Prerequisites
Below are the prerequisites for the hands-on section we will do.
- Kubernetes Cluster
- Kubectl
- Helm
- AWS CLI configured with permissions for IAM roles, S3, and EKS.
Clone Repository
We have pushed all the code files we will use in the hands-on part to our GitHub repository.
Fork or sync your forked MLOps repo to get the latest code changes. Check out this guide to learn how to keep your fork up to date.
You can find the files we will use in the following directories.
.
├── phase-2-enterprise-setup
│   └── mlflow
│        ├── register_model.py
│        ├── requirements.txt
│        └── train_and_log_model.py
└── platform-tools
    └── mlflow
        ├── helm/
        ├── eks-s3.sh
        └── test-pod.yaml
Here, you can see the Helm chart to set up MLflow and scripts to train, log, and register a model in MLflow.
MLflow on Kubernetes (EKS Hands-on)
Now let’s put everything we learned into practice with a hands-on setup. Here is what we will do.
- We will set up MLflow on Kubernetes.
- Configure AWS S3 as an artifact store.
- Run our employee attrition training locally to train and log employee attrition model details.
- Explore the experiment, run details, artifacts, and registered model in the MLflow UI.
How to Set Up MLflow on Kubernetes?
Follow the steps to set up MLflow on an EKS cluster.
Step 1: Create an S3 bucket
We will use an AWS S3 bucket as the backend Artifact store. First, you need to create a bucket.
Replace dcube-mlflow-artifact-store in the following command with a unique bucket name.
aws s3api create-bucket \
  --bucket dcube-mlflow-artifact-store \
  --region us-west-2 \
  --create-bucket-configuration LocationConstraint=us-west-2 \
  --no-cli-pager
Verify the bucket exists.
aws s3api head-bucket \
  --bucket dcube-mlflow-artifact-store \
  --no-cli-pager
Step 2: Deploy PostgreSQL Using Helm Chart
Since we will be using PostgreSQL as the MLflow backend store, let's deploy it using Helm.
helm install mlflow-postgres oci://registry-1.docker.io/bitnamicharts/postgresql \
  --namespace mlflow \
  --create-namespace \
  --set auth.username=mlflow \
  --set auth.password=mlflow123 \
  --set auth.database=mlflow \
--set primary.persistence.size=10GiEnsure the Postgres pod is running.
$ kubectl get po -n mlflow

NAME                           READY   STATUS    RESTARTS   AGE
mlflow-postgres-postgresql-0   1/1     Running   0          35m
Step 3: Update the S3 bucket in the Helm Values File
The next step is to customize the Helm values for the MLflow installation.
Move into the platform-tools/mlflow/helm folder.
cd platform-tools/mlflow/helmYou will find the mlflow.yaml values file inside it.
In that file, replace <bucket-name> with your S3 bucket name in artifactsDestination.

The mlflow.yaml also contains the predefined PostgreSQL service endpoint we set up in the previous step. We are enabling NodePort in the values to access the MLflow UI.
Also, in the values file, you will see options like:
server:
  flag_options:
    - serve_artifacts
  value_options:
    host: "0.0.0.0"
    allowed_hosts: "*"
    cors_allowed_origins: "*"
In this, serve_artifacts makes MLflow upload the artifact to the artifact store. Without it, the client uploads the artifact directly to S3, and you need to provide the client with S3 credentials.
The host makes the MLflow pod listen on all interfaces.
The allowed_hosts and cors_allowed_origins are security options that control which hosts and origins are allowed to connect to MLflow.
If the proper host address is not defined in allowed_hosts, you will get the following error when you try to connect to MLflow.
Invalid Host header - possible DNS rebinding attack detected
Here, we set both to *, so that MLflow can be accessed without restrictions.
We will see about the security options in the upcoming section.
Step 4: Deploy MLflow
Now, let's deploy MLflow on the Kubernetes cluster using the Helm Chart.
Run the following helm install command inside the platform-tools/mlflow/helm folder.
helm install mlflow . --namespace mlflow -f mlflow.yamlRun the following command to check if the pods are up and running.
$ kubectl get po -n mlflow

NAME                             READY   STATUS    RESTARTS   AGE
mlflow-mlflow-68cddb7f64-r277z   1/1     Running   0          98s
mlflow-postgres-postgresql-0     1/1     Running   0          58m
Step 5: Access the MLflow UI
You can access the MLflow UI using the NodePort we exposed. You can get the NodePort using the following command.
kubectl get svc mlflow-mlflow -n mlflowOr you can use the following port-forward command. Keep this
kubectl port-forward deployment/mlflow-mlflow 5000:5000 -n mlflowYou should be able to access the UI at localhost:5000 in your browser, as shown below.

Step 6: Configure EKS Pod Identity for S3 Access
Next, you need to set up AWS EKS Pod Identity so that your MLflow deployment can securely access an S3 bucket without storing AWS credentials in Kubernetes.
All the steps required for the s3 role creation and eks pod identity association are part of the eks-s3.sh shell script in the platform-tools/mlflow folder.
Open the shell script and update the following variables shown in the image with your EKS cluster and bucket names.

Once updated, execute the shell script with the create input.
$ chmod +x eks-s3.sh

$ ./eks-s3.sh create
You should see all the roles and association details in the script output. Now the setup is complete; let’s move on to the MLflow components setup
Run the Training Script
Now, we are going to run a training script, it does the following.
- Trains a scikit-learn Gradient Boosting model using the employee attrition dataset.
- Logs the model, training parameters, and evaluation metrics (Accuracy, Precision, Recall, F1-score, and ROC-AUC) to the MLflow Tracking Server.
You will find a train_and_log_model.py script inside the phase-2-enterprise-setup/mlflow folder.
Now, open the Python script and replace the MLFLOW_TRACKING_URI with the EKS node IP and NodePort address.
Alternatively, if you're using kubectl port-forward, set it to http://127.0.0.1:5000 instead.

Now, create a Python environment and install the dependencies.
python3 -m venv venv
source venv/bin/activate
pip install -r requirements.txt
Once installed, run the train_and_log_model Python script.
python train_and_log_model.pyOnce you execute the script, the log_params(), log_metrics(), and set_tags() send metadata, while mlflow.sklearn.log_model() sends the actual trained model (model.skops) to MLflow along with the files needed to reproduce and serve it.
Explore the Run in the UI
Now, if you visit the MLflow UI, you will find the employee-attrition experiment created as shown below.
Each execution of the training script creates a new run under this experiment.

If you click the employee-attrition experiment, it will show all the training runs. If you select a specific run, you can view everything logged during training, including Parameters, Metrics, Model artifacts, etc.
The following animated GIF shows it better.

However, not all models become part of the Model Registry. Data scientists select the best model and register it so that it becomes part of the Model Registry. This process is covered in the section below.
If you expand the Artifacts section of a specific run and select the MLmodel metadata file, you can view the s3 artifact location.

If you browse the configured S3 bucket, you will find the same model files that MLflow uploaded during training.
Model Signature
If you scroll down a little further in the MLmodel metadata file, you'll see the model signature, as shown below.

Every model expects inputs in a certain schema and format. If you pass inputs that don't match what the model expects, it may give the wrong predictions
So how do you know what inputs the model expects? That's what a model signature solves
A model signature is the schema of a machine learning model. It defines the expected input features, their data types, the prediction output format, and optional inference parameters
For any consumer of the model, it acts as a contract. Meaning anyone pulling the model from the registry knows exactly what the model expects as input and what the expected output format is.
For teams deploying the model, the signature is like an API spec for the model.
As a DevOps engineer, after deployment, you verify that the APIs work as expected using the API spec. Using the model signature, you can do the same for model deployments.
From the tooling perspective, CI/CD tools can use the signature to compare the schema changes against the production model before deployment.

Comparing Training Runs
Training is usually not a one-time activity.
Data scientists train the model multiple times using different algorithms, hyperparameters, and datasets.
Then they can select the runs in the UI and use the compare feature to determine which training run produced the best model, as shown below.

This makes it easy for data scientists to determine which run to deploy.
Register & Promote the Best Model in Model Registry
After comparing multiple runs, the data scientist team selects the best-performing model and registers it in the Model Registry.
This creates a new version of the registered model that stores its artifacts, metadata, metrics, lineage, and version history.
We will use the Python script register_model.py inside the phase-2-enterprise-setup/mlflow folder to register and promote the model.
Open the script and update the tracking uri and run id.
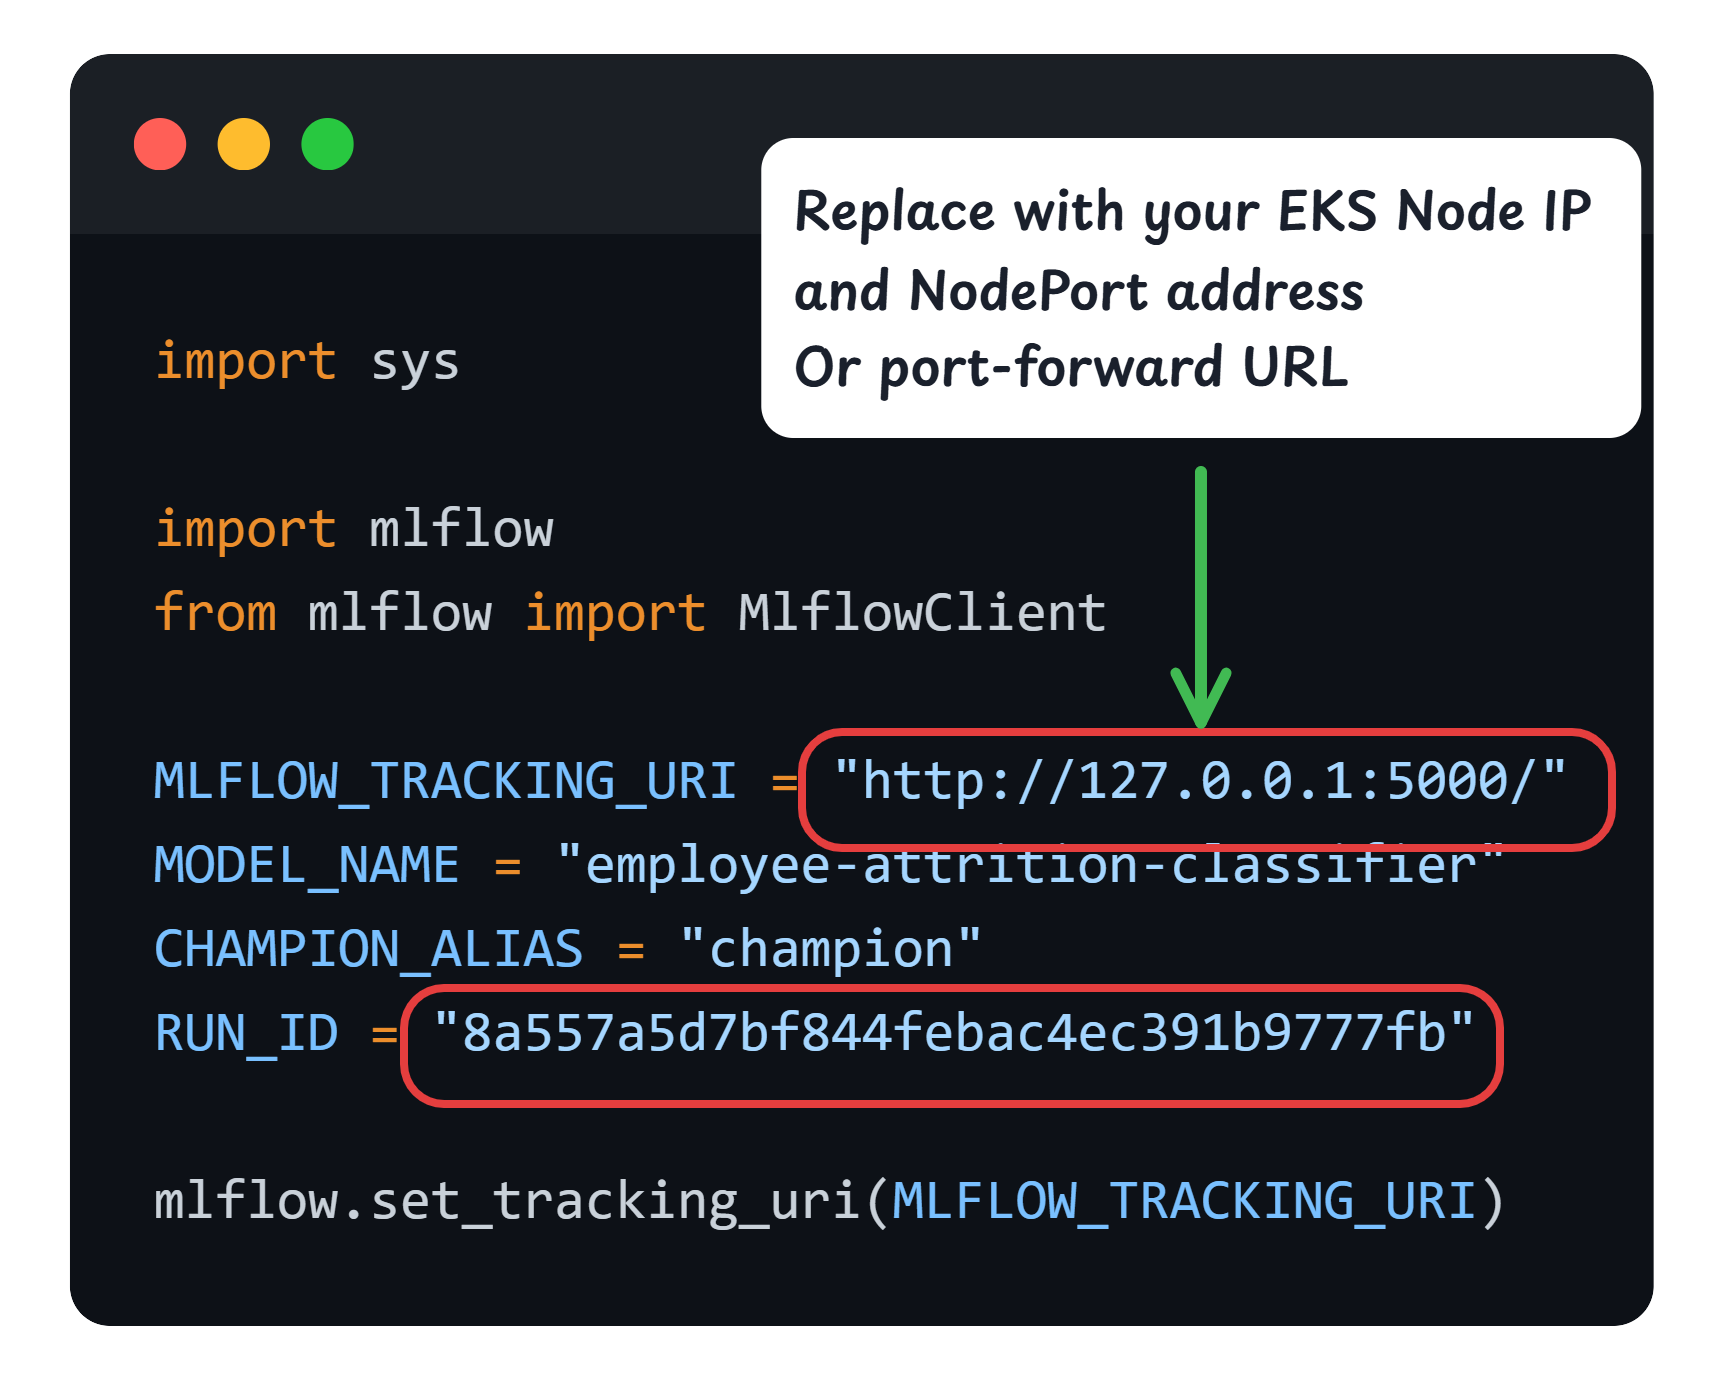
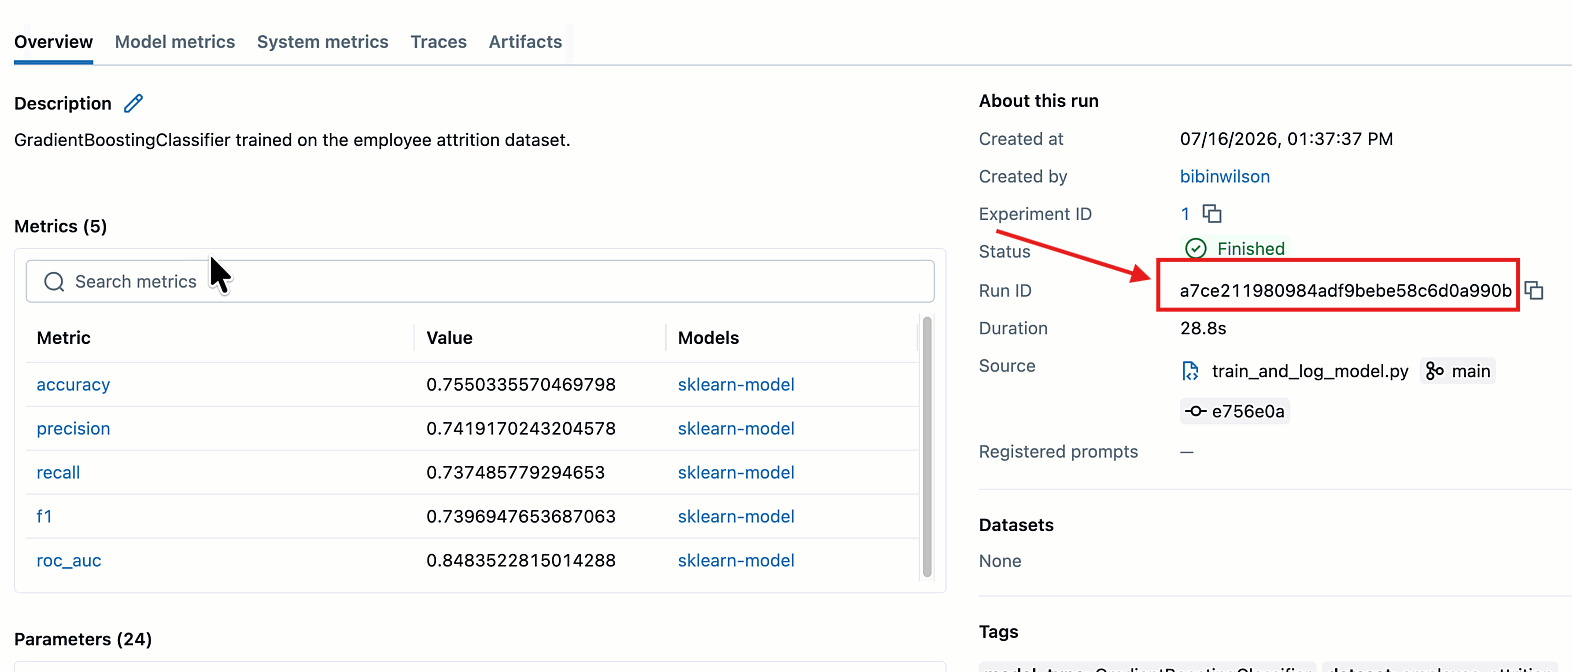
To get the Run ID, open the model run you want to register and promote, you will get the Run ID as shown below.
Once the details are updated, run the script register_model.
python register_model.pyThis script registers the model and assigns the production alias champion tag to the model.
The @champion alias acts like a :stable container image tag. It always points to the model version approved for production deployment.
This allows deployment systems to reference models:/my-model@champion without hardcoding version numbers.

After a model passes predefined quality gates such as accuracy ≥ 95%, F1 score ≥ 94%, and data quality validation, the pipeline automatically registers the model, promotes it with an alias like Champion, and deploys it to the inference platform.
Cleanup
Once you have tested the setup, run the following commands to clean it up.
$ helm uninstall mlflow -n mlflow

$ helm uninstall mlflow-postgres -n mlflow

$ ./eks-s3.sh cleanup

$ aws s3 rb s3://dcube-mlflow-artifact-store --force
What's the Difference Between Model Registry and Artifact Store?
Many people who use MLflow confuse the Model Registry and the Artifact Store.
To put it simply, the Model Registry is a feature of the MLflow tracking server that versions models.
And the artifact store is an external object storage configured in MLflow to store the model files.
MLflow Security Features
After MLflow version 3.5.0, new security features have been added to MLflow.
The first two features we saw in Step 3.
- DNS Rebinding Protection (allowed_hosts) - This only accepts traffic from hosts in the allowed list.
- CORS Protection (cors_allowed_origins) - Only allow specific domains or browsers to call the MLflow tracking API. Even if you open the MLflow UI, if the origin does not match, you will get a 403 status code.
- Clickjacking Prevention - Stop others from embedding the MLflow UI into their own page.
- Security Headers - Stop the browser from accepting unsupported or not-recommended file types or files with hidden scripts to prevent attacks from the browser.
Conclusion
In this blog, we have learned about MLflow and what it's for.
And we have registered our best model as employee-attrition@champion.
Now, how do we actually serve it to real users at scale?
In the next blog, we will look at what KServe is, and how it pulls the registered @champion model from MLflow and deploys it on Kubernetes as a scalable inference service.