

In this detailed guide, you will learn the key concepts, workflows, patterns and tools involved in Kubernetes logging.
When it comes to Kubernetes production debugging, logging plays a crucial role. It helps you understand what is happening inside your pods, what went wrong, and even what could go wrong.
In production, logs are key for debugging both your apps and the Kubernetes cluster itself.
As a DevOps engineer, you should have a clear understanding of Kubernetes logging, where logs are stored, how they are collected, and how to manage them the right way.
How Kubernetes Logging Works?
Kubernetes runs most of its components and workloads as containers.
Each pod can hold one or more containers. Logs from these containers are usually written to stdout and stderr, not to custom log files.
The container engine (like cri-o or containerd) takes care of capturing these logs and saving them in text format on the node's file system. These logs are then accessible using the kubectl logs command.
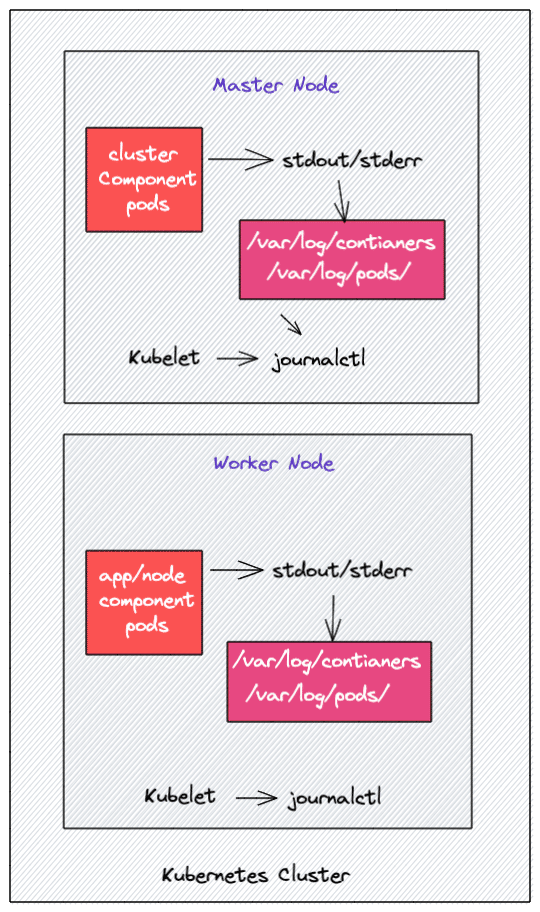
Logging for System Components
Most of the Kubernetes cluster components like api-server, kube-scheduler, Etcd, kube proxy, etc,. run as containers. However, the kubelet component runs as a native systemd service.
It runs as a systemd service and writes its logs to journald.
Also, if the container doesn't stream the logs to STDOUT and STDERR, you will not get the logs using the "kubectl logs" command because the kubelet won't have access to the log files.
Where Kubernetes Stores Logs
You can find the kubernetes pod logs in the following directories of every worker node.
- /var/log/containers: All the container logs are present in a single location.
- /var/log/pods/: Under this location, the container logs are organized in separate pod folders.
/var/log/pods/<namespace>_<pod_name>_<pod_id>/<container_name>/. Each pod folder contains the individual container folder and its respective log file. Each folder has a naming scheme that follows
Also, if your underlying container engine is Docker, you will find the logs in /var/lib/docker/containers the folder.
If you log in to any Kubernetes worker node and go to /var/log/containers the directory, you will find a log file for each container running on that node. The log file naming scheme follows /var/log/pods/<namespace>_<pod_name>_<pod_id>/<container_name>/. An example is shown in the image below.
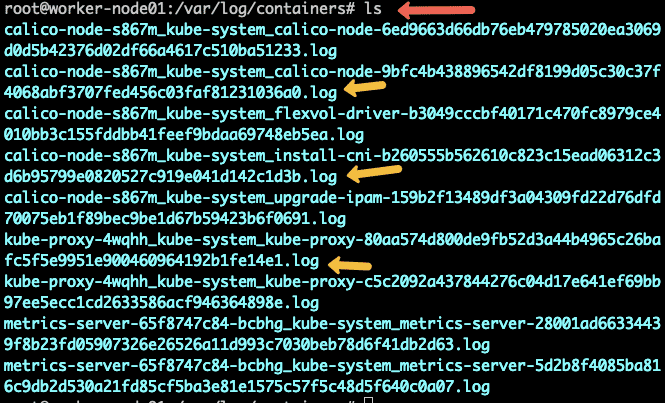
Also, these log files are controlled by Kubelet, so when you run the kubectl logs command, kubelet shows these logs in the terminal.
Kubelet Logs
For Kubelet, you can access the logs from individual worker nodes using the journalctl command. For example, use the following command to check the Kubelet logs.
journalctl -u kubelet
journalctl -u kubelet -o cat
If the Kubelet is running without systemd, you can find the Kubelet logs in the /var/log directory.
Kubernetes Container Log Format
As explained earlier, all the log data is stored in plain text format. If you open any of the log files, you will find the logs in following structure for each log entry.
<TIME> <LOG LEVEL> <METADATA> <LOG MESSAGE>
- Log Level: The actual log data. This indicates the severity of the log entry, such as INFO, WARN, ERROR, etc.
- Log Message: This is the actual description of what was logged
- Metadata: Hostname, pod name, IP address, labels, etc.
- Time - Timetamp
If you open any log file, you will see the information mentioned above in plain text format.
Types for Kubernetes logs
When it comes to Kubernetes, the following are different types of logs.
- Application logs: Logs from user-deployed applications. Application logs help you understand what is happening inside the application.
- Kubernetes Cluster components: Logs from api-server, kube-scheduler, etcd, kube-proxy, etc. These logs help you troubleshoot Kubernetes cluster issues.
- Kubernetes Audit logs: All logs related to API activity are recorded by the API server. Primarily used for investigating suspicious API activity.
Kubernetes Logging Architecture
If we take the Kubernetes cluster as a whole, we would need to centralize the logs. There is no default Kubernetes functionality for centralizing, logs.
You need to set up a centralized logging backend (Eg, Elasticsearch) and send all the logs to the logging backend.
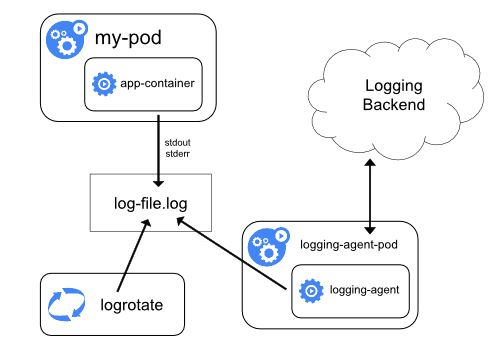
The following image depicts a high-level kubernetes logging architecture.
Let's understand the three key components of logging.
- Logging Agent: A log agent that could run as a daemonset in all the Kubernetes nodes that streams the logs continuously to the centralized logging backend. The logging agent could run as a sidecar container as well. For example, Fluentbit.
- Logging Backend: A centralized system that is capable of storing, searching, and analyzing log data. A classic example is Elasticsearch.
- Log Visualization: A tool to visualize log data in the form of dashboards. For example, Kibana.
- Log Alerting: Based on predefined KPIs, alerts can be set up for specific log events. Organizations use tools like Xmatters and PagerDuty to send email or call notifications.
Kubernetes Logging Patterns
This section will look at some of the Kubernetes logging patterns to stream logs to a logging backend. There are three key Kubernetes cluster logging patterns
- Node-level logging agent
- Streaming sidecar container
- Sidecar logging agent
Let's look at each method in detail.
1. Node Level Logging Agent
In this method, a node-level login agent (Eg: Fluentd) reads the log file created using container STDOUT and STDERR streams and then sends it to a logging backend like Elasticsearch. This is a commonly used logging pattern and works pretty well without any overhead.
Even the 12factor apps methodology suggests streaming logs to STDOUT.
In managed Kubernetes services like GKE or EKS, the backend would be AWS CloudWatch and Google Stackdriver.
2. Streaming sidecar container
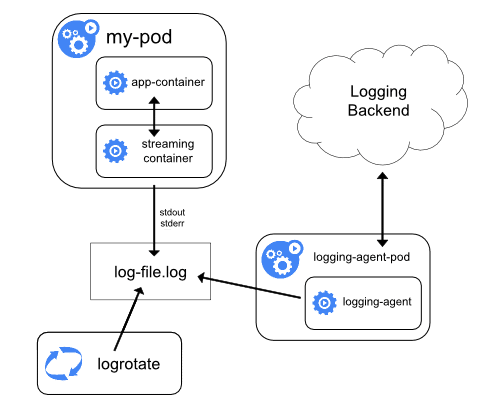
This streaming sidecar method is useful when the application cannot write logs to the STDOUT and STDERR streams directly.
So, the application container writes all the logs to a file within the container. Then, a sidecar container reads from that log file and streams it to STDOUT and STDERR. Rest is the same as the first method.
3. Sidecar Logging Agent
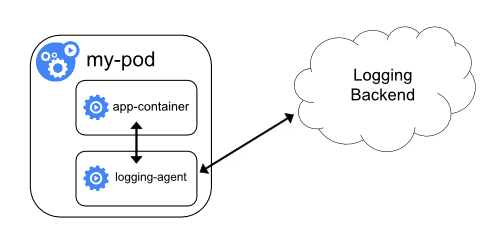
In this method, the logs don't get streamed to STDOUT and STDERR. Instead, a sidecar container with a logging agent would run alongside the application container. Then, the logging agent would directly stream the logs to the logging backend.
There are two downsides to this approach.
- Running a logging agent as a sidecar is resource-intensive.
- You won't get the logs using
kubectl logscommand as Kubelet will not handle the logs.
Kubernetes Logging Tools
The most commonly used open-source logging stack for Kubernetes is EFK (Elasticsearch, Flunentd/Fluent-but, and Kibana).
- Elasticsearch - Log aggregator/search/analysis
- Flunetd/Fluentbit - Logging agent (Fluentbit is the light-weight agent designed for container workloads)
- Kibana - Log Visualization and dashboarding tool
- Grafana Loki - Logging for Kubernetes
When it comes to Managed Kubernetes services like Google GKE, AWS EKS, and Azure AKS, they are integrated with cloud-specific centralized logging.
When you deploy a managed Kubernetes cluster, you have options to enable log monitoring in the respective logging service. For example,
- AWS EKSThe following uses Cloud
- Google GKE uses Stackdriver monitoring
- Azure AKS uses Azure Monitor
Also, organizations might use enterprise logging solutions like Splunk. In this case, the logs are forwarded to Splunk for monitoring to comply with the organization's log retention norms. The following are some of the enterprise logging solutions.
I know a use case where we pushed all logs from GKE to Splunk using pub-sub for longer retention and used Stackdriver with less log retention for real-time querying due to cost constraints.
EFK For Kubenretes Logging
One of the best open-source logging setups for Kubernetes is the EFK stack. It contains Elasticsearch, Fluentd, and Kibana.
We have a detailed blog on EFK setup on Kubernetes. It provides a step-by-step guide to set up the entire stack.
Check out the EFK Kubernetes setup guide.
Kubernetes Logging FAQ's
Let's look at some of the frequently asked Kubernetes logging questions.
Where are Kubernetes pod logs stored?
If a pod uses STDOUT and STDERR streams, the log gets stored in two locations. /var/log/containers and /var/log/pods/. However, if the pod uses a sidecar log agent pattern, the log gets stored within the pod.
How do I find Kubernetes audit logs?
You can find the audit logs from the path specified in the --audit-log-path flag during the cluster setup. If audit policy is enabled and this flag is not set, then the api-server streams the audit logs to STDOUT. In managed Kubernetes services, you have the option to enable audit logs, which you can then view in the respective managed logging backend, such as CloudWatch or Stackdriver.
How does Kubernetes rotate logs?
Kubernetes is not responsible for rotating container logs. The underlying container runtime can handle the log rotation using specific parameters. For example, Docker runtime has a configuration file daemon.json to configure log rotation options.
How do I view Kubernetes logs in real-time?
You can use the kubectl utility to view logs and events in real-time.
Conclusion
In this guide, we have looked at the essential concepts related to Kubernetes logging.
Also, in my DevOps engineer guide, I have explained why learning about logging is very important for a DevOps engineer.
In the next series of articles, we will look at setting up a Kubernetes logging infrastructure using open source tools.