


Here is what we are going to do in this setup.
- Setup Evidently platform with PostgreSQL using our custom helm chart.
- Test model monitoring using Evidently AI library using simulated data.
- Validate model metrics in Evidently AI dashboard.
Lets get started.
Setup Prerequisites
Below are the prerequisites for this setup
- Kubernetes cluster
- kubectl
- Helm
- Python 3.11+
Setup Evidently AI Platform on Kubernetes
Below are the steps to deploy Evidently AI on a Kubernetes cluster.
Step 1: Clone the Repository
We have pushed the Helm chart to deploy Evidently AI and a test file to show how model drift is calculated in our MLOps Github Repository.
Fork and clone the repository using the following command.
git clone https://github.com/techiescamp/mlops-for-devops.git

cd mlops-for-devops
The files we are going to use in this blog are shown in the structure below.
.
├──platform-tools
│  └──evidently-ai
|      ├── helm
│         ├── Chart.yaml
│         ├── values.yaml
│         └── templates
|      ├── psql.yaml
└──phase-2-enterprise-setup
   └──evidently-ai
         └── model-monitoring.py
Step 2 : Customize the Evidently Helm Values File
Before deploying the Helm chart, customize the values file.
Assuming you are inside the mlops-for-devops directory, move to the platform-tools/evidently-ai directory using the following command.
cd platform-tools/evidently-aiThere, you can find the Helm values file values.yaml.
In the values file,
- We have evidently as the PostgreSQL username and password. Replace it if you want to use different credentials.
- Change the service NodePort if its already in use. The default one is
30081 - Change the volume size if needed
- When we are writing this blog, the latest image tag is
0.7.21, update the image tag if a new version is pushed. The container image we used in the Helm chart is evidently-ai's own image.
Step 3: Install the Evidently AI Helm Chart
Now that we have everything needed for evidently AI deployment, lets deploy the Helm Chart.
Make sure you are inside the platform-tools/evidently-ai/helm directory, when running the following Helm install command.
helm install evidently .This will deploy the evidently-ai pod in the evidently namespace along with a PostgreSQL pod.
Use the following command to list the pods.
kubectl get pods -n evidently
You will get the following output.
NAME                                  READY   STATUS    RESTARTS   AGE

evidently-ui-7d9f5b8c6-xvn2p          1/1     Running   0          2m
evidently-postgres-0                  1/1     Running   0          2m
Step 4: Access the Evidently UI
Now, let's access the UI of Evidently.
Since we exposed the service on NodePort 30081, the URL for the UI will be,
http://<NODE_EXTERNAL_IP>:30081
To get the external IP of any node in your cluster, use the following command
kubectl get nodes -o wide
Or you can using port forwading option to access the UI. Replace pods/evidently-ui-5d947b9568-xckrg with your pod name.
kubectl port-forward pods/evidently-ui-5d947b9568-xckrg -n evidently 8000:8000
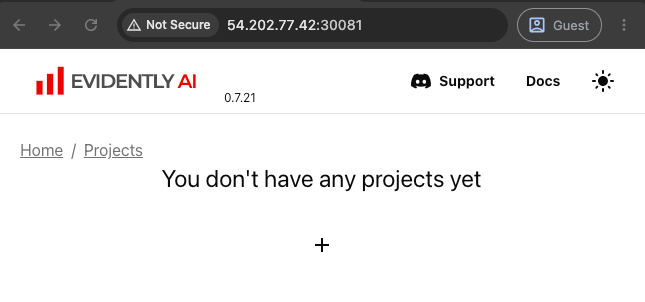
If you access the UI on the browser using the http://localhost:8000 or NodePort URL, you will see the UI as shown below.
NodePort, so in production use Ingress to access it securely.Model Monitoring Using Evidently AI
For testing the model monitoring pipeline, we will use a Python Script to send simulated values to detect data changes.
The Python Script we are going to use is inside the phase-2-enterprise-setup/evidently-ai directory. Here is what the script does.
- It generates 4000 synthetic rows with 8 features. In production, this data would come from real user requests hitting KServe.
- It then splits the data 40/60. The 40% trains the model. The 60% emulates the production inference dataset.
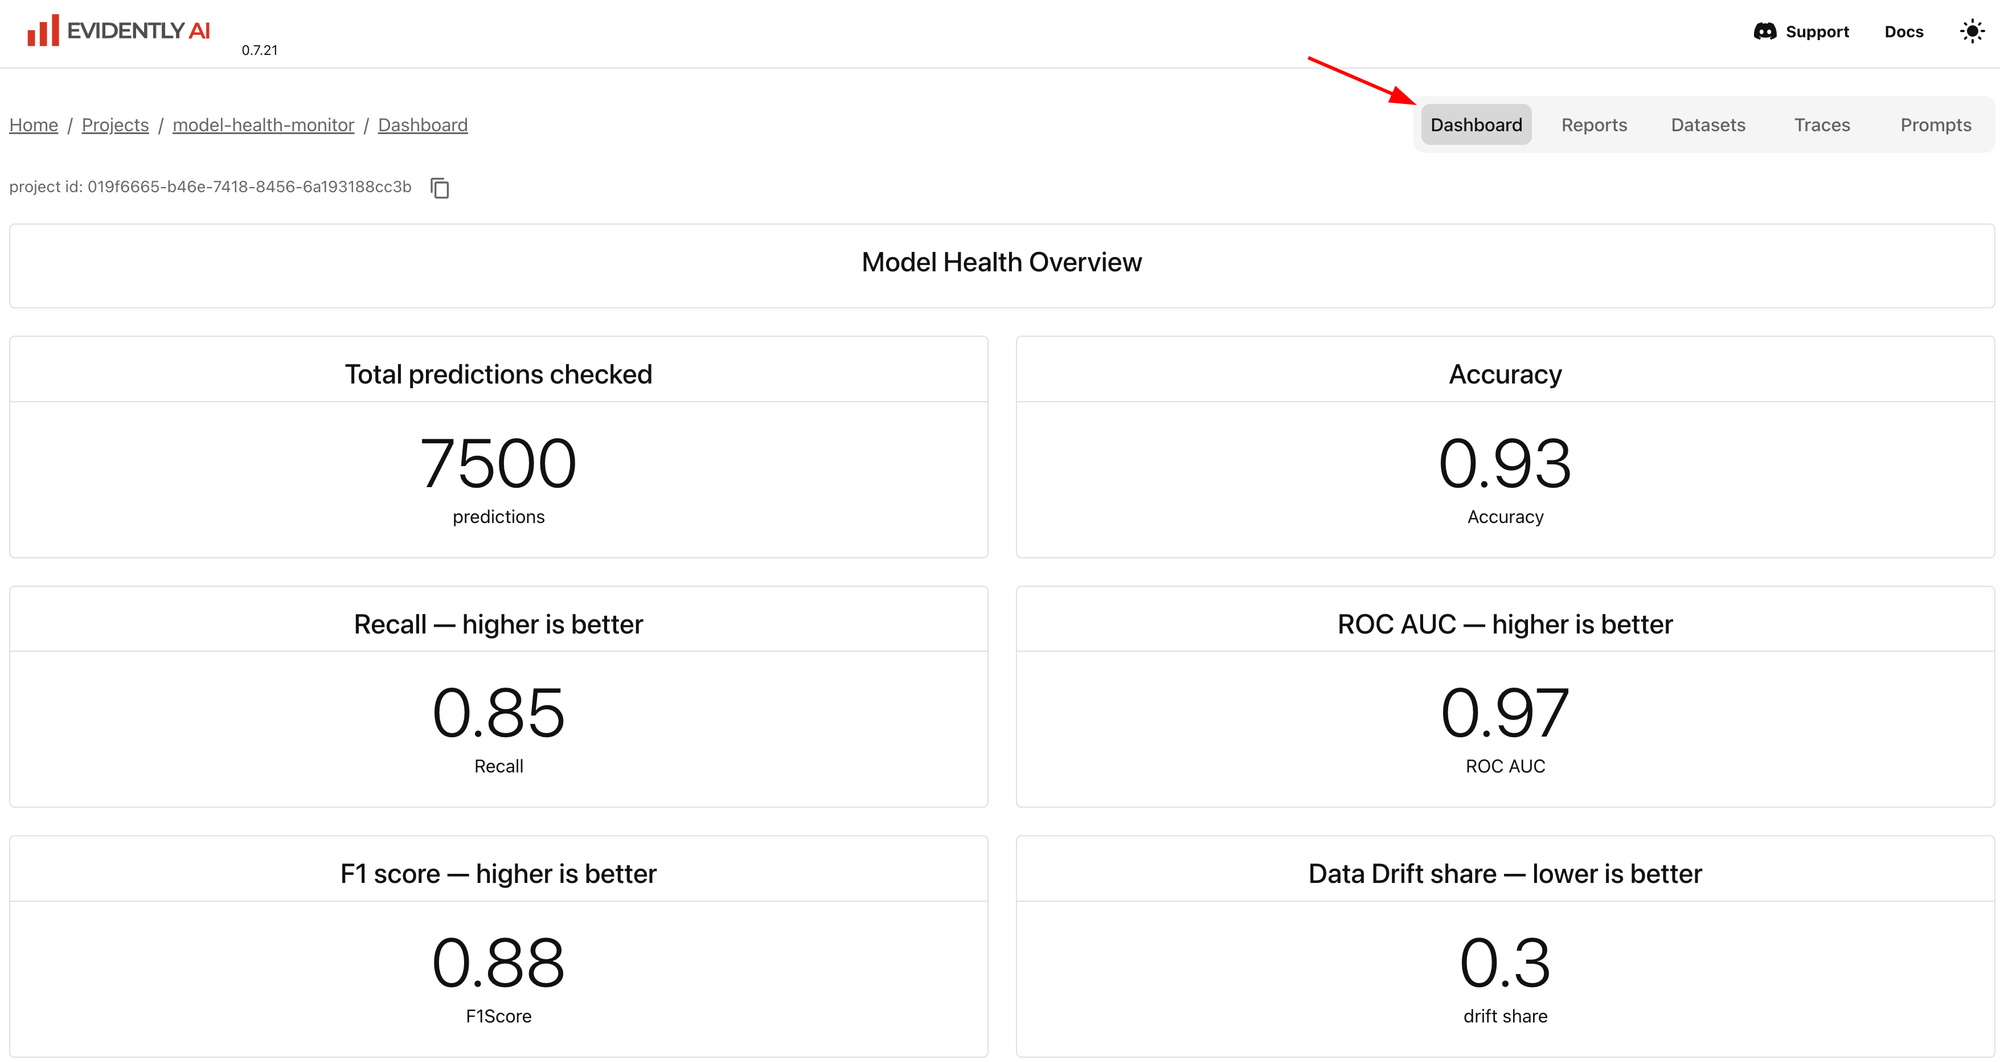
- It connects to the Evidently project UUID and lays out panels for counters for row count, accuracy, ROC AUC, and drift share
Assuming you are inside the platform-tools/evidently-ai directory, run the following command to get into phase-2-enterprise-setup/evidently-ai directory.
cd ../../phase-2-enterprise-setup/evidently-ai/Step 1: Set up a Virtual Environment
Once you are inside the phase-2-enterprise-setup/evidently-ai directory, create a virtual environment and activate it.
python3 -m venv venv
source venv/bin/activate
Then, install the required packages using the following pip command.
pip install evidently scikit-learn pandasStep 2: Create a Project
First, we need to create a project in our self-hosted Evidently AI.
For that click on the + button, which will ask you for a name and description, enter it, and click the Save button to create a project.
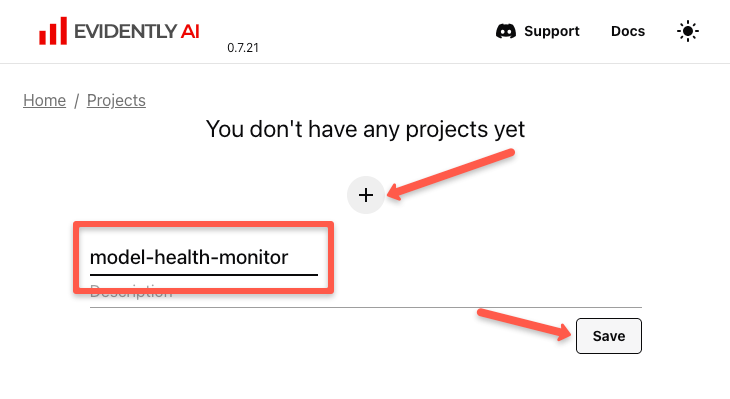
Once the project is created, click the project you created, and you can see the following.
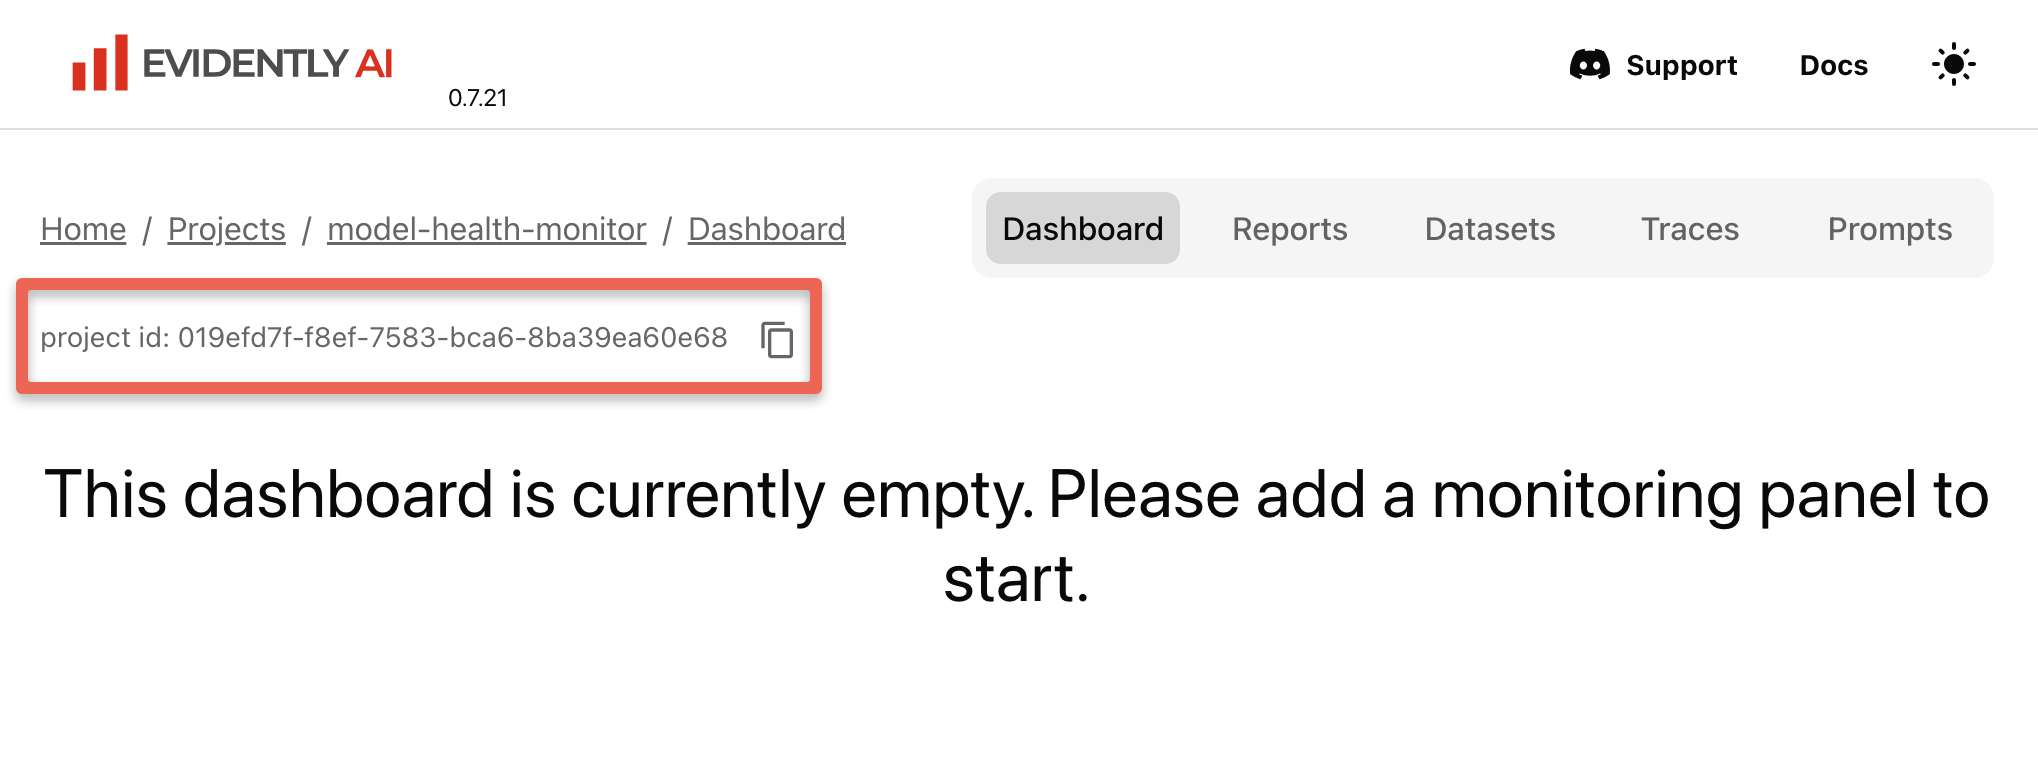
Also, inside the project, you can see 5 tabs:
- Dashboard - Here we can see how much the data has drifted as a value, a chart, or a graph.
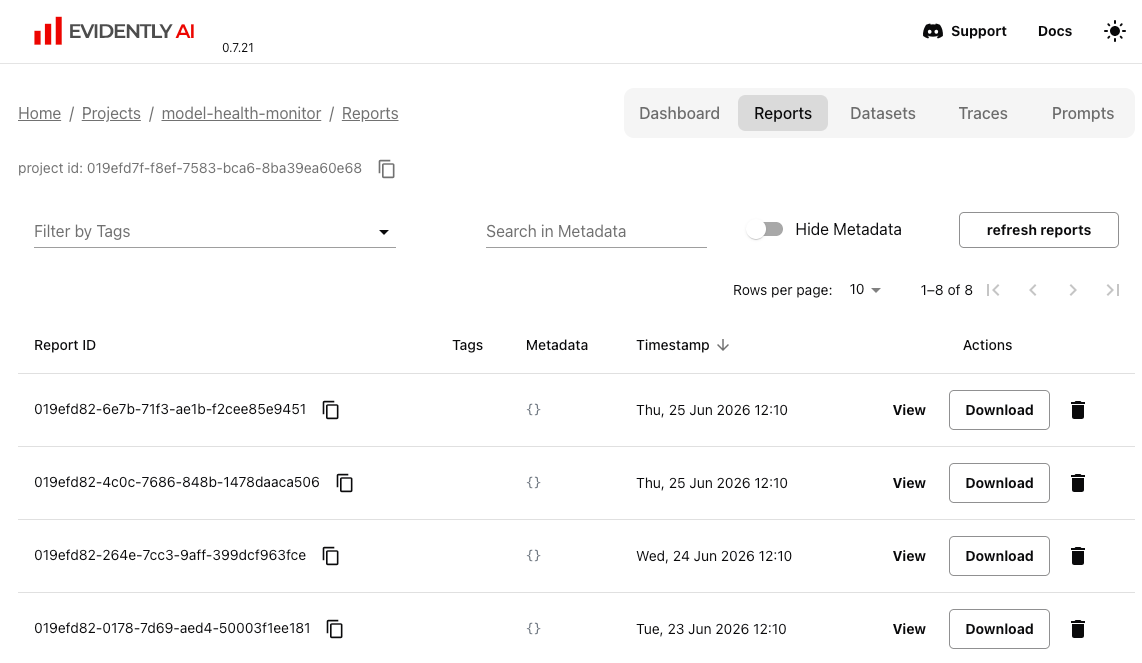
- Reports - Here we can see the data pushed for each, and the information about the specific run is stored in a unique ID.
- Datasets - Contains raw data files that are uploaded to it.
- Traces - It traces the LLM calls.
- Prompts - Used to monitor and evaluate the prompts sent to LLMs.
Step 3: Run the Python Script
Before running, open the script and update it with the EVIDENTLY_URL and PROJECT_ID, which you copied in the previous step.
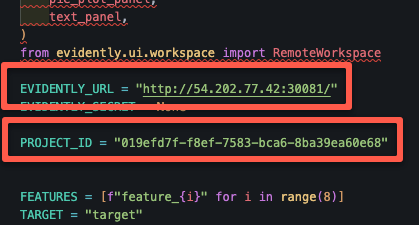
Then run the following command to generate data and push to Evidently AI.
python model-monitoring.py --backfill 7--backfill 7 flag to make it push simulated data of 7 snapshots in one run, so we can see 7 different types of data to compare in the dashboard. You can change the number if needed.If the script runs successfully, you will get an output similar to this.
Connecting to http://54.202.77.42:30081/
Using project: 019efd7f-f8ef-7583-bca6-8ba39ea60e68
Dashboard built.
Training model and reference data ...
Uploaded reference dataset.
Backfilling 7 day(s) of history ...
  pushed snapshot @ 2026-06-19
  pushed snapshot @ 2026-06-20
  pushed snapshot @ 2026-06-21
  pushed snapshot @ 2026-06-22
  pushed snapshot @ 2026-06-23
  pushed snapshot @ 2026-06-24
  pushed snapshot @ 2026-06-25
Pushing current monitoring tick ...
  pushed snapshot @ 2026-06-25 12:04:57

Done. Open the project -> Dashboard tab (refresh if needed). Run again — or schedule it — to keep adding points.
Step 4: Verify the Model Monitoring Metrics in Evidently AI Dashboard
Once the run is successful, open the Evidently UI, and you can see the dashboards updated in the project which you created.
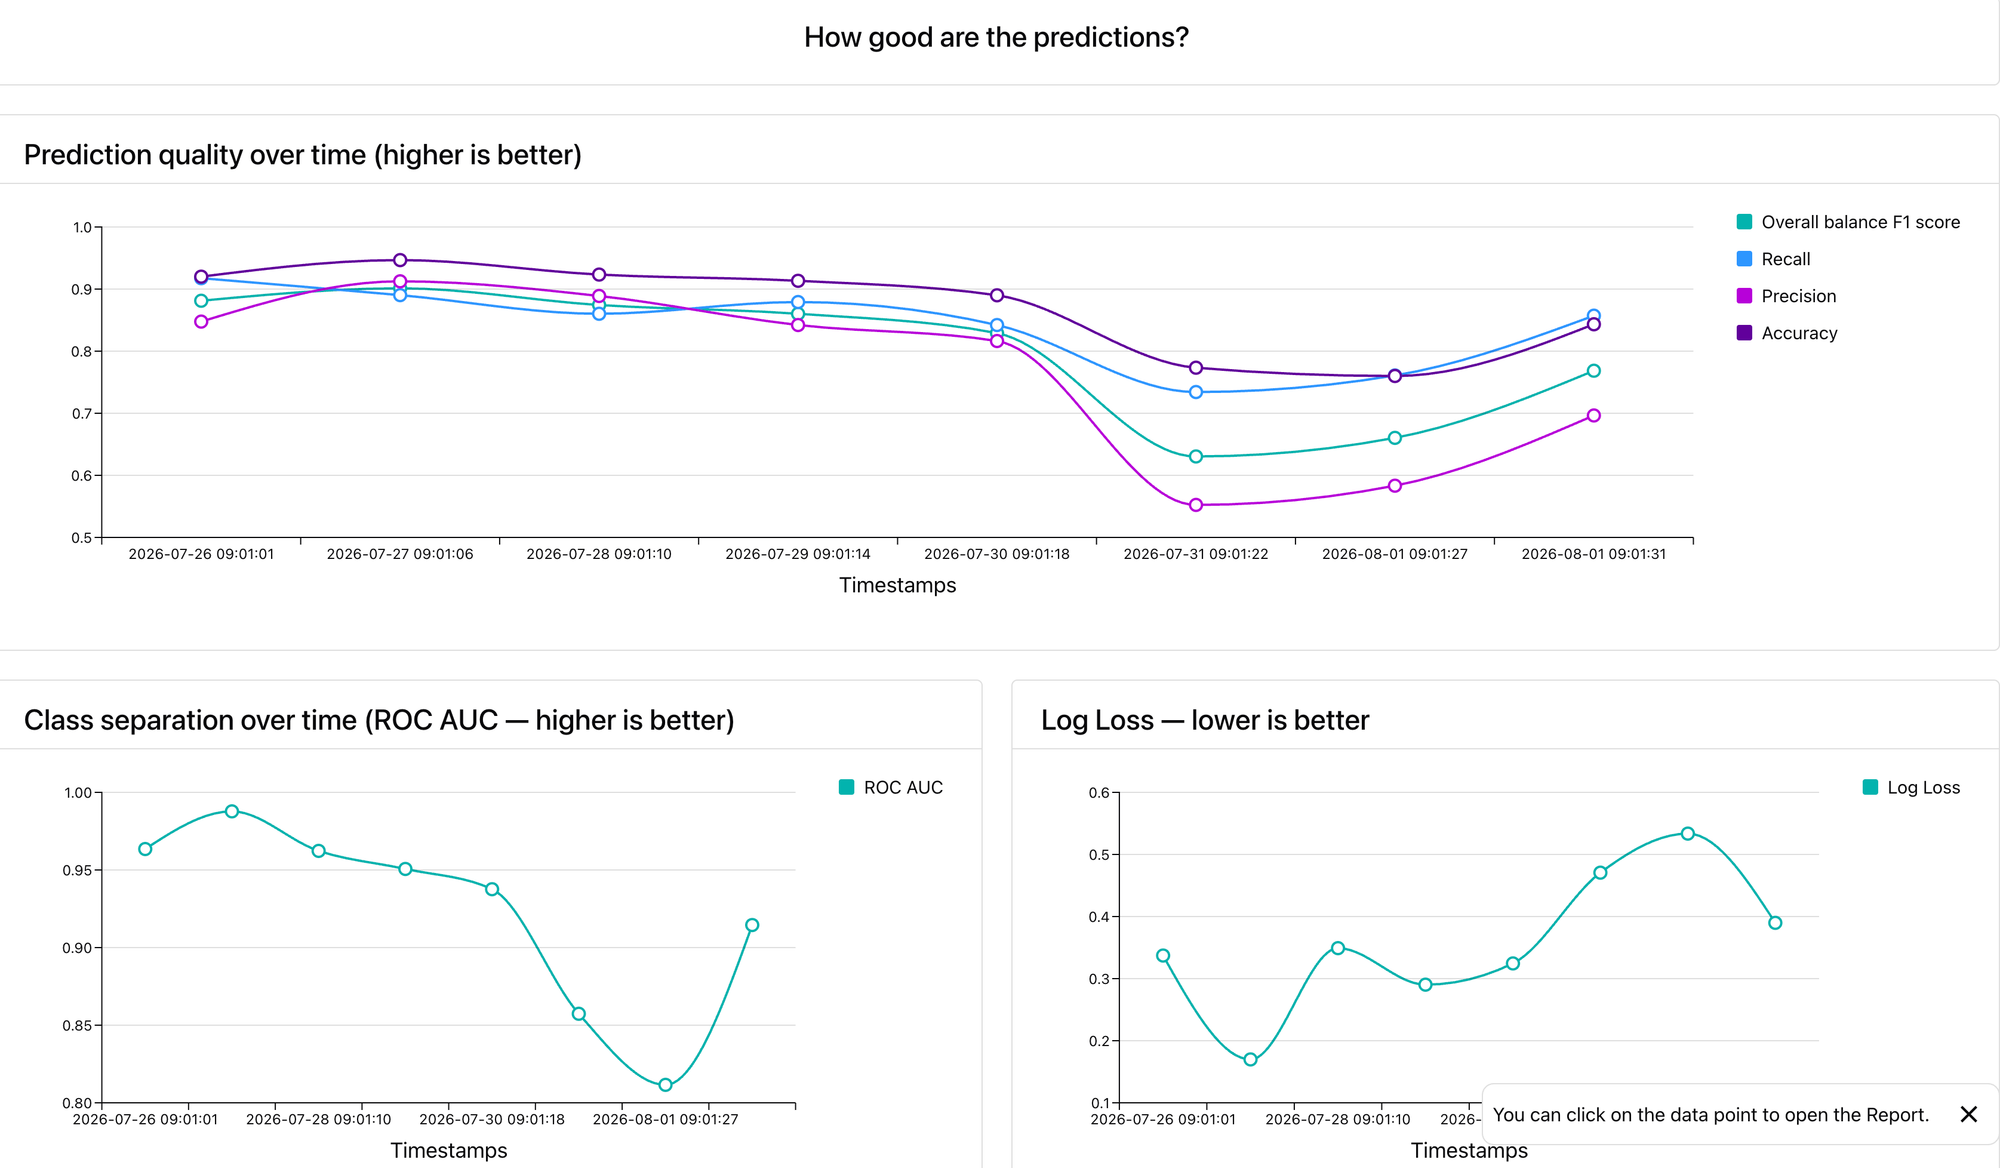
If you scroll down you can see the prediction metrics (F1 score, Recall, Precision and Accuracy) in graph format as shown below.
You can also check reports of each data and datasets under each tabs.
Conclusion
In this blog, we have learned how machine learning model monitoring works using Evidently AI.
Also, we have self-hosted it on Kubernetes and sent sample data to check how it detects data drift.
In simple terms, your application monitoring tools tell you if they are up and working properly, and model monitoring tools tell you that the model is still giving the output accurately.