

In this blog, you will learn to install and configure Prometheus JMX Exporter on a Linux server.
You will also learn to instrument a Java application using the JMX Exporter, export metrics to prometheus and query it using PromQL.
Prerequisites
Here are the prerequisites for setting up a JMX exporter on a Virtual machine.
We need two servers.
- Server 01: Prometheus server up and running. If you dont have a Prometheus setup, follow the Prometheus setup on linux blog.
- Server 02: Server to run the Java application and the JMX exporter.
How To Setup JMX Exporter on VM?
For this tutorial, I am using two Ubuntu based EC2 instances and the instance type is t2.medium.
I assume you already have the Java application (jar files), or if you want to test that, you can use this repository.
git clone https://github.com/techiescamp/java-spring-petclinicFollow the steps given below for the setup and configuration.
Step 1: Download the JMX Exporter Agent
To download the JMX Exporter Java agent, use the following command.
wget https://repo1.maven.org/maven2/io/prometheus/jmx/jmx_prometheus_javaagent/0.19.0/jmx_prometheus_javaagent-0.19.0.jarThe next step is to create a configuration file for the JMX Exporter config.yaml. This file will decide what has to be collected from the JMX MBean server.
Step 2: Create a Configuration File for the JMX Exporter
There are a lot of metrics and information available on the MBean server, but we might only have a few metrics to monitor, we provide configuration to filter the necessary metrics from the server.
Create a configuration file config.yaml
lowercaseOutputName: true
lowercaseOutputLabelNames: true

rules:
  - pattern: 'java.lang:type=Memory'
For testing purposes, I am using this configuration to filter the memory-related metrics. For all the supported metrics, please refer to the official documentation.
Step 3: Expose Metrics through the HTTP Server
To expose the Java application metrics, use the following command.
sudo java -javaagent:jmx_prometheus_javaagent-0.19.0.jar=9093:config.yaml -jar java-spring-petclinic/target/spring-petclinic-3.2.0-SNAPSHOT.jarThe JMX Exporter will be used as a Java application's runtime agent and I have given the port number 9093, you can give a different one because there is no default port for the JMX Exporter.
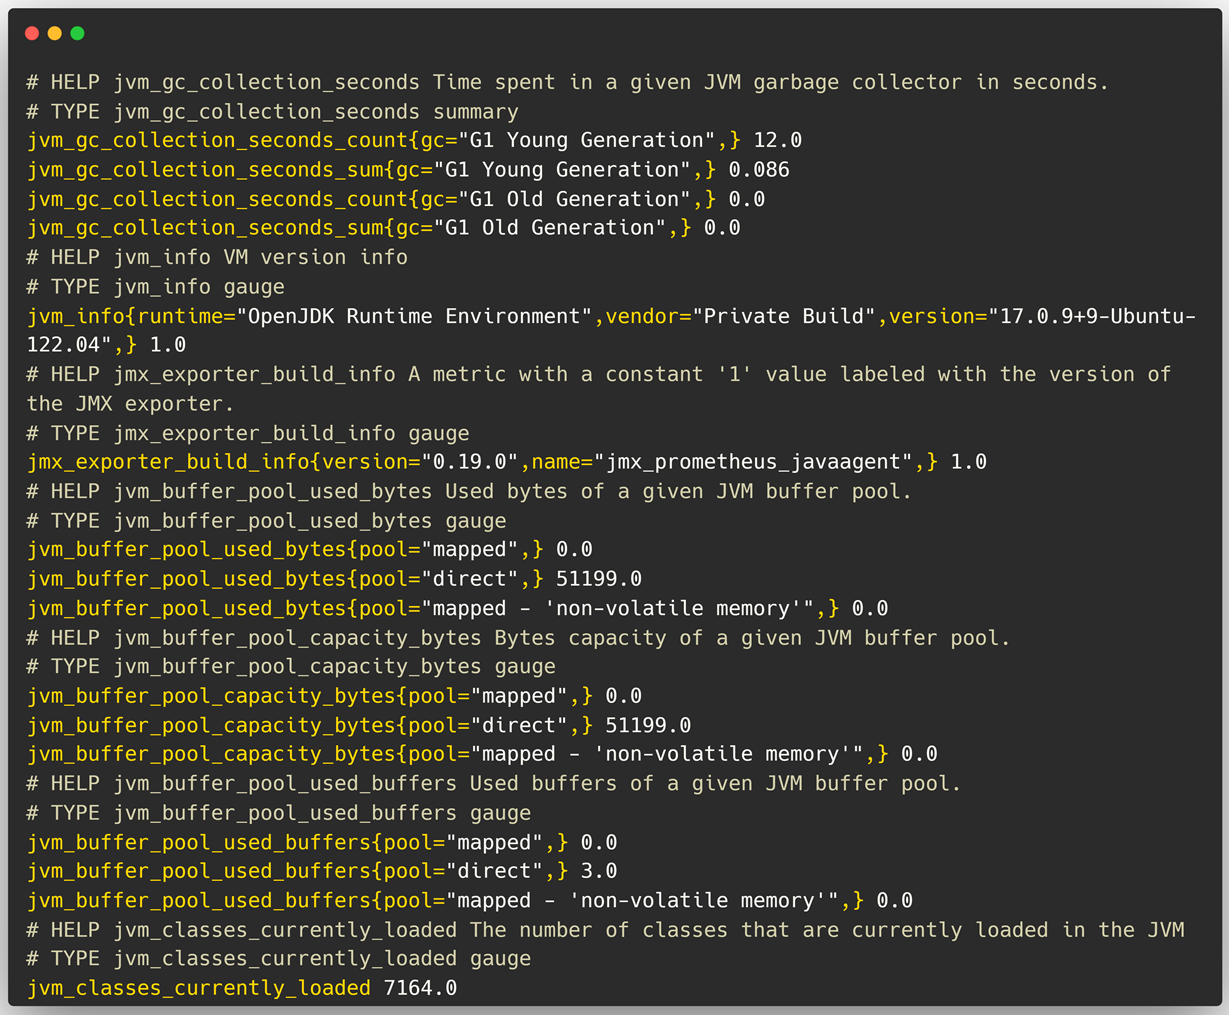
To view the metrics from the localhost, use the following command.
curl localhost:9093If you want to see the metrics over the internet then you need the instance public IP and the Port number.
Open a browser and paste the Public IP and the port number <Public IP>:9093, and you will get this output.
Now we can check Prometheus and ensure that it is periodically scrapping the metrics from the JMX Exporter.
Step 4: Add JMX Exporter Job in Prometheus
We need to create a job in the Prometheus configuration file then only Prometheus can pull and store the metrics in the Time Series Database.
If you haven't installed Prometheus on the cluster, refer to this blog.
Open the configuration file /etc/prometheus/prometheus.yaml
sudo vim /etc/prometheus/prometheus.ymlUnder the scrape_configs add a new job
- job_name: "jmx-exporter"
    static_configs:
    - targets: ["<Public_IP>:9093"]
Provide the Public IP address of the server where your JMX Exporter is and the Port number of the JMX Exporter 9093.
Once the configuration is completed, restart the Prometheus service and view the status to ensure the configurations are properly applied.
sudo systemctl restart prometheus.service
sudo systemctl status prometheus.service
First, we will list the Prometheus targets.
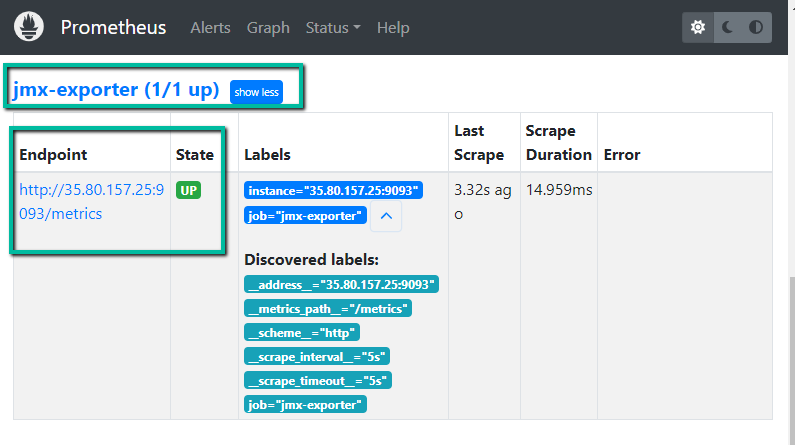
This ensures that the Prometheus can access the JMX Exporter endpoint and the state of the Exporter.
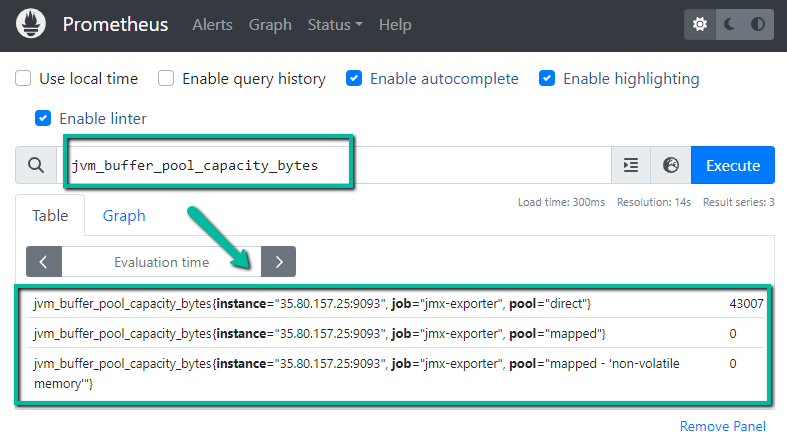
Let's make a query from the Prometheus and see the results.
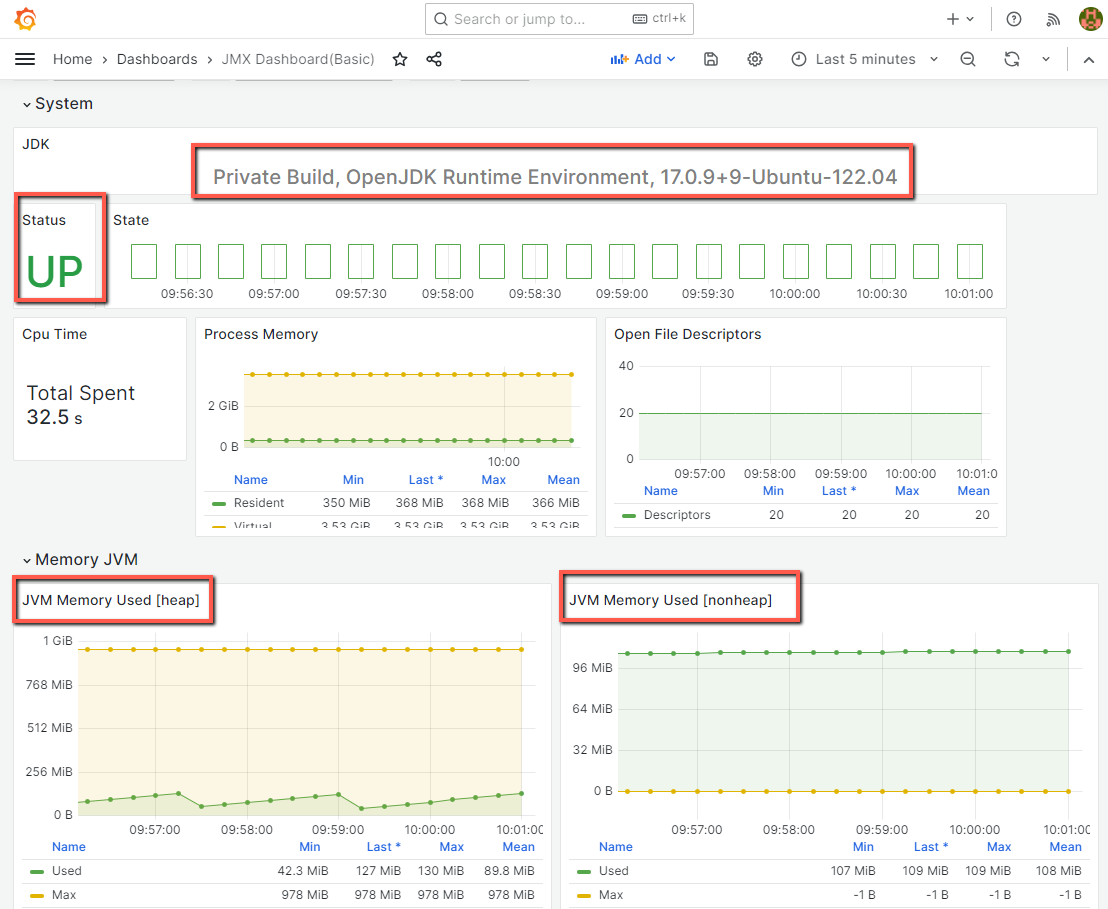
We can see the visual representation for our query result, using the Grafana.
To install Grafana on your Virtual Machine, refer to this blog.
Conclusion
I have covered all the steps to instrument a Java application using Prometheus JMX exporter and run on a Linux server.
If you are using Kubernetes, you can try implement the JMX Exporter in the Kubernetes cluster to monitor the Java application running in Kubernetes Pod .
If you face any issues or need clarification on the setup, please drop a comment below. I will help you out.
