

Infrastructure and application code have version control, but Grafana dashboards often don’t. They get edited directly in production without proper tracking.
Git Sync in Grafana v12 (experimental) enables version control for dashboards while keeping the familiar UI-based editing.
By the end of this blog, you will,
- Understand why Grafana dashboards need proper version control.
- Learn how Git Sync in Grafana v12 solves this problem without losing the familiar UI.
- Set up Git Sync step by step with Docker and GitHub.
- See how bidirectional sync works in practice.
- Know the current limitations and when you should and shouldn’t use it.
The Pain of Managing Grafana Dashboards
If you have worked with Grafana long enough, you have probably faced this.
- A production dashboard suddenly looks different.
- Someone adjusted a threshold that now floods the alert channel.
- Another person deleted a panel they thought was redundant.
The dashboard that took weeks to perfect is now… different. Nobody knows who changed what, when, or why.
Traditional solutions sucked. Here is why.
- If you use Terraform, you get dashboards as code, so you have version control (you can track every change). But you lose the Grafana visual editor.
- If you stick with the Grafana UI editor, you keep the visual editing experience, but you dont have proper version control. You cant easily track who changed what, when, or why.
- If you use backup scripts, you can save copies of dashboards at different times, but thats only like taking snapshots. It is not true version control.
Git Sync eliminates this false choice.
With Git Sync, you can tread your dashboards the same as your infrastructure and application code without giving up the Grafana experience.
What is Git Sync?
Git Sync creates a bidirectional bridge between your Grafana instance and a GitHub repository. Meaning, if you edit a dashboard in Grafana’s UI, it commits to Git. If you update the dashboard JSON in GitHub, it reflects in Grafana.
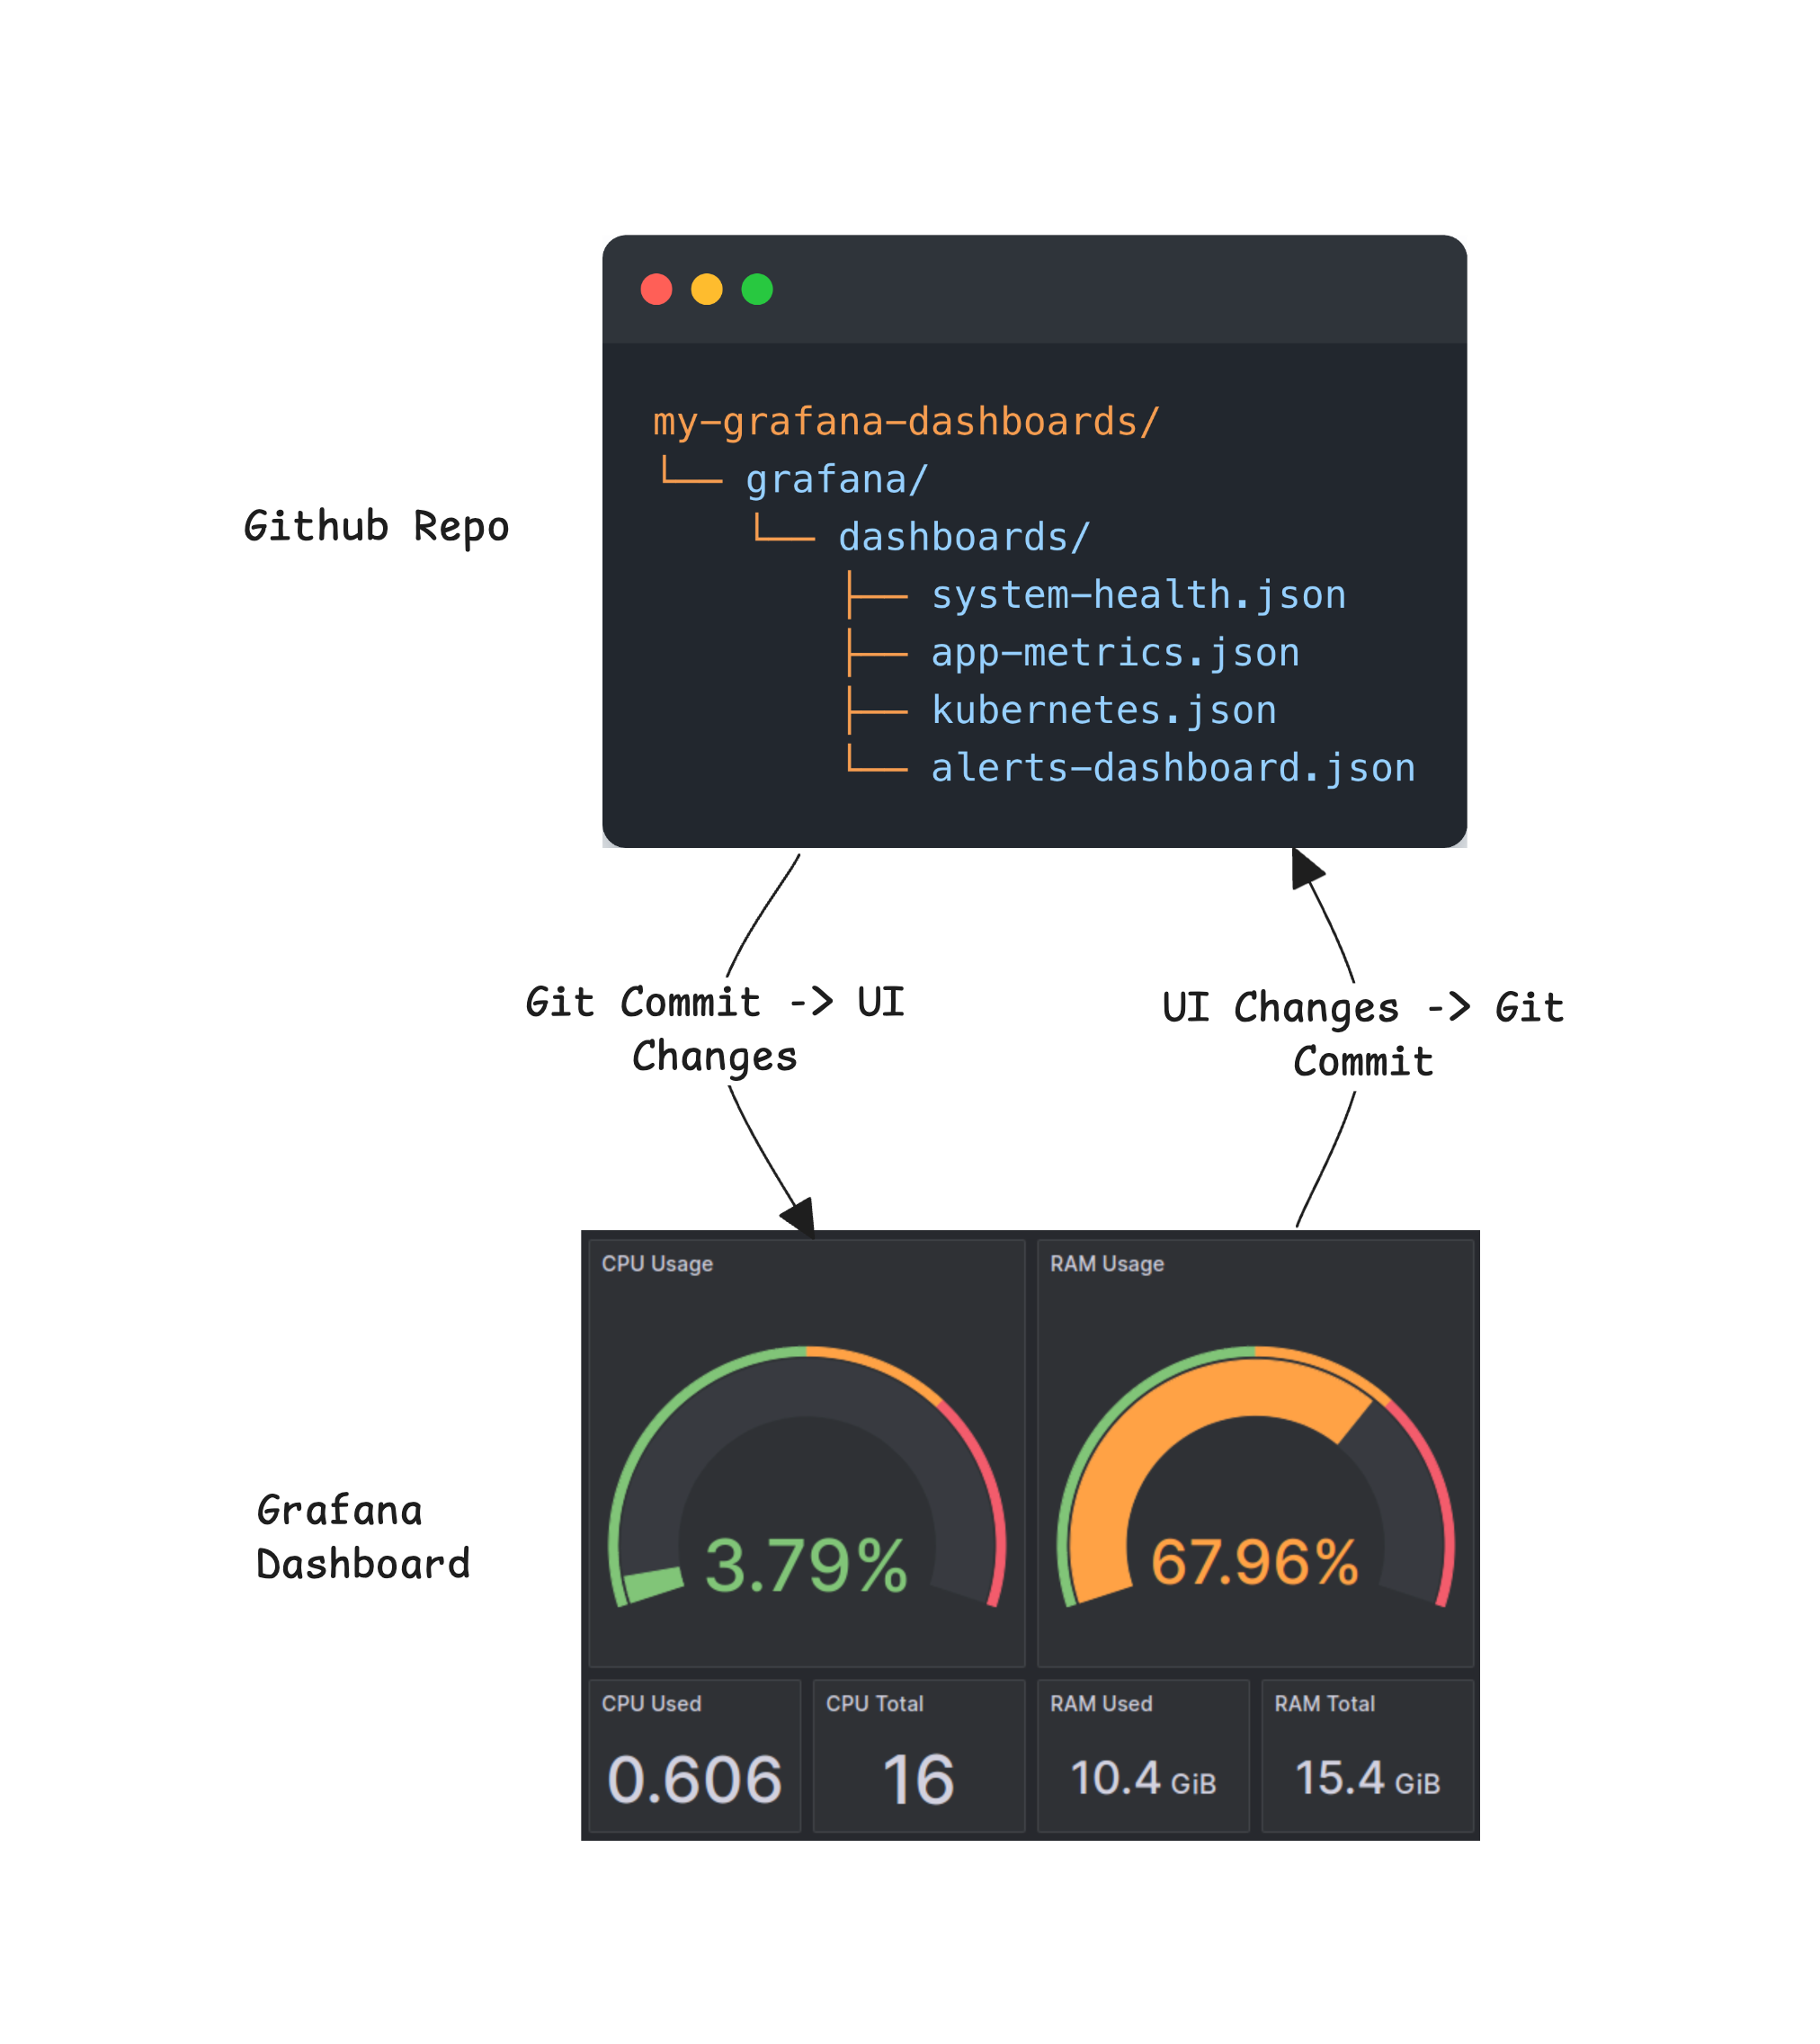
The synchronisation happens automatically. Each dashboard becomes a JSON file in your repository. Your entire team can collaborate on dashboards just like they collaborate on code - with branches, pull requests, and reviews.
Prerequisites
The following are the requisites to get test it practically.
- Docker(
curl [<https://get.docker.com) - Empty GitHub Repo and a Personal Access Token
Lets get started with the setup.
Step 1: Set Up Grafana and Prometheus with Docker
Save this as docker-compose.yml
services:
  grafana:
    image: grafana/grafana:12.2.0-16979757807 # Nightly Build
    ports:
      - 3000:3000
    environment:
      - GF_FEATURE_TOGGLES_ENABLE=provisioning,kubernetesDashboards
  prometheus:
    image: prom/prometheus
    ports:
      - 9090:9090
    entrypoint: /bin/sh
    command:
      - -c
      - |
        cat > /etc/prometheus/prometheus.yml <<EOF
        scrape_configs:
          - job_name: node-exporter
            static_configs:
              - targets: ["node-exporter:9100"]
        EOF
        prometheus --config.file=/etc/prometheus/prometheus.yml
  node-exporter:
    image: prom/node-exporter
    ports:
      - 9100:9100
    volumes:
      - /proc:/host/proc:ro
      - /sys:/host/sys:ro
    command: --path.procfs=/host/proc --path.sysfs=/host/sys
Run docker compose up -d and navigate to http://localhost:3000.
Log in with admin/admin.
Add Prometheus as a Data Source: Connections → Data Sources → Add data source → Prometheus. Set URL to http://prometheus:9090 and save.
Step 2: Configure Git Sync with GitHub
Start by creating a new GitHub repository(add a README)
Create a GitHub Personal Access Token:
- GitHub → Settings → Developer settings → Personal access tokens → Fine-grained tokens
- Select your Repository
- Generate token with these permissions:
- Contents: Read and Write
- Metadata: Read
- Pull requests: Read and Write
- Webhooks: Read and Write
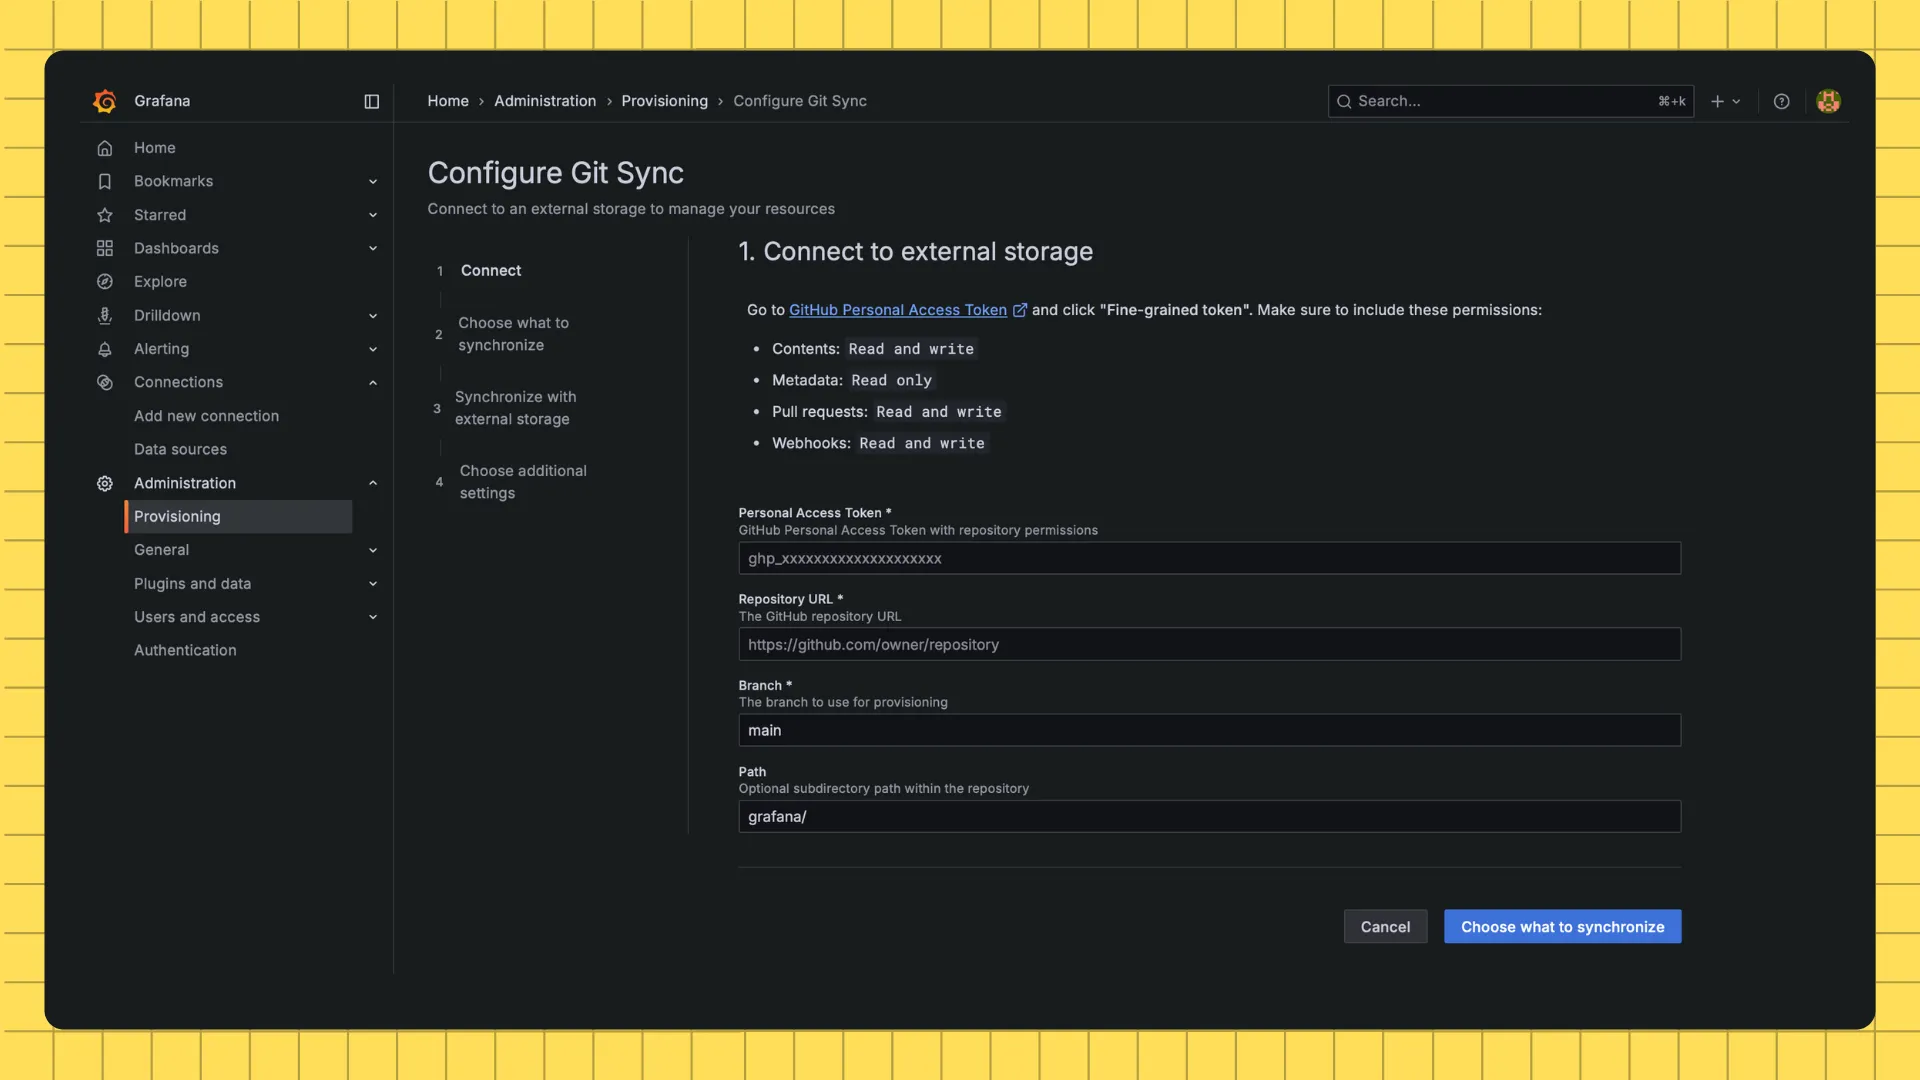
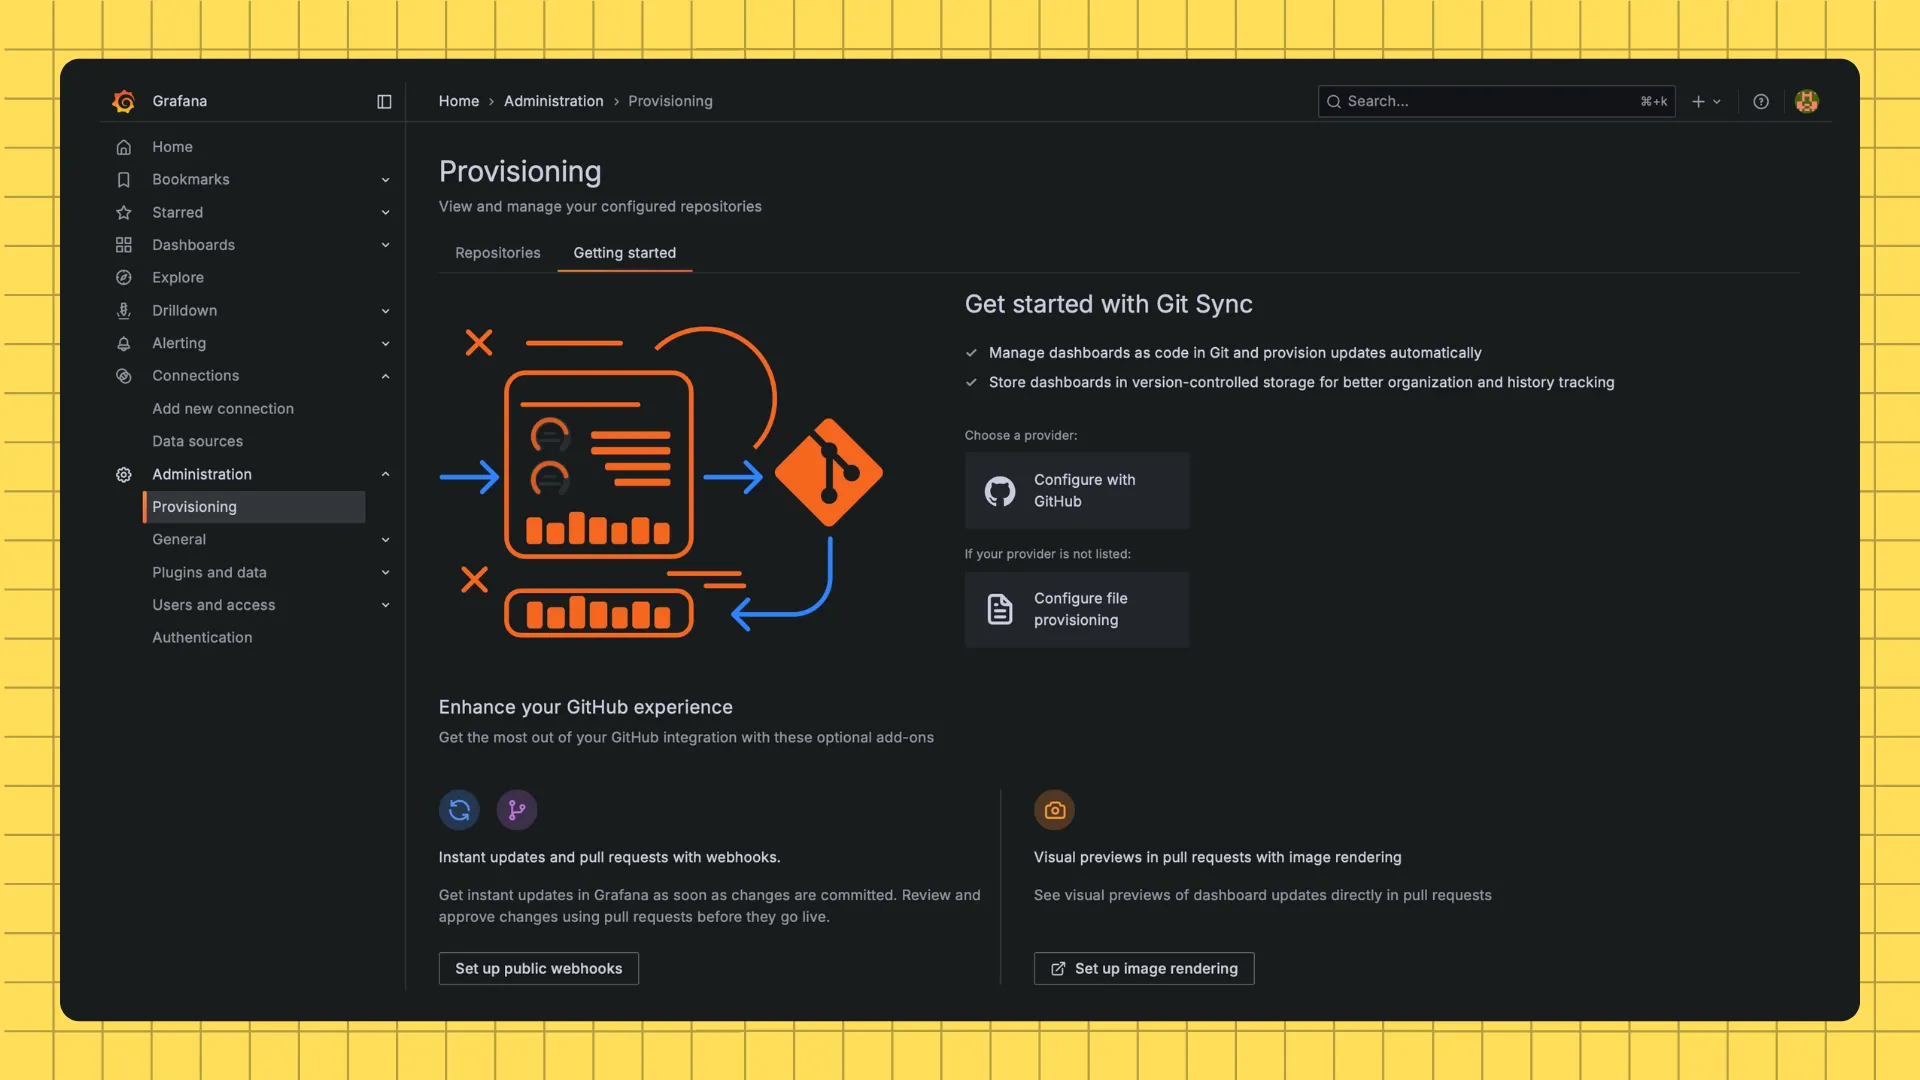
In Grafana, navigate to Administration → Provisioning → GitHub. Fill with required data:
- In connect section fill
- Personal Access Token
- Repository URL
- Branch
- Choose what to synchronise section:
- Choose: Sync all resources with external storage
Step 3: Create and Sync Your First Dashboard
Lets create dashboard and add some panels:
- In Dashboard Section
- Choose Add visualisation
- Select Prometheus as Data Source
- Let’s Add a panels
- Memory Usage (Gauge):
(1 - (node_memory_MemAvailable_bytes / node_memory_MemTotal_bytes)) * 100 - Click Run queries
- Memory Usage (Gauge):
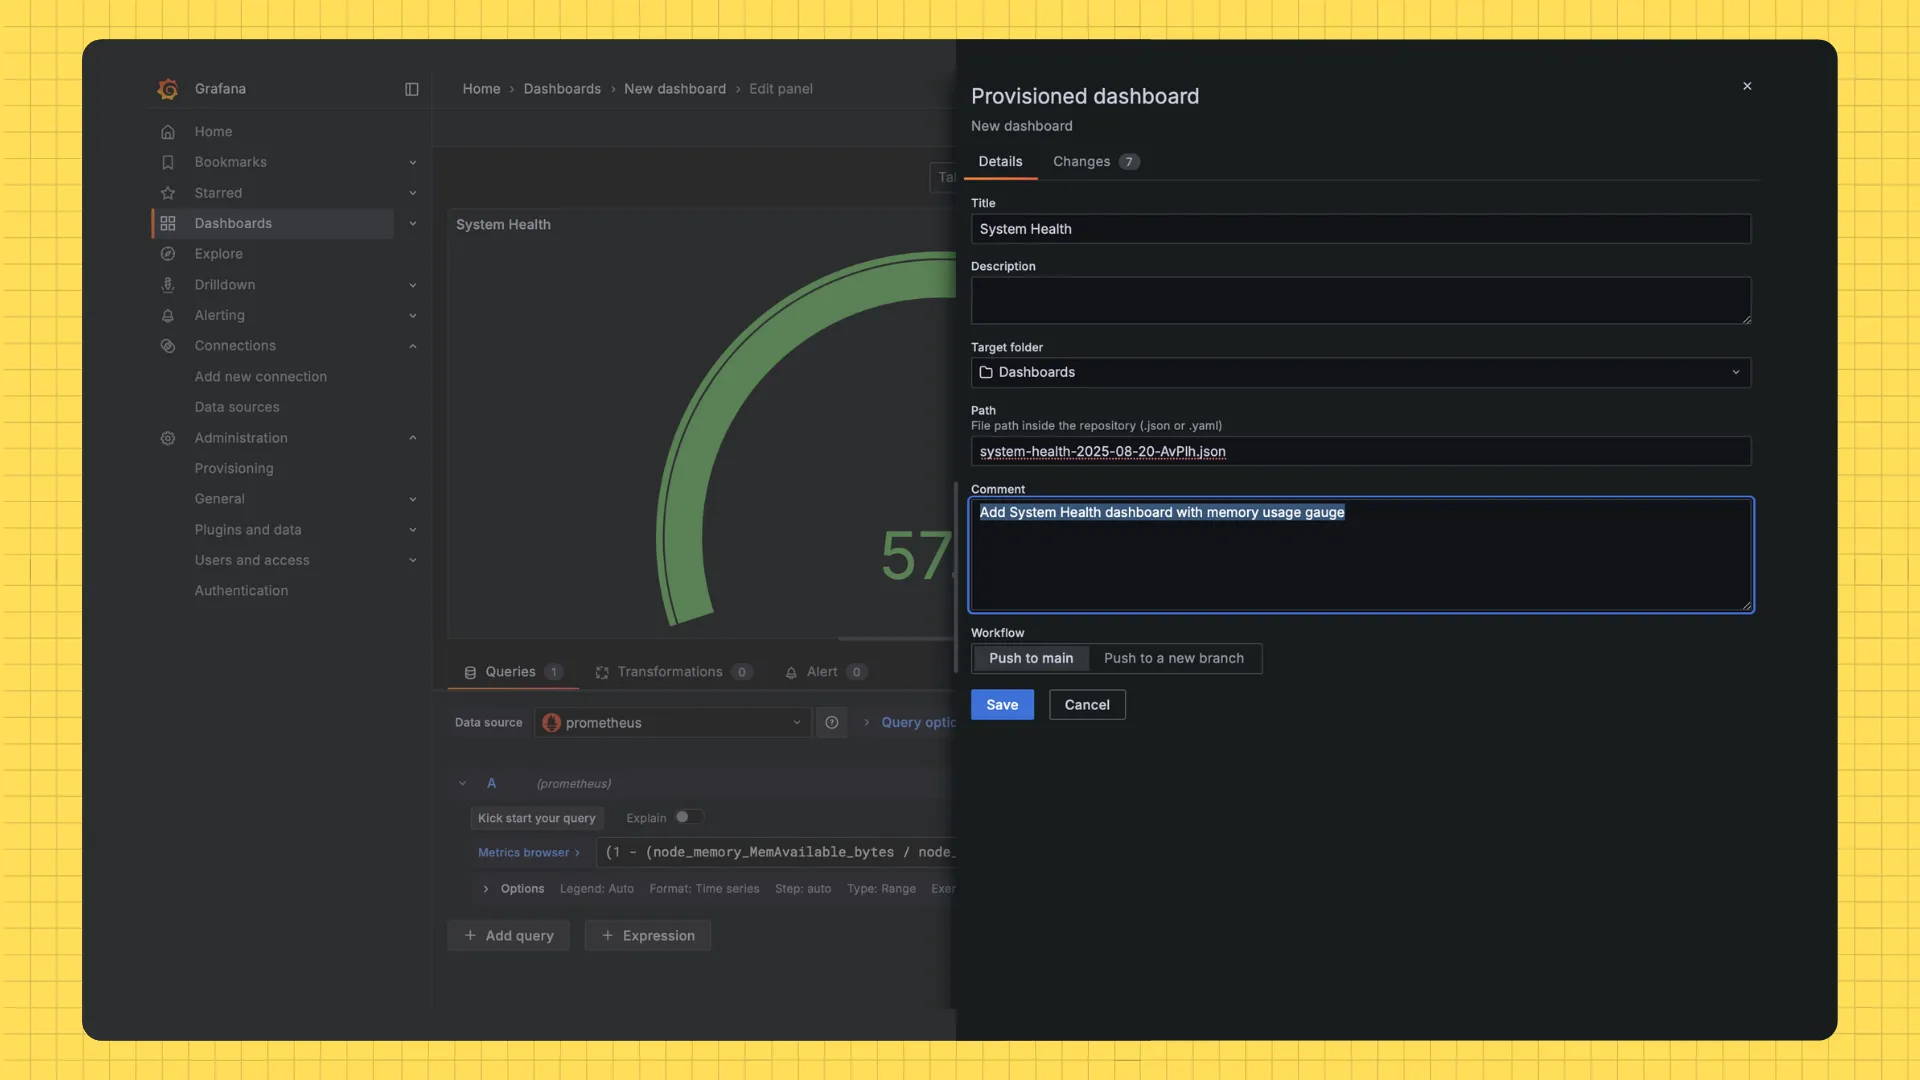
- Save Dashboard, Grafana commits this to GitHub
- Add a Dashboard name in the title
- You can also name the
.json - Comment will the GitHub Commit Message(
Add System Health dashboard with memory usage gauge) - You can also push to a new branch
Check your GitHub repository. You will find a json file in Grafana folder of GitHub Repository. Your dashboard is now version controlled.
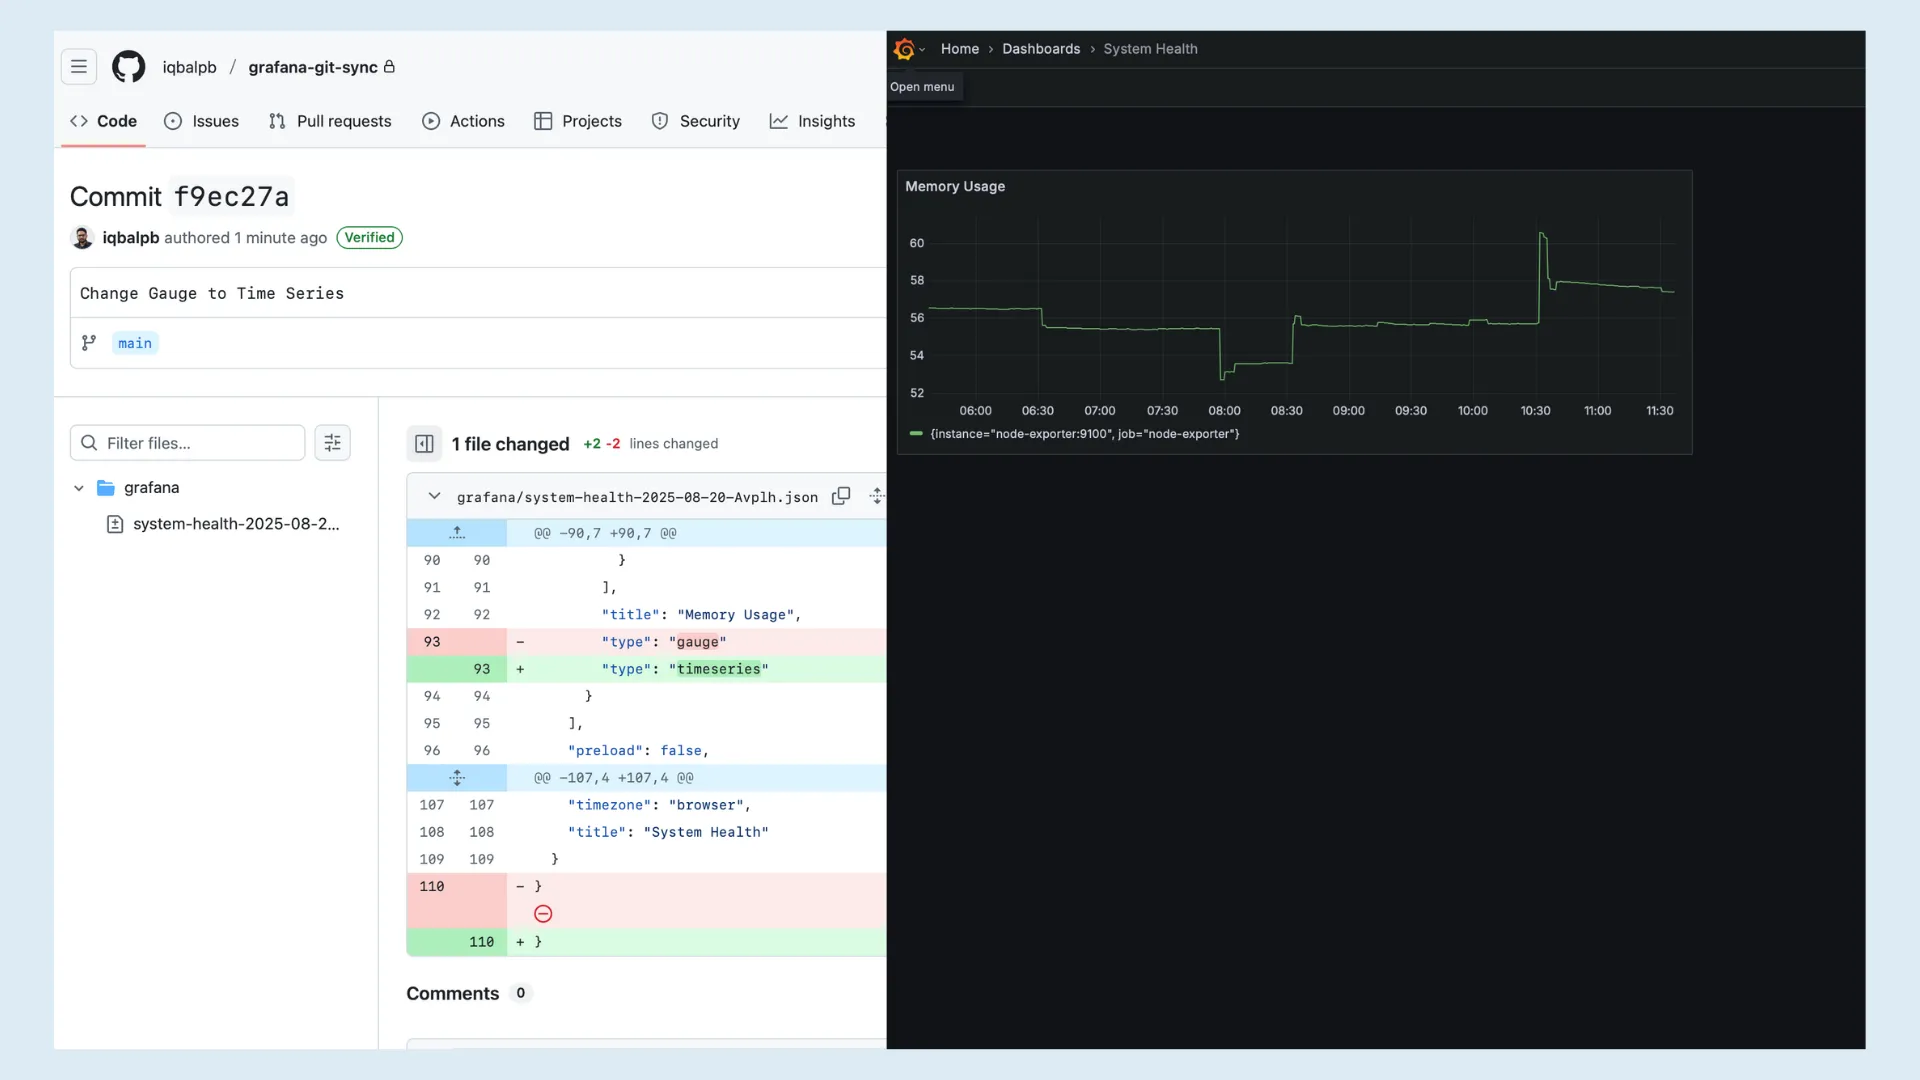
Step 4: Test Bidirectional Sync
To test bidirectional sync, we are going to edit the Memory Usage panel, switch the visualization from Gauge to Time Series, and save it with the commit message: Change Gauge to Time Series
Step 5: Fix Mistakes Using Git History
Made a mistake? No problem.
In GitHub, view the commit history for your dashboard file. Find the commit and click “Revert”. GitHub creates a new commit restoring the previous state. You know exactly who broke what and when.
Current known Limitations
Following are the current limitations of Git Sync.
- Only GitHub.com supported
- Deleted dashboards in UI don’t delete from Git (by design, for safety)
- Large repositories with 200+ dashboards may experience delays
- Alert rules and data sources are not synced yet.
When to Use Git Sync?
Here is when using git Sync makes sense.
- You want version control but Terraform feels like overkill
- If you need audit trails (to see who changed what and when), Git Sync helps with compliance and accountability.
- When multiple engineers are editing the same dashboards, and you want to avoid conflicts or confusion.
- You need actual rollback, not Grafana’s basic versioning
- Your team already does GitOps for everything else, Git Sync fits perfectly into that workflow.
What’s Next?
The goal for Git Sync is production-ready status with complete observability as code capabilities. The roadmap includes syncing alert rules and data sources alongside dashboards.
Your dashboards are as critical as your application code. They deserve the same version control, review processes, and rollback capabilities. Git Sync makes this possible without forcing you to abandon the UI that makes Grafana powerful.
Git Sync is experimental, but it works. Connect your repo, save a dashboard, watch it appear in GitHub. Your dashboards finally get proper version control.
When someone breaks that critical CPU panel at 3am, you will have the commit hash and the culprit’s name.