If you want to know how the Kubernetes nodes perform or monitor system-level insights of kubernetes nodes, you need to set up a Prometheus node exporter on Kubernetes cluster.
This guide will walk you through the node-exporter setup on a Kubernetes cluster and integrate Prometheus scrape config to scrape the node metrics.
It is also an important topics in the Prometheus Certified Associate Certification.
What is Prometheus Node Exporter?
Node exporter is an official Prometheus exporter for capturing all the Linux system-related metrics.
It collects all the hardware and Operating System level metrics that are exposed by the kernel.
You can use the node exporter to collect the system metrics from all your Linux systems. Check this article on node monitoring using node-exporter.
Why do we need Node Exporter on Kubernetes?
By default, most of the Kubernetes clusters expose the metric server metrics (Cluster level metrics from the summary API) and Cadvisor (Container level metrics). It does not provide detailed node-level metrics.
To get all the kubernetes node-level system metrics, you need to have a node-exporter running in all the kubernetes nodes. It collects all the Linux system metrics and exposes them via /metrics endpoint on port 9100
Similarly, you need to install Kube state metrics to get all the metrics related to kubernetes objects.
Kubernetes Manifests
The Kubernetes manifest used in this guide is present in the Github repository. Clone the repo to your local system.
git clone https://github.com/bibinwilson/kubernetes-node-exporterSetup Node Exporter on Kubernetes
Here is what we are going to do.
- Deploy node exporter on all the Kubernetes nodes as a
daemonset. Daemonset makes sure one instance of node-exporter is running in all the nodes. It exposes all the node metrics on port9100on the/metricsendpoint - Create a service that listens on port
9100and points to all the daemonset node exporter pods. We would be monitoring the service endpoints (Node exporter pods) from Prometheus using the endpoint job config. More explanation on this in the Prometheus config part.
Lest get started with the setup.
Step 1: Create a file name daemonset.yaml and copy the following content.
apiVersion: apps/v1
kind: DaemonSet
metadata:
  labels:
    app.kubernetes.io/component: exporter
    app.kubernetes.io/name: node-exporter
  name: node-exporter
  namespace: monitoring
spec:
  selector:
    matchLabels:
      app.kubernetes.io/component: exporter
      app.kubernetes.io/name: node-exporter
  template:
    metadata:
      labels:
        app.kubernetes.io/component: exporter
        app.kubernetes.io/name: node-exporter
    spec:
      containers:
      - args:
        - --path.sysfs=/host/sys
        - --path.rootfs=/host/root
        - --no-collector.wifi
        - --no-collector.hwmon
        - --collector.filesystem.ignored-mount-points=^/(dev|proc|sys|var/lib/docker/.+|var/lib/kubelet/pods/.+)($|/)
        - --collector.netclass.ignored-devices=^(veth.*)$
        name: node-exporter
        image: prom/node-exporter
        ports:
          - containerPort: 9100
            protocol: TCP
        resources:
          limits:
            cpu: 250m
            memory: 180Mi
          requests:
            cpu: 102m
            memory: 180Mi
        volumeMounts:
        - mountPath: /host/sys
          mountPropagation: HostToContainer
          name: sys
          readOnly: true
        - mountPath: /host/root
          mountPropagation: HostToContainer
          name: root
          readOnly: true
      volumes:
      - hostPath:
          path: /sys
        name: sys
      - hostPath:
          path: /
        name: root
Step 2: Deploy the daemonset using the kubectl command.
kubectl create -f daemonset.yamlStep 3: List the daemonset in the monitoring namespace and make sure it is in the available state.
kubectl get daemonset -n monitoringStep 4: Create a file names service.yaml and copy the following contents.
---
kind: Service
apiVersion: v1
metadata:
  name: node-exporter
  namespace: monitoring
  annotations:
      prometheus.io/scrape: 'true'
      prometheus.io/port:   '9100'
spec:
  selector:
      app.kubernetes.io/component: exporter
      app.kubernetes.io/name: node-exporter
  ports:
  - name: node-exporter
    protocol: TCP
    port: 9100
    targetPort: 9100
Step 5: Create the service.
kubectl create -f service.yamlStep 6: Now, check the service's endpoints and see if it is pointing to all the daemonset pods.
kubectl get endpoints -n monitoring 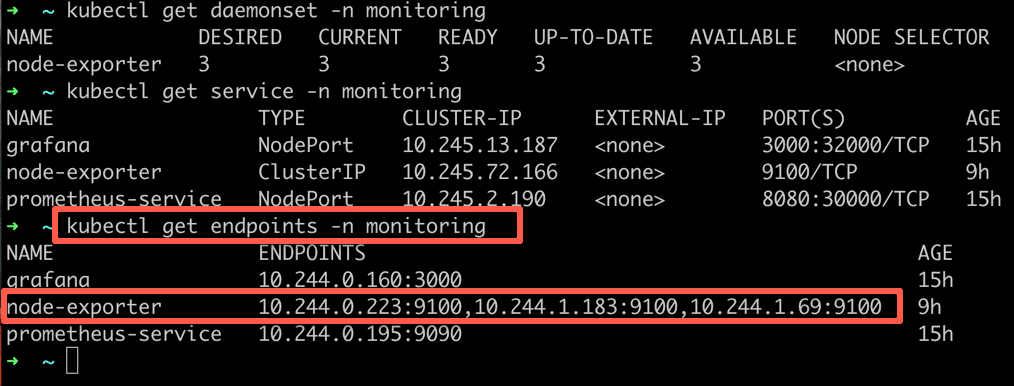
As you can see from the above output, the node-exporter service has three endpoints. Meaning three node-exporter pods running on three nodes as part of Daemonset.
Node-exporter Prometheus Config
We have the node-exporter daemonset running on port 9100 and a service pointing to all the node-exporter pods.
You need to add a scrape config to the Prometheus config file to discover all the node-exporter pods.
Let's take a look at the Prometheus scrape config required to scrape the node-exporter metrics.
      - job_name: 'node-exporter'
        kubernetes_sd_configs:
          - role: endpoints
        relabel_configs:
        - source_labels: [__meta_kubernetes_endpoints_name]
          regex: 'node-exporter'
          action: keep
In this config, we mention the role as endpoints to scrape the endpoints with the name node-exporter.
See Prometheus config map file I have created for the Kubernetes monitoring stack. It includes all the scrape configs for kubernetes components.
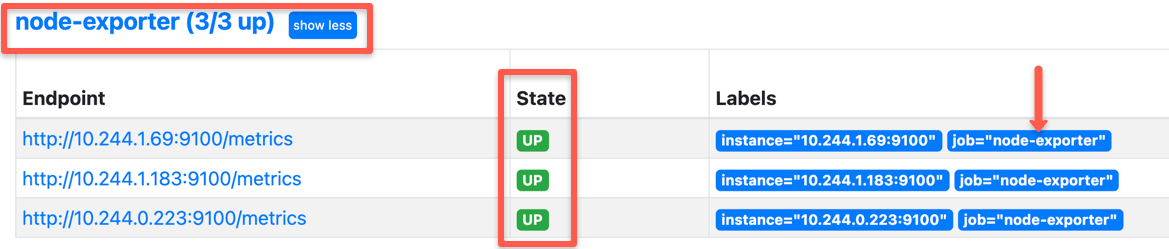
Once you add the scrape config to Prometheus, you will see the node-exporter targets in Prometheus, as shown below.
Querying Node-exporter Metrics in Prometheus
Once you verify the node-exporter target state in Prometheus, you can query the Prometheus dashboard's available node-exporter metrics.
All the metrics from node-exporter is prefixed with node_
You can query the metrics with different PromQL expressions. See querying basics to learn about PromQL queries.
If you type node_ in the Prometheus dashboard, it will list all the available metrics as shown below.
Visualizing Prometheus Node Exporter Metrics as Grafana Dashboards
Visualising the node exporter metrics on Grafana is not difficult as you think.
A community Grafana node exporter dashboard template has a predefined dashboard with all the supported node exporter metrics.
You can modify the template as per your project requirements.
If you don't know how to import a community template, please check my Grafana Prometheus integration article, where I have added the steps to import community dashboard templates.
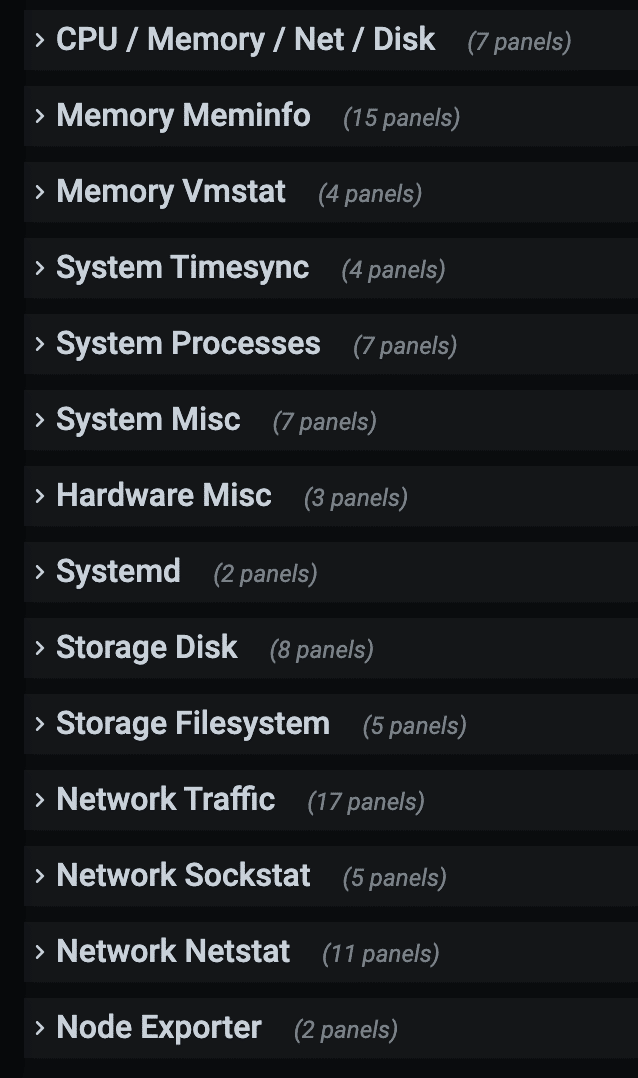
So here is how the node-exporter Grafana dashboard looks for CPU/memory and disk statistics.
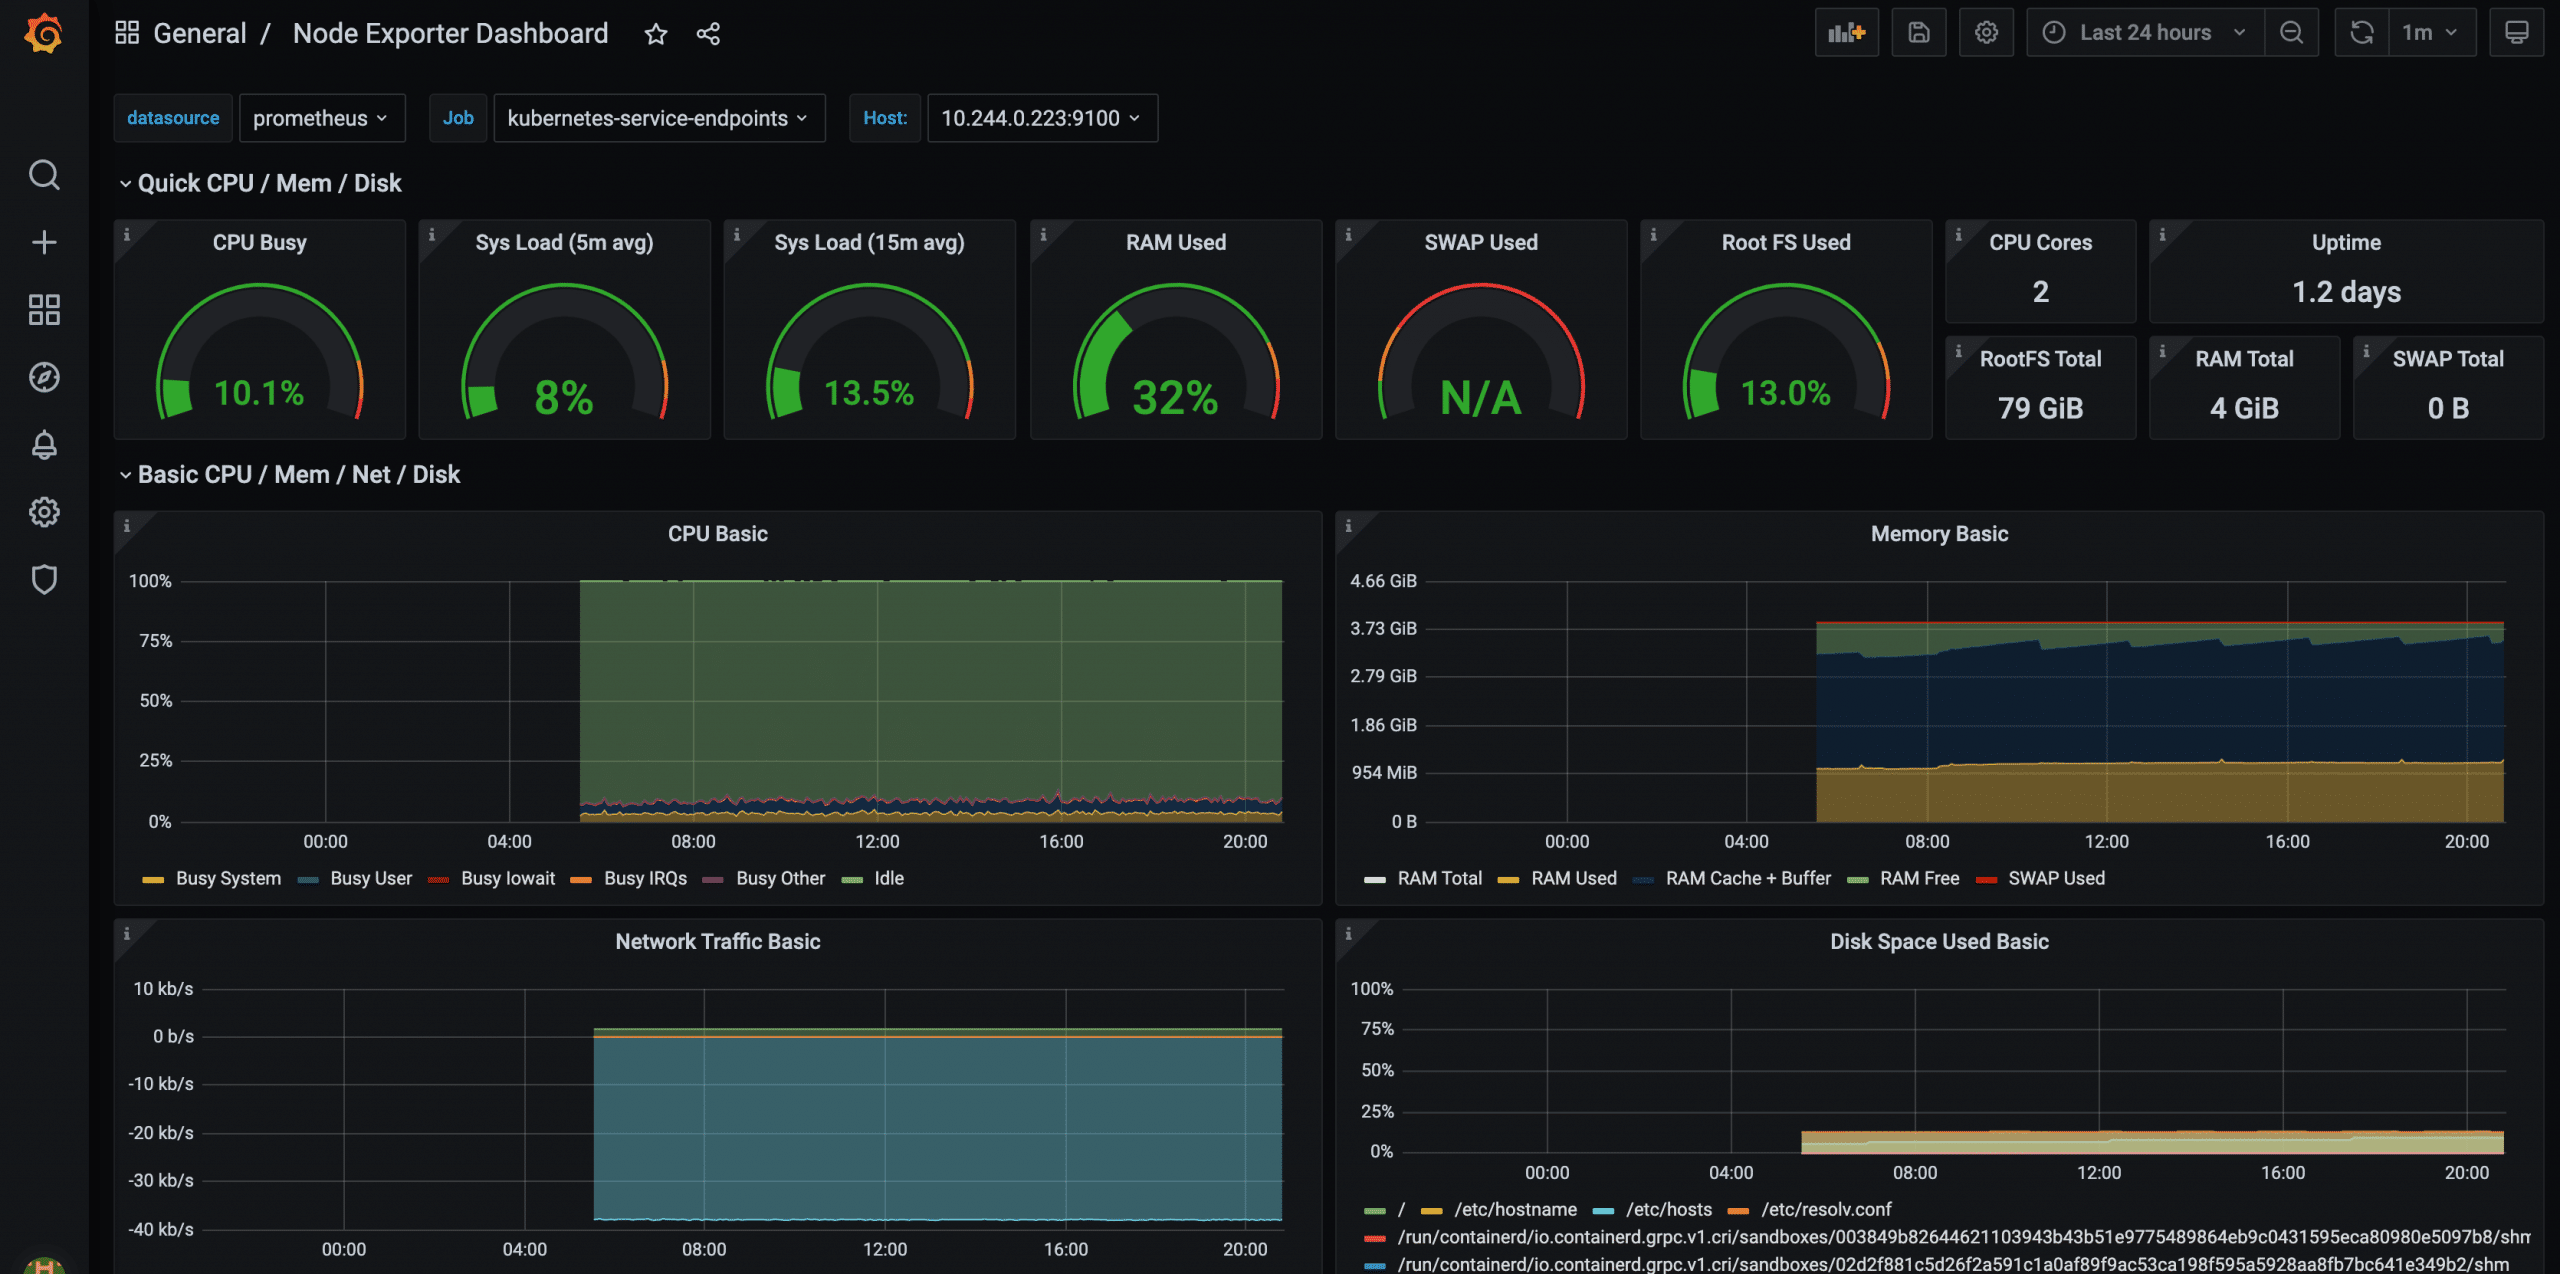
Once you have the dashboard, you will find the following sections. If you expand it, you will find all the metrics panel.