

In this blog, we are going to look at the installation and configuration of the Prometheus Pushgateway on a Linux VM based prometheus setup.
Note: For Kubernetes based promtheus, refer Pushgateway on Kubernetes blog.
Pushgateway Workflow
Assume that you have some short-lived jobs or batch jobs, Prometheus sometimes can't scrape the metrics of that particular job due to the scrape interval settings. In such cases, we can use Pushgateway.
The jobs short-lived jobs themselves push the metrics to the Pushgateway and will hold for a certain period. From the Pushgateway server, Prometheus will pull the metrics. So it is like a temporary hub to store the metrics so that prometheus wont miss it.
The following image shows the Pushgateway workflow in detail.
Here is how it works.
- First, we have to instrument our short lived jobs or tasks to send metrics to the Pushgateway over HTTP.
- When the task executes, the metrics will be sent to the Pushgateway.
- Prometheus will periodically pull the metrics from the Pushgateway and store them in the Time Series Database.
- Finally, we can make PromQL queries from Prometheus or other tools like Grafana, to see the information.
Note: The Pushgateway will store the metrics in its temporary storage section. So when the new metrics comes in, the old ones will be deleted.
Prometheus Pushgateway on Virtual Machine
In this setup, I am using two EC2 instances
- First instance has a running prometheus server
- In the second instance I am going to configure the Pushgateway as a standalone setup.
Step 1: Install Prometheus Pushgateway
The first step is to download the Prometheus Pushgateway binaries from the official repository. Here we are using the latest version of the Pushgateway, which is v1.6.2.
wget https://github.com/prometheus/pushgateway/releases/download/v1.6.2/pushgateway-1.6.2.linux-amd64.tar.gzUnzip the tar file
tar xvf pushgateway-1.6.2.linux-amd64.tar.gzChange the directory name to pushgateway and enter it into the directory.
mv pushgateway-1.6.2.linux-amd64 pushgateway
cd pushgateway/
Create a user for Pushgateway.
sudo useradd -rs /bin/false pushgatewayCopy the pushgateway directory to the /usr/local/bin directory.
sudo cp pushgateway /usr/local/bin/Give permission only for pushgateway users to that particular directory.
sudo chown pushgateway:pushgateway /usr/local/bin/pushgatewayCreate a service file for Pushgateway.
sudo cat <<EOT > /etc/systemd/system/pushgateway.service
[Unit]
Description=Prometheus Pushgateway
Wants=network-online.target
After=network-online.target

[Service]
User=pushgateway
Group=pushgateway
Type=simple
ExecStart=/usr/local/bin/pushgateway

[Install]
WantedBy=multi-user.target
EOT
Start and enable the Pushgateway service.
sudo systemctl enable pushgateway
sudo systemctl start pushgateway
Check the status and ensure configurations are properly done.
sudo systemctl status pushgatewayTo see the collected metrics from the local system, use the following command. The default Port number of the Prometheus Pushgateway is 9091.
curl localhost:9091/metricsIf you want to see the Pushgateway dashboard over the internet, use the Public IP of the server with the Port number.
The output you will see is this.
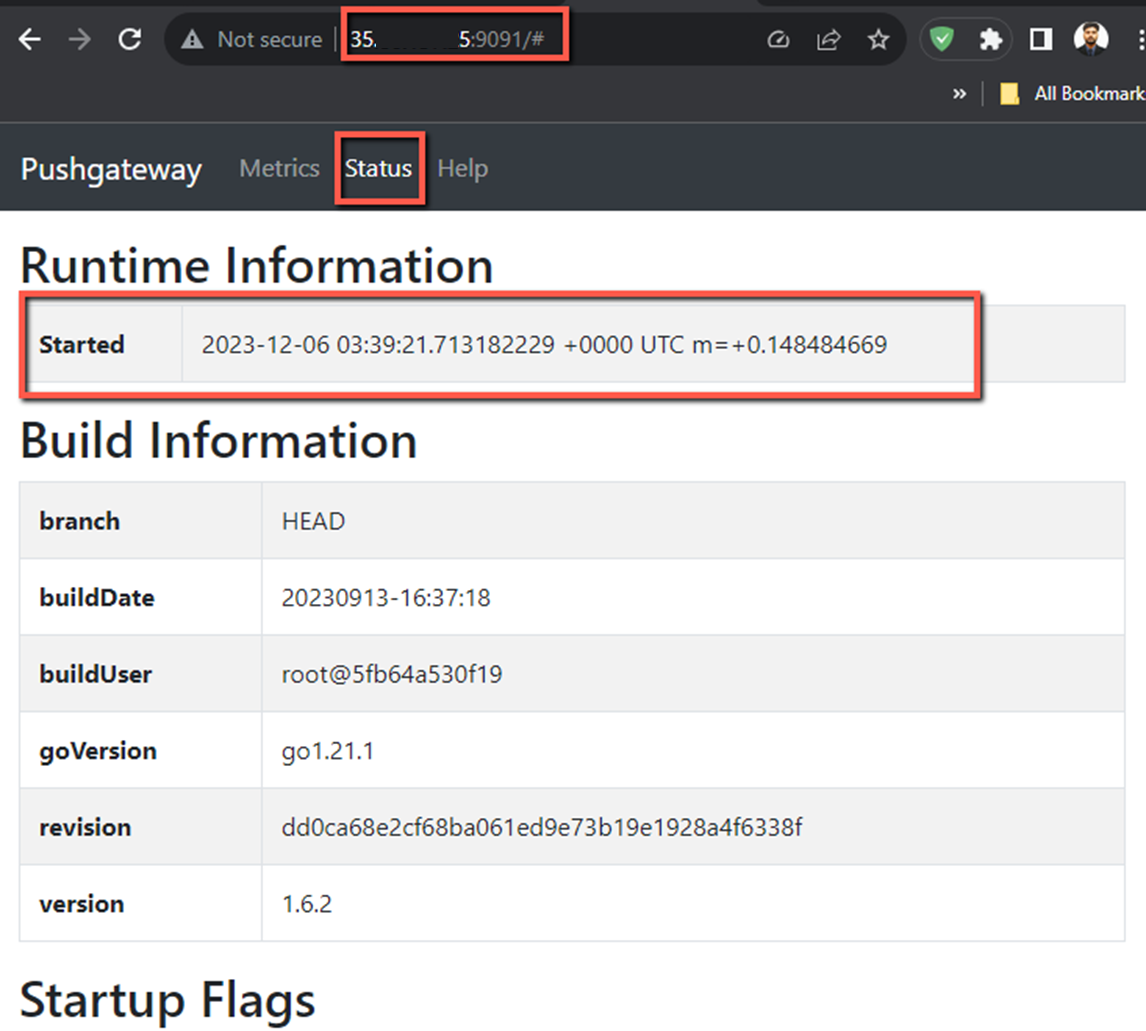
Now, you can't see any information in the Metrics tab, we have to configure it from the application or server to push the metrics, and then only it is visible to our Pushgateway dashboard.
But before that, we have to configure the Prometheus to pull the metrics from the Pushgateway, then only we can make queries and visualize the metrics.
Step 2: Configure a Job on Prometheus
The following configuration has be to done on the prometheus server.
In the Prometheus configuration file /etc/prometheus/prometheus.yml, you have to add a new scrape config for the pushgateway.
Open the configuration file.
sudo vim /etc/prometheus/prometheus.ymlAdd a job named Pushgateway in the configuration file as given below.
global:
  scrape_interval: 5s
  evaluation_interval: 5s

scrape_configs:
  - job_name: "pushgateway"
    honor_labels: true
    static_configs:
    - targets: [<Public IP>:9091]
Under the scrape_config section, you need to add a new job for Pushgateway.
Instead of scrape_configs.job_name: "pushgateway", you can give any name for your job, and the second parameter you can see is scrape_configs.honor_labels: true, which means, that when we push the metrics to the Pushgateway, the labels from the target will be preserved, not overwritten by the gateway instance labels.
The target parameter indicates the Public IP and the Port number of the Pushgateway server (Instance 02).
You can also give the private IP if both your servers are in the same network, or if you are using a single server for the Prometheus and the Pushgateway, then you can simply mention [localhost:9091].
Now, you have to restart the service and ensure the configuration is properly done by viewing the status of the service.
sudo systemctl restart prometheus.service
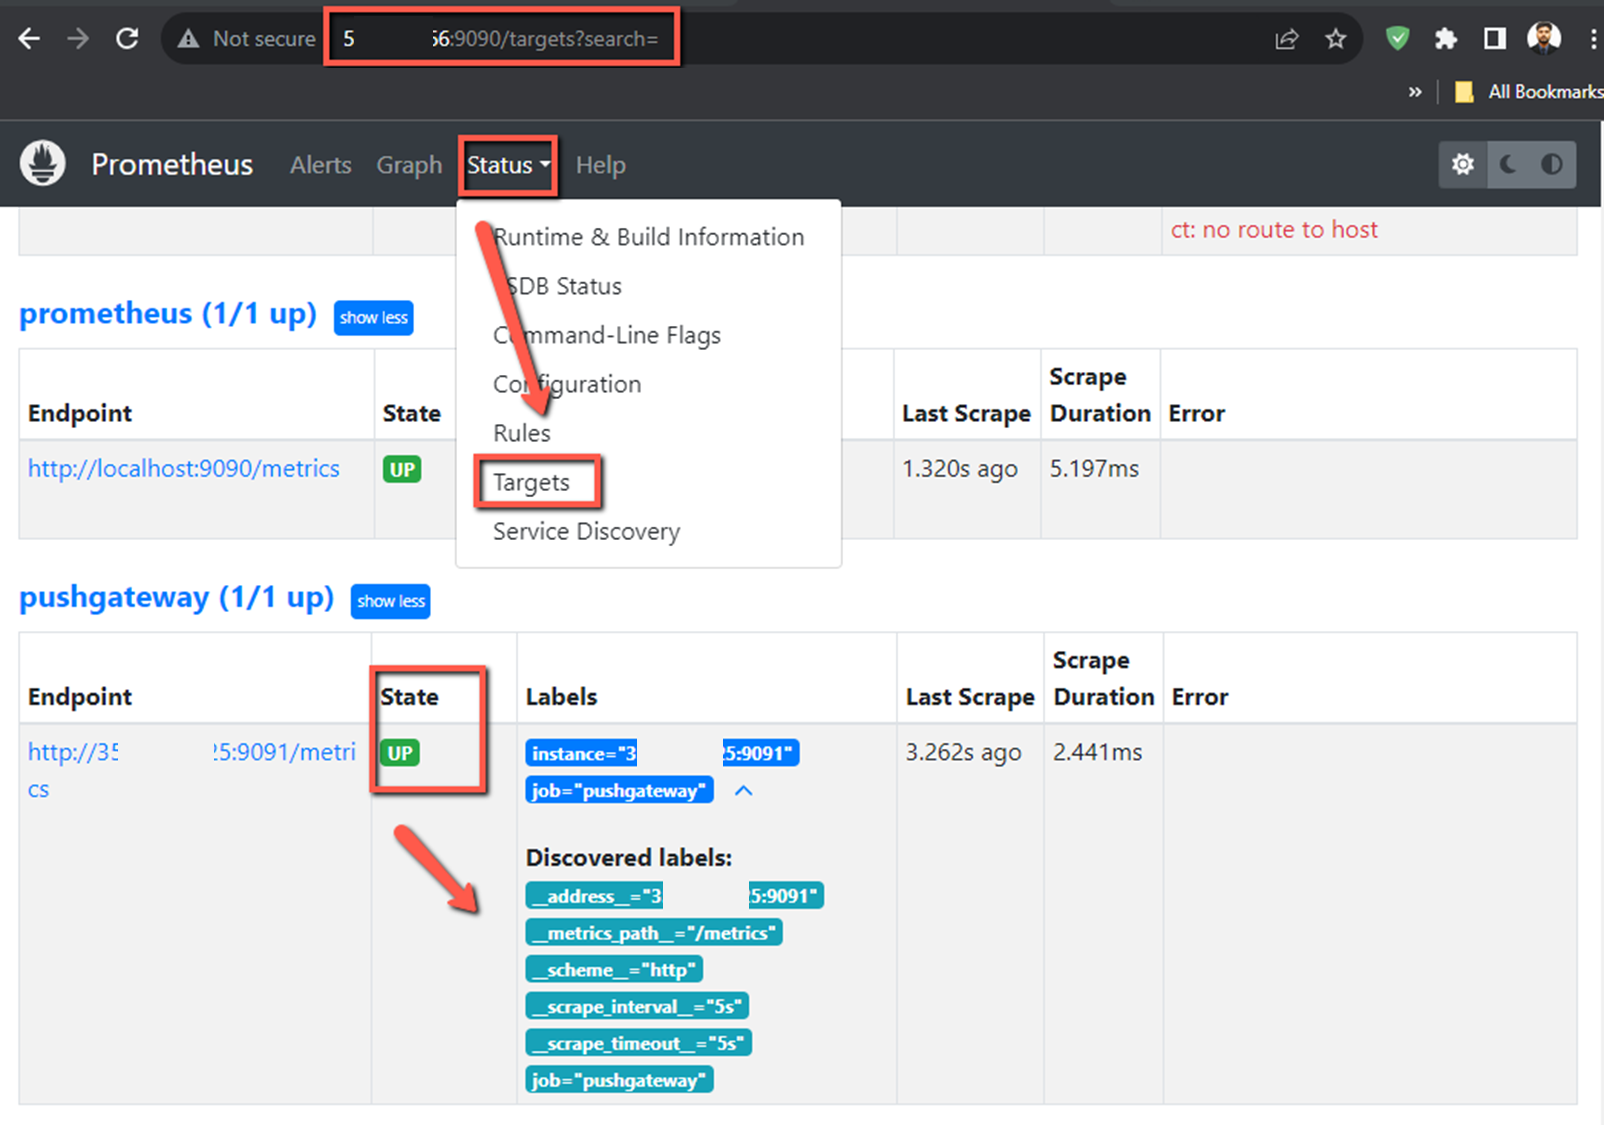
sudo systemctl status prometheus.serviceYou can also verify the job configuration from the Prometheus dashboard.
Step 3: Push Metrics to the Prometheus Pushgateway
For testing and validation purposes, we will use curl and python scripts to push the metrics to the Pushgateway and use Prometheus and Grafana to make queries and visualize the metrics.
Example 1:
Create a simple script to push certain metrics.
vim curl_push.shInside the file, add the below contents.
#!/bin/bash
cat <<EOF | curl --data-binary @- http://<pushgateway-address>:9091/metrics/job/batch_job
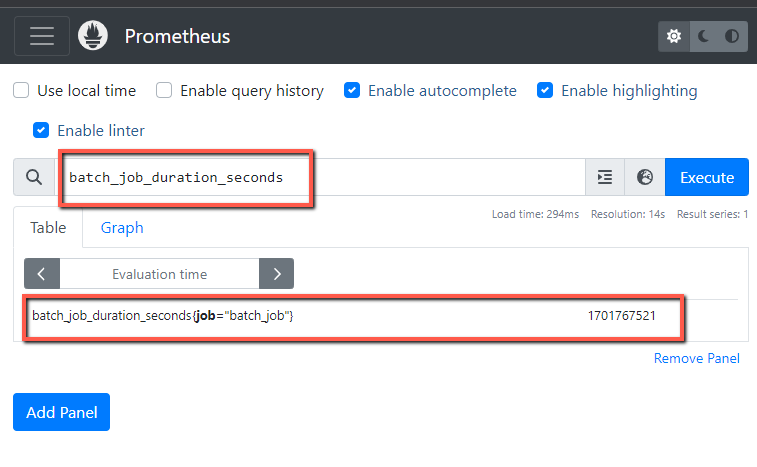
batch_job_duration_seconds $(date +%s)
EOF
Instead of <pushgateway-address>, provide the actual IP of the Pushgateway, this script will track the current time of the script execution in milliseconds and push the values to the Pushgateway, and batch_job_duration_seconds is the metric name.
After saving and quitting the script, give executable permission to this script.
chmod +x curl_push.shI am setting up this script with a cronjob so that it will run periodically.
Open the crontab.
crontab -eAdd a line at the end of the file
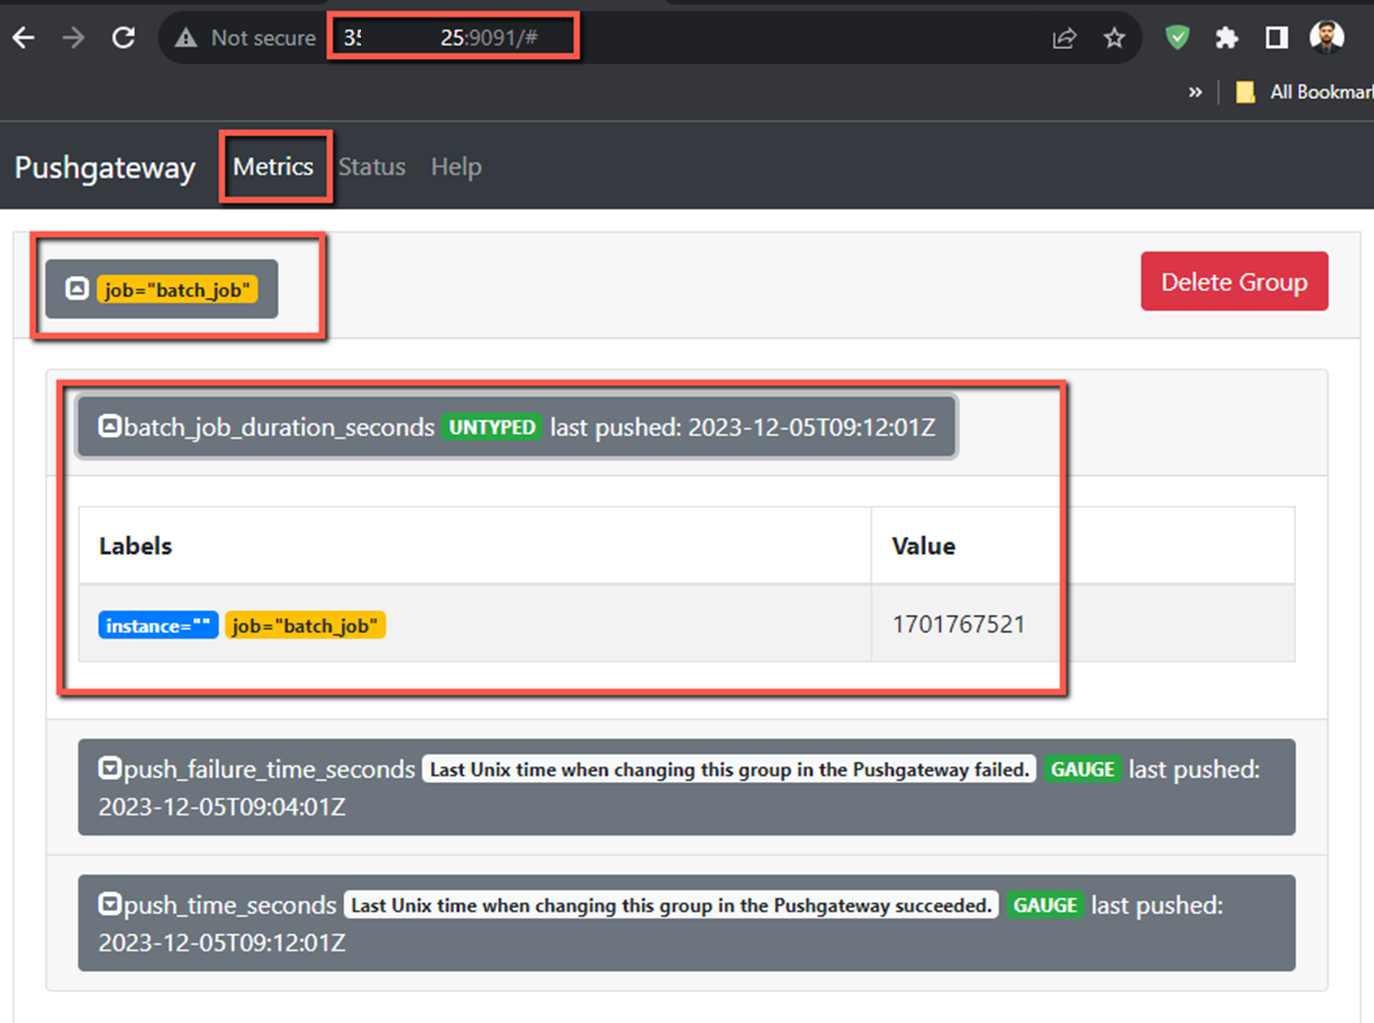
*/1 * * * * /bin/sh curl_push.shThen save and exit from the crontab, the script will automatically run every minute and push metrics to the Pushgateway.
Now, you can check the Pushgateway dashboard to see the metrics.
Let's try to make a query from Prometheus so that we can know, whether the Prometheus scrape configuration is properly working or not.
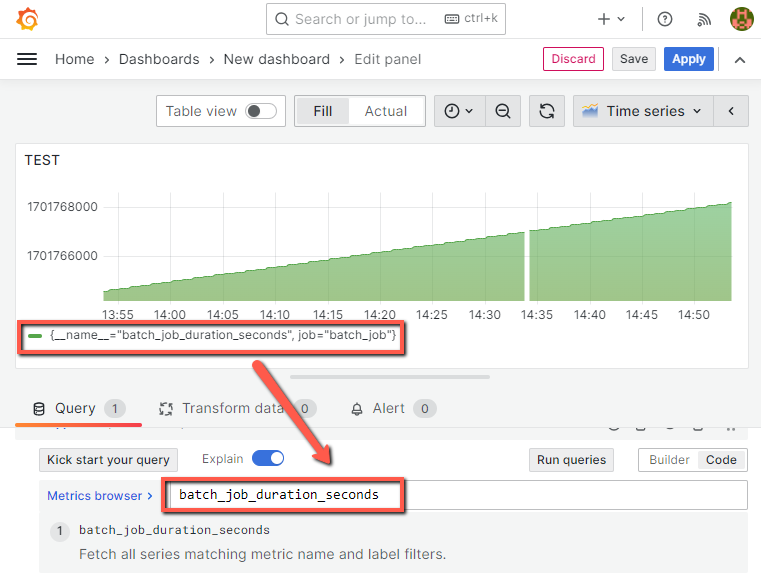
If you want to visualize this metric using Grafana, you will get a similar output, and if you want to know the installation of Grafana, refer to this blog.
I will show you one more example of pushing metrics to the Pushgateway using a Python script with Prometheus Client Libraries
Example 2:
If you have a Python application and you want to send the metrics to the Pushgateway, then this example would help you.
Make sure pip and Python or Python3 are available on your system, which is necessary to perform this example.
First, you need to install the Prometheus client library in your system.
pip install prometheus_clientNow, you have to integrate this library into the application or the script to push the metrics. this script will create some random values and push them to the Pushgateway.
To know more about the client libraries, please refer to the official documentation.
Create a file with .py as an extension.
vim python_script.pyAdd the contents to this file python_script.py
from prometheus_client import CollectorRegistry, Gauge, push_to_gateway, write_to_textfile
import random
import time

push_gateway_url = 'http://<pushgateway-IP_address>:9091'

job_name = 'python_job'
instance_name = 'my_instance'

registry = CollectorRegistry()

random_metric = Gauge('random_metric', 'Random metric generated by Python script', ['label_name'], registry=registry)

while True:
    value = random.randint(1, 100)

    labels = {'label_name': 'example_label'}

    random_metric.labels(**labels).set(value)

    push_to_gateway(push_gateway_url, job=job_name, registry=registry, grouping_key={'instance': instance_name})

    write_to_textfile('metrics.txt', registry)

    time.sleep(10)
Replace the push_gateway_url value and provide your Pushgateway IP address and port number. also, modify the job_name and the instance_name if you want.
This time I want to see how Gauge metrics work with Pushgateway, for that, I have created this script to produce some random values.
To run this script, use the following command.
python3 python_script.pyLet's check the Pushgateway dashboard to see if the above script is generating metrics.
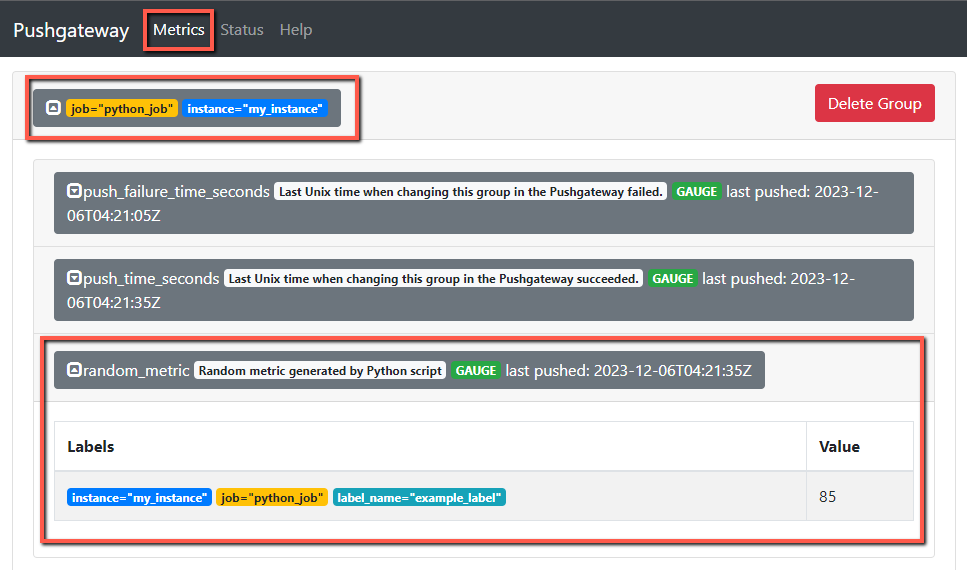
The script will generate values every 10 seconds and push them to the Pushgateway. also, the Prometheus will scrape the metrics from the Pushgateway every 5 seconds.
Pushgateway will not store all the values it getting. in each push, the values will be replaced, which means you can see only one set of data in the Pushgateway.
In our setup, every 10 seconds the Pushgateway data will be overwritten. when a new set of data comes, the old one will be deleted.
I am letting Prometheus collect some metrics so that we can visualize them better in the Grafana.
First, make a query Prometheus to see the result.
random_metric[1m]This PromQL query will show the last one-minute changes in that particular metric random_metric.
Prometheus output
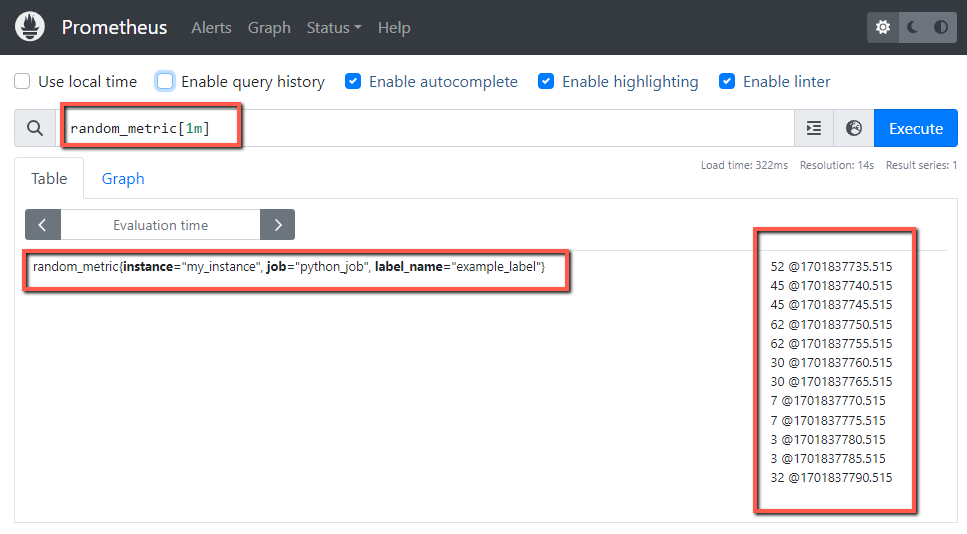
Here, you can see the metric random_metric has 12 samples with timestamps, this is because I have set the scrape_interval to 5 seconds, which means that the Prometheus will collect 60/5=12 samples in a minute.
Grafana output
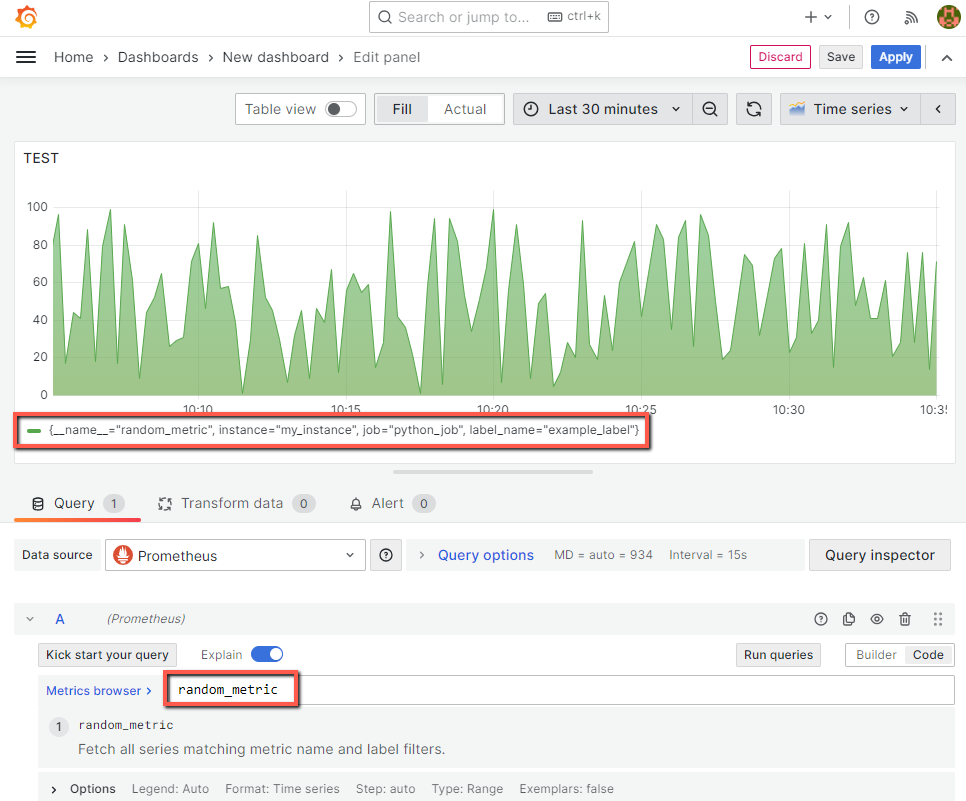
This is how Grafana visualizes the metrics that we have collected from the Python script.
Conclusion
I have implemented this setup for testing purposes, in real-time, the use cases might be different. So you can get the overall idea of the working principle of the Pushgateway from thia guide and make improvements when you implement it in your projects.
There are some other Exporters also available, such as Node Exporter, Blackbox Exporter, etc. Explore them to get more ideas and use cases.
