


In this Kubernetes tutorial, you will learn how to set up the EFK stack on a Kubernetes cluster for log streaming, log analysis, and log monitoring.
Check out part 1 in this Kubernetes logging series, where we have covered Kubernetes logging fundamentals and patterns for beginners.
When running multiple applications and services on a Kubernetes cluster, it makes more sense to stream all of your application and Kubernetes cluster logs to one centralized logging infrastructure for easy log analysis.
This beginner's guide walks you through the key technical aspects of Kubernetes logging using the EFK stack.
What is EFK Stack?
EFK stands for Elasticsearch, Fluent Bit, and Kibana. EFK is a popular and the best open-source choice for Kubernetes log aggregation and analysis.
- Elasticsearch is a distributed, scalable search engine commonly used to search large volumes of log data. It is a NoSQL database based on the Apache Lucene search engine (search library from Apache). Its primary work is to store logs and retrieve logs from Fluentbit.
- Fluent Bit is a log shipper. It is a small but fast open-source tool that collects and forwards logs. It collects data from various sources, processes it, and then sends it to the location where the logs are stored and analyzed. It often sends data to services such as Elasticsearch, CloudWatch, Splunk, and Stackdriver.
- Kibana is a UI tool for querying, data visualization, and dashboards. It is a query engine that allows you to explore your log data through a web interface, build visualizations for event logs, and query-specific to filter information for detecting issues. You can virtually build any type of dashboards using Kibana. Kibana Query Language (KQL) is used for querying Elasticsearch data.
Also, Elasticsearch helps solve the problem of separating huge amounts of unstructured data and is in use by many organizations. Elasticsearch is commonly deployed alongside Kibana.
Note: When it comes to Kubernetes, Fluent Bit is the best choice because it is a lightweight, fast tool. However, if you have a complex log-processing scenario, you can consider Fluentd.Before we move to the setup, let us check the workflow of the EFK stack.
EFK Stack Architecture
The following diagram shows the high-level architecture of the EFK stack we will build.
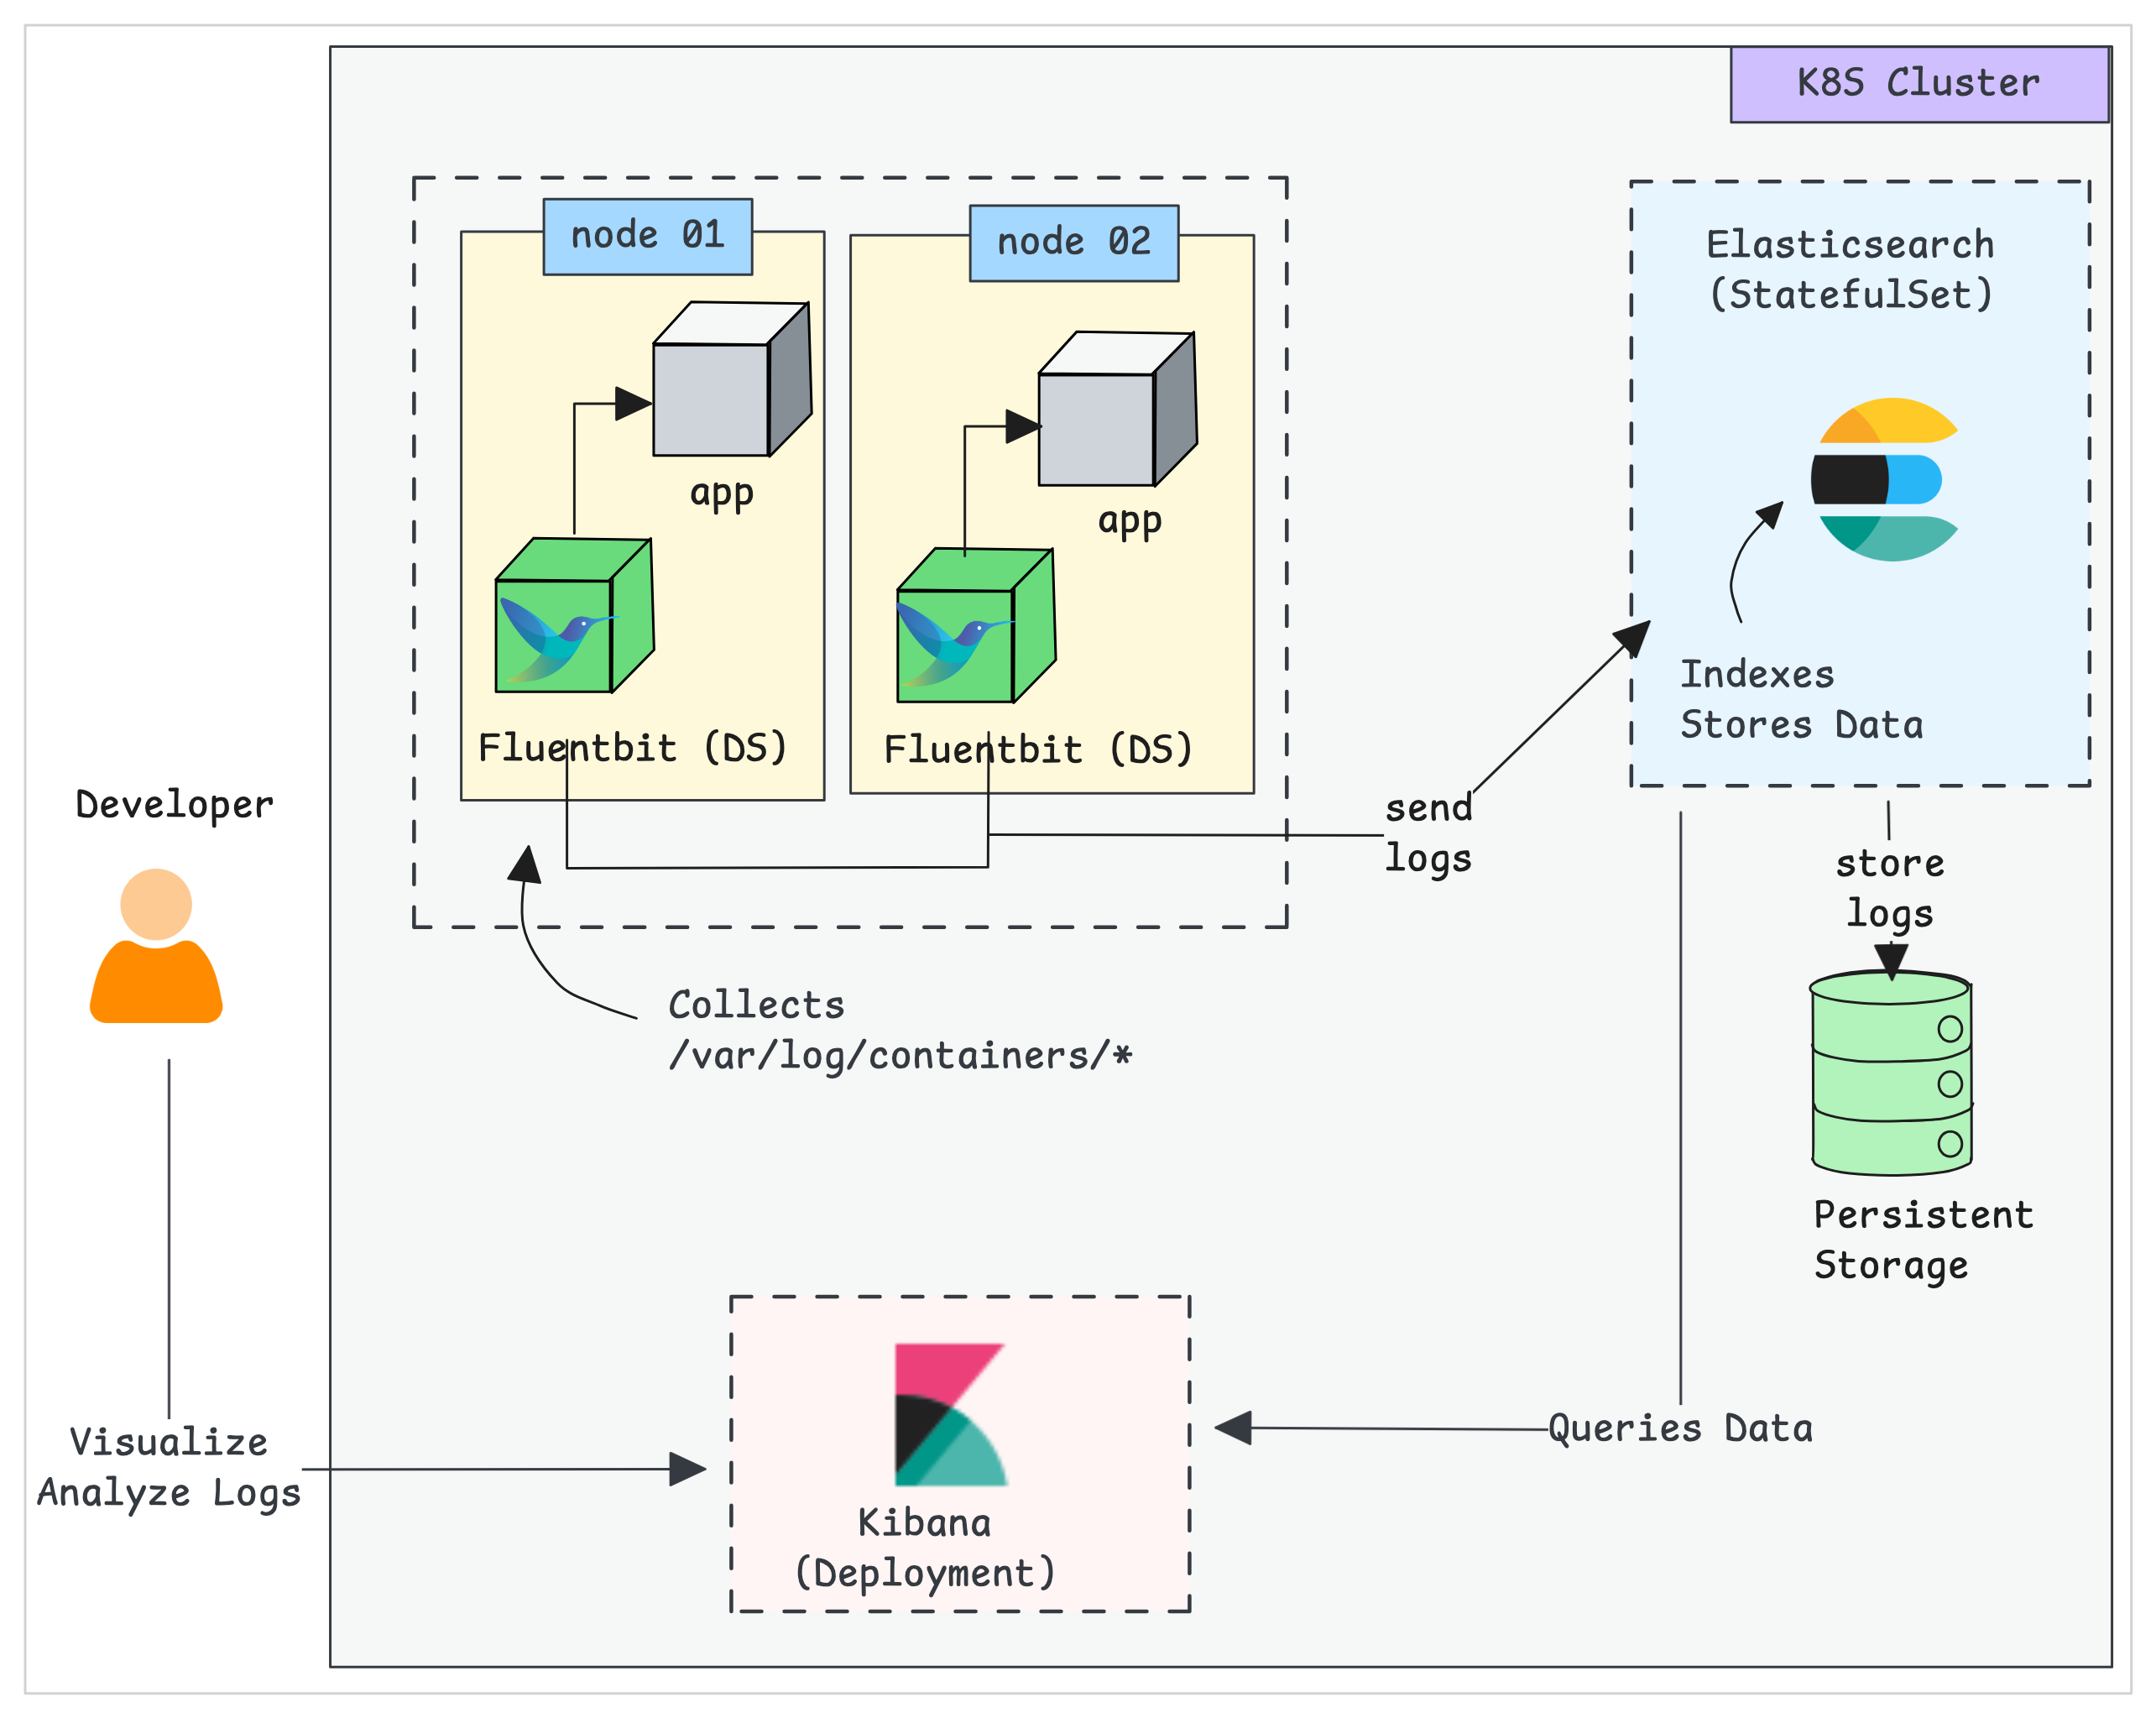
EKF components get deployed as follows,
- Fluentbit:- Deployed as a Daemonset, so an agent pod will run on each node to collect the logs from workloads.
- Elasticsearch:- Deployed as a statefulset as it holds the log data. We also expose the service endpoint for Fluentbit and Kibana to connect to it.
- Kibana:- Deployed as a deployment and connects to the Elasticsearch service endpoint.
Prerequisites
Before beginning the installation, ensure you have the following
- A Kubernetes cluster
- Helm [Local Workstation]
- Kubectl [Local Workstation]
Once you have a Kubernetes cluster, we can start the setup.
Set up ECK Operator on Kubernetes
The first step is setting up Elasticsearch and Kibana on the cluster.
Here, we use the ECK (Elastic Cloud on Kubernetes) Operator instead of the standard installation method to easily manage resources such as Elasticsearch and Kibana via Custom Resource Definitions.
To install the ECK Operator, we even use the Helm chart.
Step 1: Add Elastic Helm Repositories
The first step is to add the Elastic Helm repositories to our local machine.
helm repo add elastic https://helm.elastic.co

helm repo update
Once we have added and updated all the Elastic charts, we can begin the installation.
Step 2: Install ECK Operator
To install the Elasticsearch operator, we need to choose the elastic/eck-operator chart.
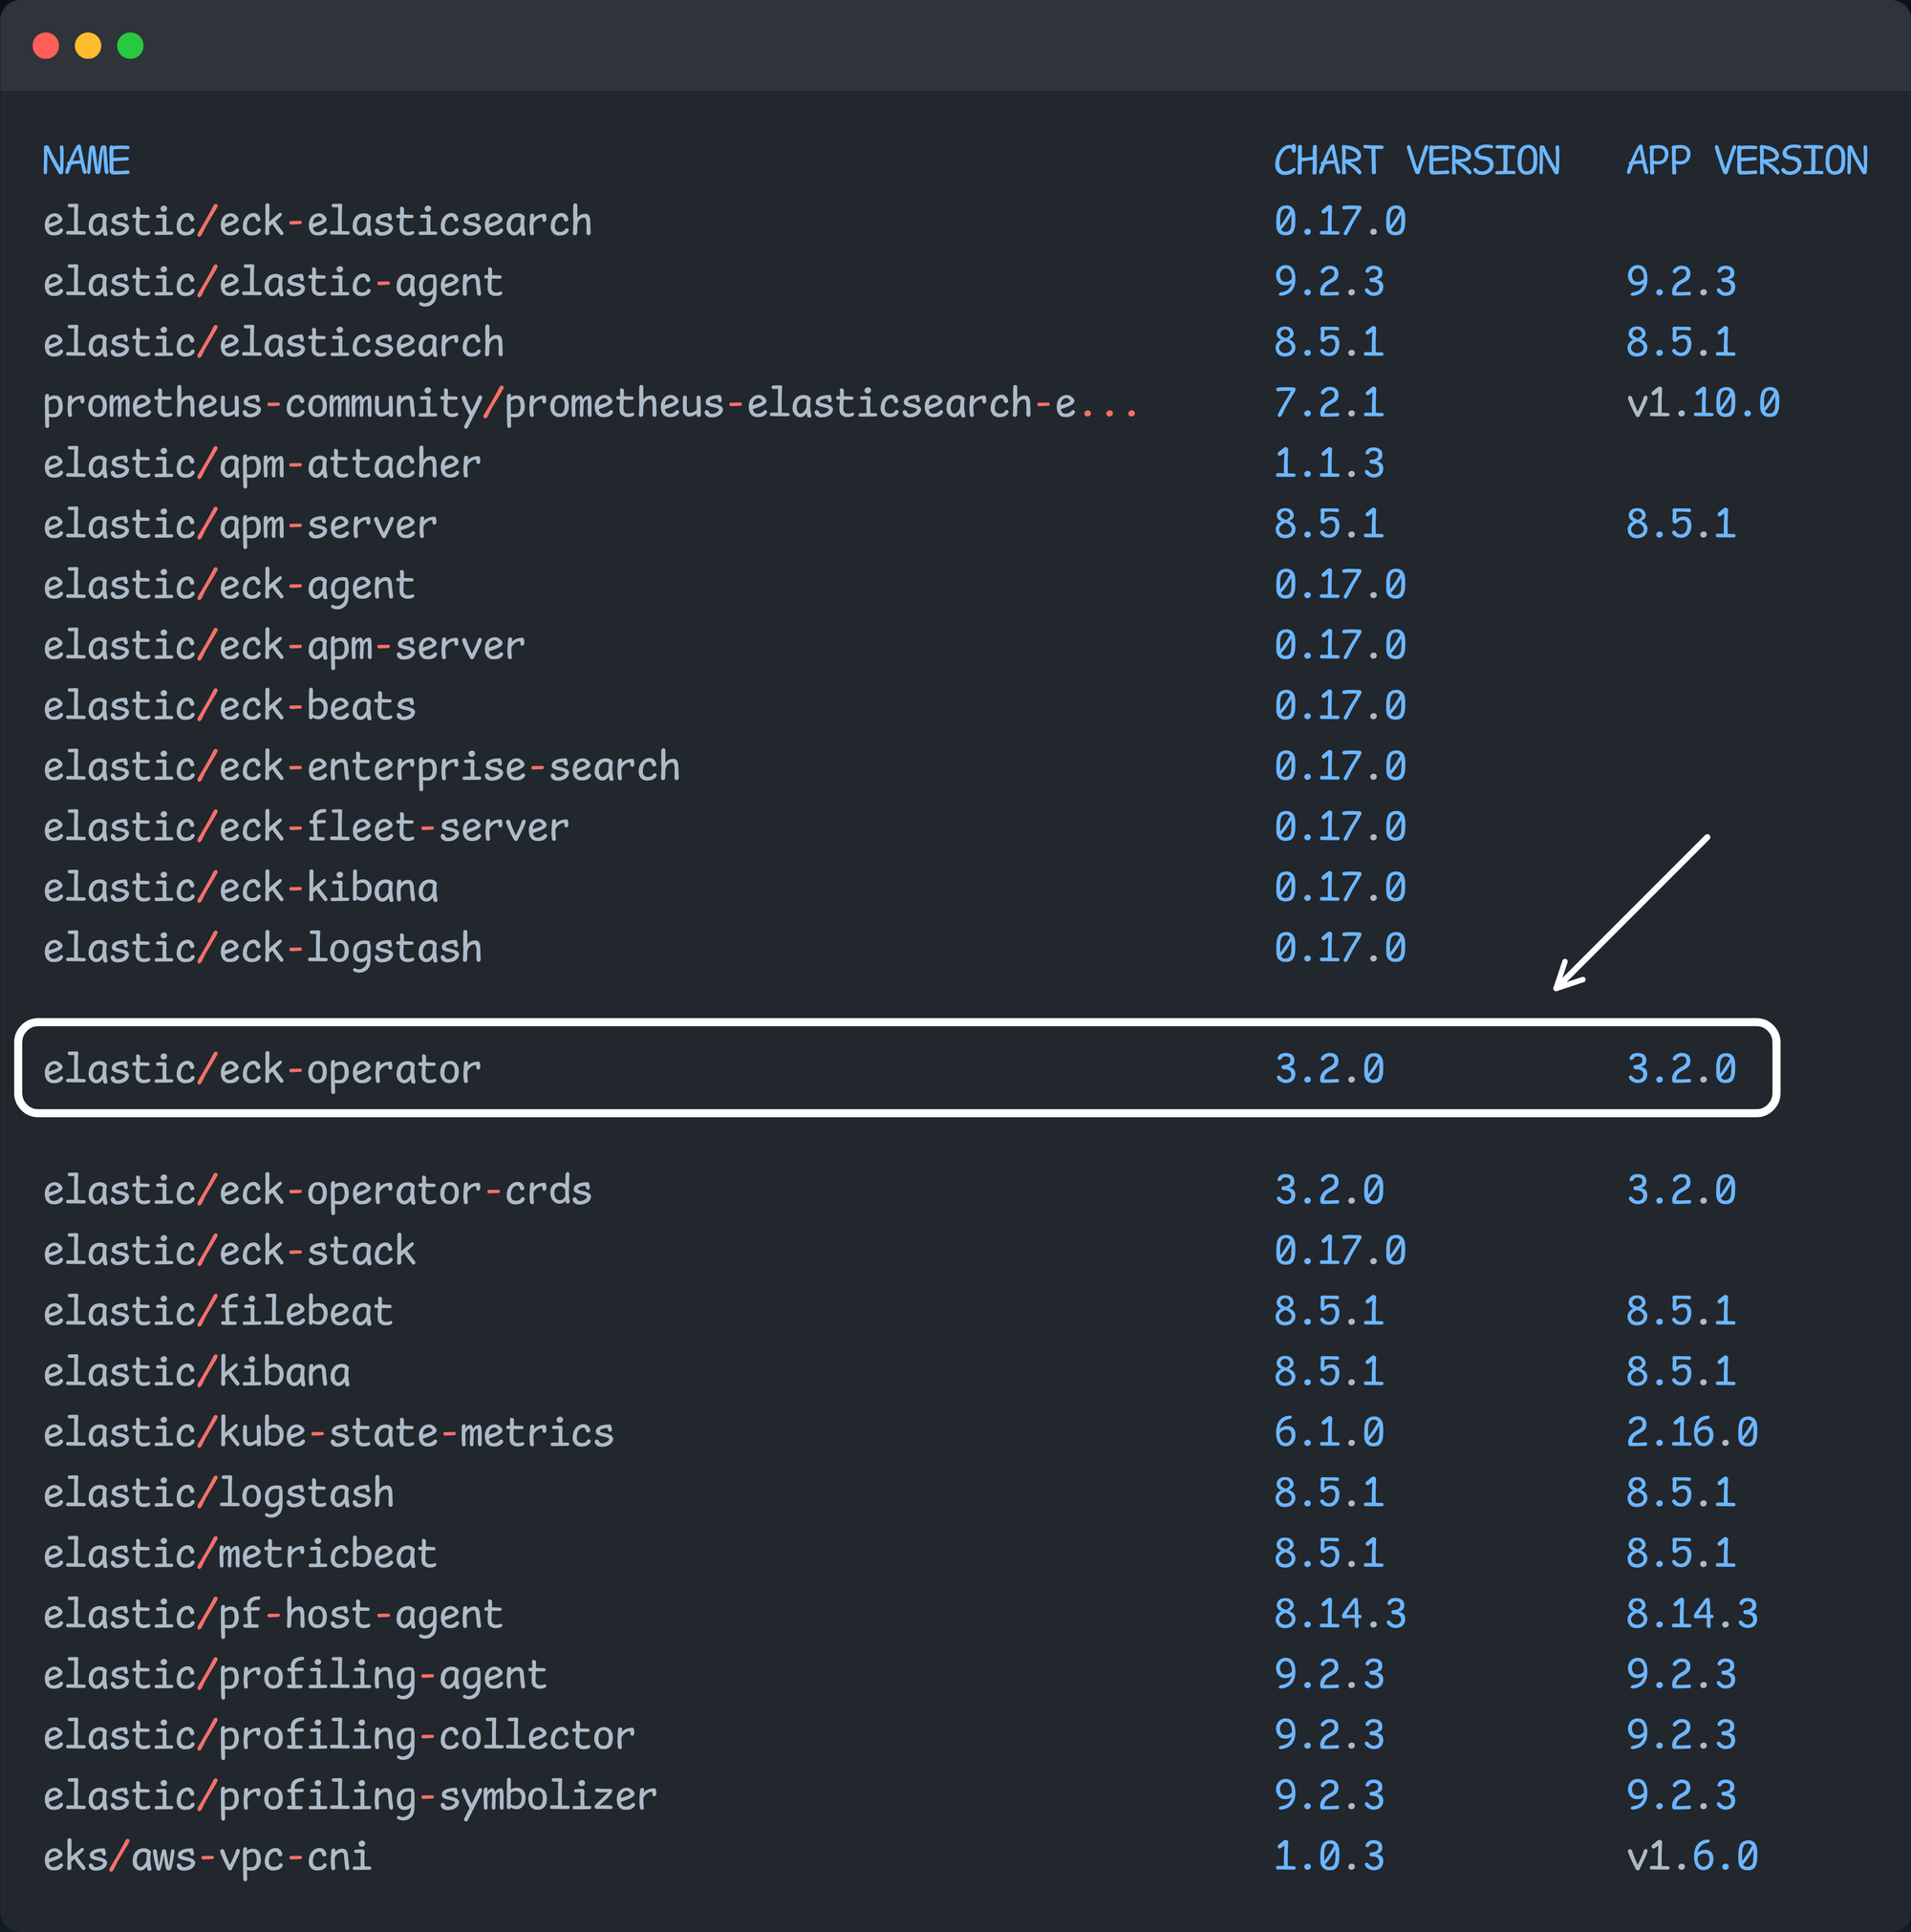
In production, we do not deploy the Helm chart directly. Instead, we will make the necessary customizations based on the project requirements and then deploy.
To do that, first download the chart or the original values file that contains the modifiable settings.
To download the ECK operator Helm chart, run the following commands.
helm pull elastic/eck-operator --untarThe following is the directory structure of the ECK operator Helm chart.
eck-operator
├── Chart.lock
├── Chart.yaml
├── LICENSE
├── README.md
├── charts
│   └── eck-operator-crds
│       ├── Chart.yaml
│       ├── README.md
│       ├── templates
│       │   ├── NOTES.txt
│       │   ├── _helpers.tpl
│       │   └── all-crds.yaml
│       └── values.yaml
├── profile-disable-automounting-api.yaml
├── profile-global.yaml
├── profile-istio.yaml
├── profile-restricted.yaml
├── profile-soft-multi-tenancy.yaml
├── templates
│   ├── NOTES.txt
│   ├── _helpers.tpl
│   ├── cluster-roles.yaml
│   ├── configmap.yaml
│   ├── managed-namespaces.yaml
│   ├── managed-ns-network-policy.yaml
│   ├── metrics-service.yaml
│   ├── operator-namespace.yaml
│   ├── operator-network-policy.yaml
│   ├── pdb.yaml
│   ├── podMonitor.yaml
│   ├── role-bindings.yaml
│   ├── service-account.yaml
│   ├── service-monitor.yaml
│   ├── statefulset.yaml
│   ├── validate-chart.yaml
│   └── webhook.yaml
└── values.yaml
Here, you can see the original values.yaml file, but we will create a separate one based on the requirements.
Copy and paste the following contents into your terminal to create a custom values file.
cat << EOF > dev-es-values.yaml
installCRDs: true

replicaCount: 1

resources:
  limits:
    cpu: 500m
    memory: 512Mi
  requests:
    cpu: 100m
    memory: 200Mi

webhook:
  enabled: true
  failurePolicy: Ignore
  manageCerts: true

config:
  logVerbosity: "0"
  metrics:
    port: 9090
EOF
Once the custom values file is ready, we can install the ECK operator using the following command.
helm upgrade --install eck-operator elastic/eck-operator \
  -n es-operator \
  --create-namespace \
  -f dev-es-values.yaml
Once installation is complete, we need to ensure the Elasticsearch operator pod is running without issues.
Step 3: Validate the Elasticsearch Operator
To ensure the Operator pod runs without issues, run the following command.
$ kubectl -n es-operator get po

NAME                 READY   STATUS    RESTARTS      AGE
elastic-operator-0   1/1     Running   1 (13m ago)   14m
Since this is an operator, it has custom resources to manage the Elasticsearch pods.
To list all the Custom Resource Definitions of the Elasticsearch, use the following command.
$ kubectl get crds | grep elastic

agents.agent.k8s.elastic.co                            2025-12-29T05:17:50Z
apmservers.apm.k8s.elastic.co                          2025-12-29T05:17:50Z
beats.beat.k8s.elastic.co                              2025-12-29T05:17:50Z
elasticmapsservers.maps.k8s.elastic.co                 2025-12-29T05:17:50Z
elasticsearchautoscalers.autoscaling.k8s.elastic.co    2025-12-29T05:17:50Z
elasticsearches.elasticsearch.k8s.elastic.co           2025-12-29T05:17:50Z
enterprisesearches.enterprisesearch.k8s.elastic.co     2025-12-29T05:17:50Z
kibanas.kibana.k8s.elastic.co                          2025-12-29T05:17:50Z
logstashes.logstash.k8s.elastic.co                     2025-12-29T05:17:50Z
stackconfigpolicies.stackconfigpolicy.k8s.elastic.co   2025-12-29T05:17:50Z
From this list, we need to use the enterprisesearches.enterprisesearch.k8s.elastic.co Custom Resource to create an Elasticsearch deployment.
Step 4: Deploy Elasticsearch
Our Elastic operator is ready, so we can create a manifest to create Elasticsearch.
Use the following contents to create an Elasticsearch deployment. Since this is a demo, we use an optimized Elasticsearch manifest with a single node and minimal resources.
cat <<EOF > elasticsearch.yaml
apiVersion: elasticsearch.k8s.elastic.co/v1
kind: Elasticsearch
metadata:
  name: quickstart
  namespace: es-operator
spec:
  version: 8.12.2
  nodeSets:
  - name: default
    count: 1 # Optimized to 1 node for testing (production usually uses 3)
    config:
      node.roles: ["master", "data", "ingest"]
      node.store.allow_mmap: false
      xpack.ml.enabled: false
      xpack.security.enabled: true
      xpack.watcher.enabled: false
    podTemplate:
      spec:
        containers:
        - name: elasticsearch
          resources:
            requests:
              memory: 1Gi
              cpu: 200m
            limits:
              memory: 1.5Gi
              cpu: 1000m
          env:
          - name: ES_JAVA_OPTS
            value: "-Xms512m -Xmx512m"
    volumeClaimTemplates:
    - metadata:
        name: elasticsearch-data
      spec:
        accessModes:
        - ReadWriteOnce
        resources:
          requests:
            storage: 2Gi
EOFTo deploy this, use the following command.
kubectl deploy -f elasticsearch.yamlOnce the Elasticsearch is deployed, we need to check whether the ElasticSearch pods are running without any issues.
Step 5: Validate Elasticsearch Deployment
Once the deployment is completed, use the following command to list the Elasticsearch pods
$ kubectl get pods -n es-operator -l common.k8s.elastic.co/type=elasticsearch

NAME                      READY   STATUS    RESTARTS   AGE
quickstart-es-default-0   1/1     Running   0          4m2s
Output show that the Pod is running without any issues.
Since ElasticSearch is a custom resource, we can use that to list and see the status as well.
$ kubectl -n es-operator get elasticsearch

NAME         HEALTH   NODES   VERSION   PHASE   AGE
quickstart   green    1       8.12.2    Ready   2m20s
Elasticsearch deployment is completed, so we need to install the Kibana dashboard to visualize the logs.
Step 6: Deploy Kibana
As we deployed the Elasticsearch, we can use one of the Operator's custom resource called kibanas.kibana.k8s.elastic.co to deploy Kibana.
Use the following Kibana manifest to deploy the Kibana Pods.
cat << EOF > kibana.yaml
apiVersion: kibana.k8s.elastic.co/v1
kind: Kibana
metadata:
  name: quickstart
  namespace: es-operator
spec:
  version: 8.12.2
  count: 1
  elasticsearchRef:
    name: quickstart
  config:
    server.publicBaseUrl: "http://localhost:5601"
  podTemplate:
    spec:
      containers:
      - name: kibana
        resources:
          requests:
            memory: 512Mi
            cpu: 200m
          limits:
            memory: 1Gi
            cpu: 1000m
EOF
To deploy Kibana, use the following command.
kubectl apply -f kibana.yamlOnce the Kibana installation is completed, we need to ensure that the Pods are running.
Step 7: Validating Kibana Deployment
Once the deployment is completed, use the following command to list the Kibana pods and services.
$ kubectl get pods,svc -n es-operator -l common.k8s.elastic.co/type=kibana

NAME                                 READY   STATUS    RESTARTS   AGE
pod/quickstart-kb-7f694bf8db-pxlrs   1/1     Running   0          11m

NAME                         TYPE        CLUSTER-IP      EXTERNAL-IP   PORT(S)    AGE
service/quickstart-kb-http   ClusterIP   10.96.138.121   <none>        5601/TCP   11m
Output shows that the Kibana pod are running without any issues.
Kibana also a custom resource so we can list in that way as well.
$ kubectl -n es-operator get kibanas

NAME         HEALTH   NODES   VERSION   AGE
quickstart   green    1       8.12.2    12m
Now, both the Elasticsearch and the Kibana is ready. Since, Kibana is a dashboard, we need credentials to login.
Step 8: Generate Kibana Credentials
The default user name of Kibana is elastic and to generate password, use the following command.
$ kubectl get secret quickstart-es-elastic-user -n es-operator -o go-template='{{.data.elastic | base64decode}}'

Yf7CCX9C4Gz9lNpnVrk8zh8Q%
Ignore the % when copy the password.
Step 9: Port Forward Kibana Service
To access the Kibana dashboard from our local machine, we need to perform port forwarding because Kibana will be deployed as a ClusterIP service.
kubectl port-forward service/quickstart-kb-http -n es-operator 5601
Now, we are ready for the Kibana login.
Step 10: Access Kibana UI
To access the UI, open any of the web browser and paste the URL https://localhost:5601
Once the login page is open, paste the default username and the password to enter into.
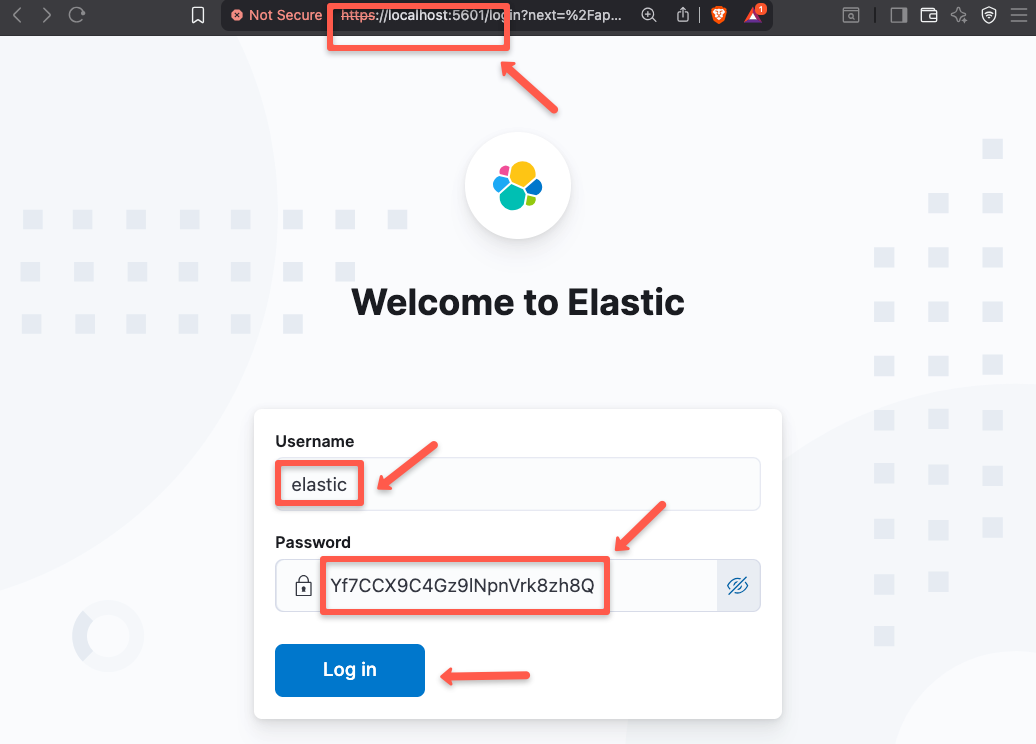
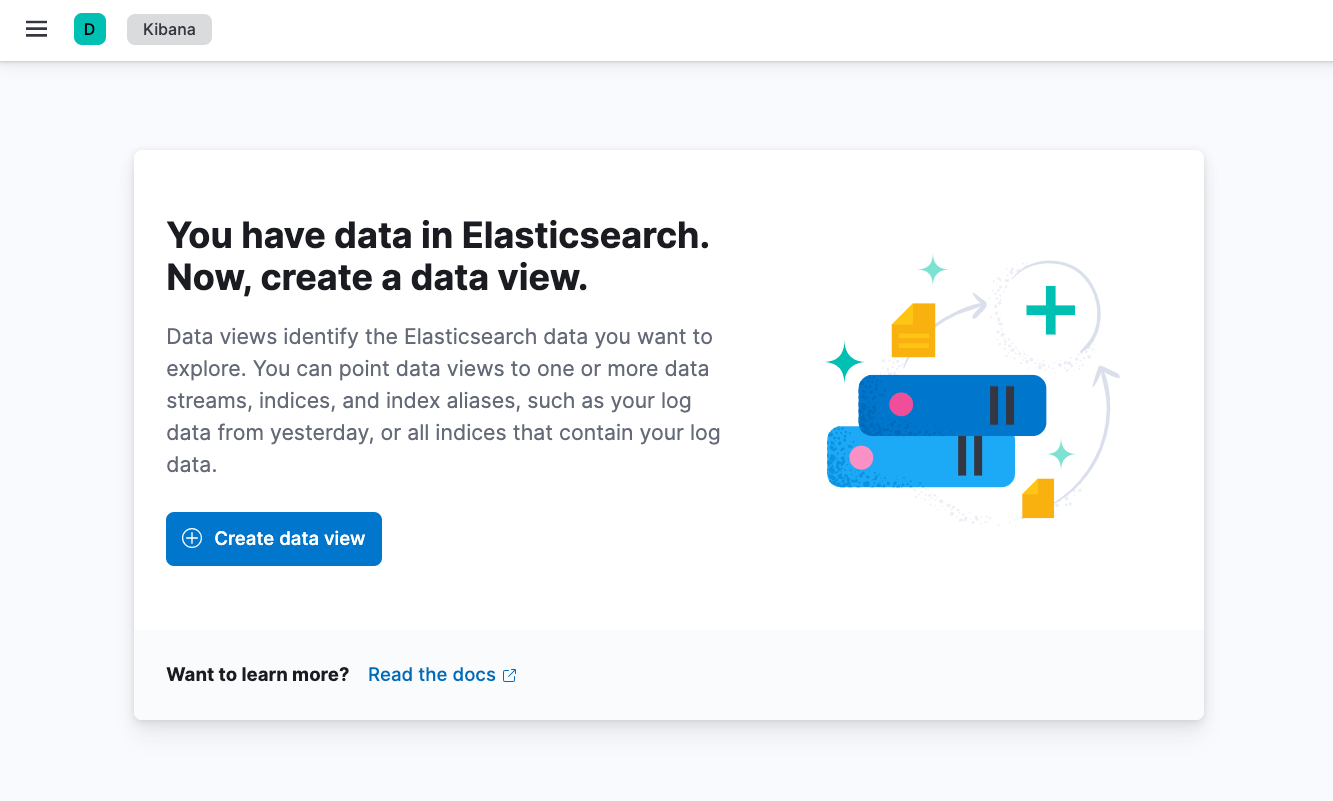
Once the login is completed, you will see a following page.
Now, both the Elasticsearch and Kibana deployments ready, so we need to deploy the Fluentbit to collect logs.
Setup Fluent Operator on Kubernetes
As like the Elastic operator, we are using an Operator for the FluentBit.
Fluentbit is a light weight logging agent that collects logs from the workloads of each nodes.
The collected logs will be send to the Elasticsearch for query and visualization. Elasticsearch needs to store the logs so is deployed as a StatefulSets and uses Persistent volumes as storage.
To begin the installation, we need to add the Fluent Helm repository.
Step 1: Add Fluent Helm repository
To add the Fluent Helm repo on our local machine, use the following command.
helm repo add fluent https://fluent.github.io/helm-charts

helm repo update
To install the Fluent operator, we use the fluent/fluent-operator chart from the list.
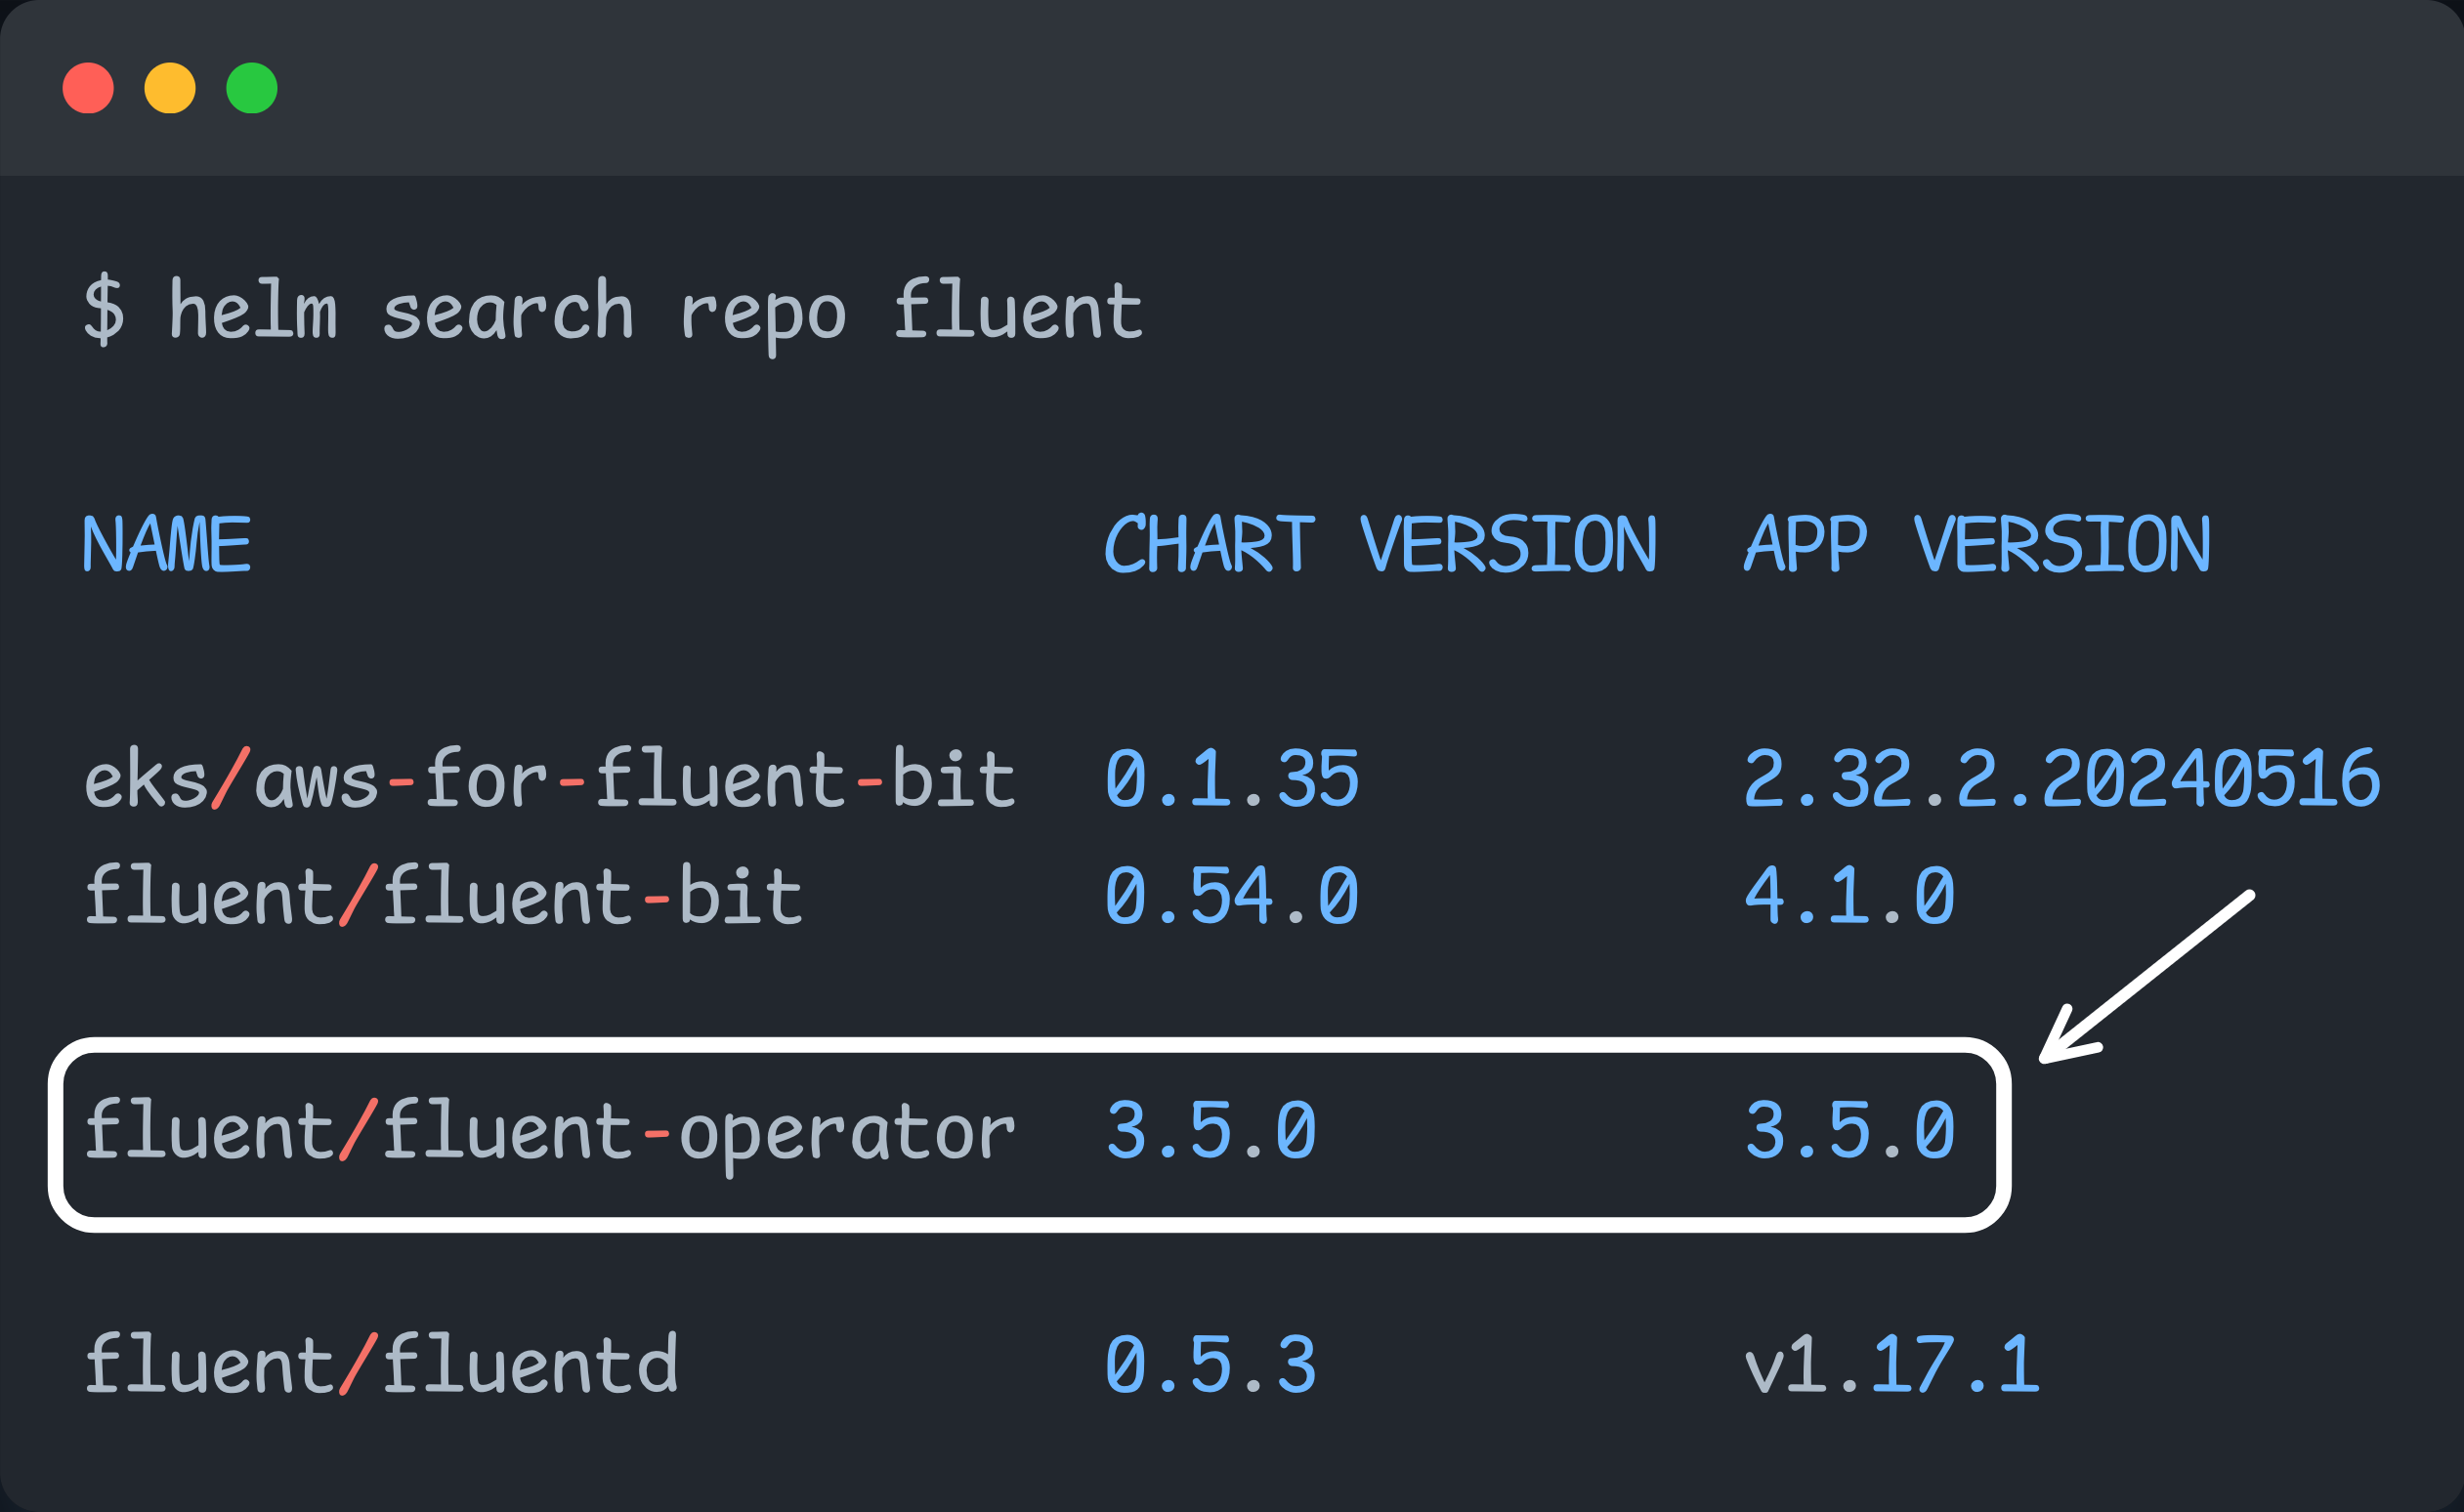
Once all the charts are updated, we can create custom values.
Step 2: Create Custom Values File
Before create custom values file, we can pull the chart on the local machine.
To pull the chart, use the following command.
helm pull fluent/fluent-operator --untarOnce the chart been download, you can see the following structure.
fluent-operator
├── Chart.lock
├── Chart.yaml
├── README.md
├── charts
│   ├── fluent-bit-crds
│   │   ├── Chart.yaml
│   │   ├── crds
│   │   │   ├── fluentbit.fluent.io_clusterfilters.yaml
│   │   │   ├── fluentbit.fluent.io_clusterfluentbitconfigs.yaml
│   │   │   ├── fluentbit.fluent.io_clusterinputs.yaml
│   │   │   ├── fluentbit.fluent.io_clustermultilineparsers.yaml
│   │   │   ├── fluentbit.fluent.io_clusteroutputs.yaml
│   │   │   ├── fluentbit.fluent.io_clusterparsers.yaml
│   │   │   ├── fluentbit.fluent.io_collectors.yaml
│   │   │   ├── fluentbit.fluent.io_filters.yaml
│   │   │   ├── fluentbit.fluent.io_fluentbitconfigs.yaml
│   │   │   ├── fluentbit.fluent.io_fluentbits.yaml
│   │   │   ├── fluentbit.fluent.io_multilineparsers.yaml
│   │   │   ├── fluentbit.fluent.io_outputs.yaml
│   │   │   └── fluentbit.fluent.io_parsers.yaml
│   │   └── values.yaml
│   └── fluentd-crds
│       ├── Chart.yaml
│       ├── crds
│       │   ├── fluentd.fluent.io_clusterfilters.yaml
│       │   ├── fluentd.fluent.io_clusterfluentdconfigs.yaml
│       │   ├── fluentd.fluent.io_clusterinputs.yaml
│       │   ├── fluentd.fluent.io_clusteroutputs.yaml
│       │   ├── fluentd.fluent.io_filters.yaml
│       │   ├── fluentd.fluent.io_fluentdconfigs.yaml
│       │   ├── fluentd.fluent.io_fluentds.yaml
│       │   ├── fluentd.fluent.io_inputs.yaml
│       │   └── fluentd.fluent.io_outputs.yaml
│       └── values.yaml
├── templates
│   ├── NOTES.txt
│   ├── _helpers.tpl
│   ├── fluent-operator-clusterRole.yaml
│   ├── fluent-operator-clusterRoleBinding.yaml
│   ├── fluent-operator-deployment.yaml
│   ├── fluent-operator-service.yaml
│   ├── fluent-operator-servicemonitor.yaml
│   ├── fluentbit-clusterfilter-containerd.yaml
│   ├── fluentbit-clusterfilter-kubernetes.yaml
│   ├── fluentbit-clusterfilter-multiline.yaml
│   ├── fluentbit-clusterfilter-systemd.yaml
│   ├── fluentbit-clusterinput-metrics.yaml
│   ├── fluentbit-clusterinput-nodeExporterMetrics.yaml
│   ├── fluentbit-clusterinput-systemd.yaml
│   ├── fluentbit-clusterinput-tail.yaml
│   ├── fluentbit-containerd-config.yaml
│   ├── fluentbit-fluentBit.yaml
│   ├── fluentbit-fluentbit-edge.yaml
│   ├── fluentbit-input-node-exporter-metrics-edge.yaml
│   ├── fluentbit-input-prometheus-scrape-metrics-edge.yaml
│   ├── fluentbit-lua-config.yaml
│   ├── fluentbit-multilineParser-javaMultiline.yaml
│   ├── fluentbit-output-elasticsearch.yaml
│   ├── fluentbit-output-forward.yaml
│   ├── fluentbit-output-kafka.yaml
│   ├── fluentbit-output-loki.yaml
│   ├── fluentbit-output-opensearch.yaml
│   ├── fluentbit-output-opentelemetry.yaml
│   ├── fluentbit-output-prometheus-exporter.yaml
│   ├── fluentbit-output-prometheus-remote-write-edge.yaml
│   ├── fluentbit-output-stackdriver.yaml
│   ├── fluentbit-output-stdout.yaml
│   ├── fluentbit-servicemonitor.yaml
│   ├── fluentbitconfig-fluentBitConfig.yaml
│   ├── fluentbitconfig-fluentbitconfig-edge.yaml
│   ├── fluentd-clusterfluentdconfig.yaml
│   ├── fluentd-filter-kafka.yaml
│   ├── fluentd-fluentd.yaml
│   ├── fluentd-output-elasticsearch.yaml
│   ├── fluentd-output-kafka.yaml
│   ├── fluentd-output-opensearch.yaml
│   └── serviceaccount.yaml
└── values.yaml
You can choose the required settings from the original values file and create a new custom one using the following contents.
cat << EOF > dev-fluent-values.yaml
Kubernetes: true

operator:
  enable: true
  resources:
    limits:
      cpu: 50m
      memory: 50Mi
    requests:
      cpu: 10m
      memory: 20Mi

fluentbit:
  enable: true
  resources:
    limits:
      cpu: 100m
      memory: 100Mi
    requests:
      cpu: 10m
      memory: 25Mi

fluentd:
  enable: false
EOF
Once the custom values file is ready, we can install the Fluent Operator as well as the Pods.
Step 3: Install Fluent Operator and Pods
Use the following command to install the Fluent operator and Fluentbit pods.
helm upgrade --install fluent-operator fluent/fluent-operator -f dev-fluent-values.yaml -n fluent --create-namespaceOnce the installation is completed, check whether the Controller and the Fluentbit agents are running.
Step 4: Validate the Fluent Operator and Agents
To see the status of the Fluent operator and Fluentbit Pods, use the following command.
$ kubectl -n fluent get po,svc

NAME                                   READY   STATUS    RESTARTS      AGE
pod/fluent-bit-jtkdf                   1/1     Running   1 (21m ago)   18h
pod/fluent-bit-n6dtg                   1/1     Running   1 (21m ago)   18h
pod/fluent-bit-x2ndg                   1/1     Running   1 (21m ago)   18h
pod/fluent-operator-74f784fbb9-nf4gd   1/1     Running   1 (21m ago)   18h

NAME                      TYPE        CLUSTER-IP      EXTERNAL-IP   PORT(S)    AGE
service/fluent-bit        ClusterIP   10.96.151.168   <none>        2020/TCP   18h
service/fluent-operator   ClusterIP   10.96.71.8      <none>        8080/TCP   18h
To see the Custom Resource Definitions of the Fluent, use the following command.
$ kubectl get crd | grep fluent

clusterfilters.fluentbit.fluent.io                     2025-12-29T10:32:05Z
clusterfilters.fluentd.fluent.io                       2025-12-29T10:32:08Z
clusterfluentbitconfigs.fluentbit.fluent.io            2025-12-29T10:32:05Z
clusterfluentdconfigs.fluentd.fluent.io                2025-12-29T10:32:08Z
clusterinputs.fluentbit.fluent.io                      2025-12-29T10:32:05Z
clusterinputs.fluentd.fluent.io                        2025-12-29T10:32:08Z
clustermultilineparsers.fluentbit.fluent.io            2025-12-29T10:32:05Z
clusteroutputs.fluentbit.fluent.io                     2025-12-29T10:32:05Z
clusteroutputs.fluentd.fluent.io                       2025-12-29T10:32:08Z
clusterparsers.fluentbit.fluent.io                     2025-12-29T10:32:05Z
collectors.fluentbit.fluent.io                         2025-12-29T10:32:06Z
filters.fluentbit.fluent.io                            2025-12-29T10:32:06Z
filters.fluentd.fluent.io                              2025-12-29T10:32:08Z
fluentbitconfigs.fluentbit.fluent.io                   2025-12-29T10:32:06Z
fluentbits.fluentbit.fluent.io                         2025-12-29T10:32:06Z
fluentdconfigs.fluentd.fluent.io                       2025-12-29T10:32:08Z
fluentds.fluentd.fluent.io                             2025-12-29T10:32:09Z
inputs.fluentd.fluent.io                               2025-12-29T10:32:09Z
multilineparsers.fluentbit.fluent.io                   2025-12-29T10:32:07Z
outputs.fluentbit.fluent.io                            2025-12-29T10:32:07Z
outputs.fluentd.fluent.io                              2025-12-29T10:32:09Z
parsers.fluentbit.fluent.io                            2025-12-29T10:32:07Z
Now, the FluentBit pods are ready to fetch the logs from the workloads.
Step 5: Create Cluster Output Custom Resource
Now, we need to create cluster output custom resource to see the log output on the Fluentbit pods.
cat <<EOF > fluent-stdout-output.yaml
apiVersion: fluentbit.fluent.io/v1alpha2
kind: ClusterOutput
metadata:
  name: stdout
  labels:
    fluentbit.fluent.io/enabled: "true"
spec:
  matchRegex: (?:kube|service)\.(?:var\.log\.containers\.counter.*)
  stdout:
    format: json
EOF
Once the manifest is created, use the following command to deploy it.
kubectl apply -f fluent-stdout-output.yamlOnce created the custom resource, we can list that using the following command.
$ kubectl get clusteroutputs

NAME     AGE
stdout   3d4h
This ensures that the Custom Resource is created. To test the log collection, we will deploy a demo application.
Verify Fluentd Setup
To verify the Fluentd installation, let us start a pod that continuously generates logs.
cat << EOF | kubectl apply -f -
apiVersion: v1
kind: Pod
metadata:
  name: counter
spec:
  containers:
  - name: count
    image: busybox
    args:
    - /bin/sh
    - -c
    - |
      i=0
      while true; do
        echo "Thanks for visiting devopscube! $i"
        i=$((i+1))
        sleep 1
      done
EOF
Once it is deployed, the pod keeps on generate logs.
Step 1: See Logs From Pod
Once we deployed the application, we can check the logs of the same pod to ensure that it generating the logs.
$ kubectl logs counter

Thanks for visiting devopscube!
Thanks for visiting devopscube!
Thanks for visiting devopscube!
Thanks for visiting devopscube!
This ensures that the pod is properly generating the logs, so let us check the Fluentbit pods are collecting are not.
Step 2: See Logs Through Fluentbit Pods
All the workload Pod's logs will be stored in the same node on path /var/log/containers.
Fluentbit pods will be run as a DaemonSet, so each node has a Fluentbit pod. The agent from the same node will collect those logs from the static location.
To check the logs of the Fluentbit pods, use the following command.
kubectl logs -n fluent -l app.kubernetes.io/name=fluent-bit --tail=200 | grep "counter"

[{"date":1767072959.964684,"log":"2025-12-30T05:35:59.964536754Z stdout F Thanks for visiting devopscube! ","kubernetes":{"pod_name":"counter","namespace_name":"default","pod_ip":"10.244.1.6","container_name":"count","docker_id":"ec9dcdd990faf638f95a1ca724efb7ecc7da7f15ed34972eabc0c5fa2b015eee","container_image":"docker.io/library/busybox:latest"}}]
[{"date":1767072960.966736,"log":"2025-12-30T05:36:00.966605613Z stdout F Thanks for visiting devopscube! ","kubernetes":{"pod_name":"counter","namespace_name":"default","pod_ip":"10.244.1.6","container_name":"count","docker_id":"ec9dcdd990faf638f95a1ca724efb7ecc7da7f15ed34972eabc0c5fa2b015eee","container_image":"docker.io/library/busybox:latest"}}]
Here, you can see the same logs generated on the demo application.
Step 3: Configure Elasticsearch for Kibana
Copy the Elasticsearch credentials into the Fluent Bit namespace for the Fluentbit to access the Elasticsearch.
kubectl get secret quickstart-es-elastic-user -n es-operator -o yaml | sed 's/namespace: es-operator/namespace: fluent/' | kubectl apply -f -Create a secret for username as elastic
kubectl create secret generic elastic-username --from-literal=username=elastic -n fluentNow, we need to create or modify the Cluster Output custom resource with the credentials.
This tells that how the how the FluentBit can authenticate with the Elasticsearch.
cat <<EOF > fluent-es-output.yaml
apiVersion: fluentbit.fluent.io/v1alpha2
kind: ClusterOutput
metadata:
  name: es
  labels:
    fluentbit.fluent.io/enabled: "true"
spec:
  matchRegex: (?:kube|service)\.(?:var\.log\.containers\.counter.*)
  es:
    host: quickstart-es-http.es-operator.svc
    port: 9200
    httpUser:
      valueFrom:
        secretKeyRef:
          name: elastic-username
          key: username
    httpPassword:
      valueFrom:
        secretKeyRef:
          name: quickstart-es-elastic-user
          key: elastic
    tls:
      verify: false
    index: fluent-bit
    suppressTypeName: "On"
EOF
To deploy this, use the following command.
kubectl apply -f fluent-es-output.yamlOnce the resource is deployed, we need to restart the fluent pods.
kubectl delete pod -n fluent -l app.kubernetes.io/name=fluent-operator
kubectl delete pod -n fluent -l app.kubernetes.io/name=fluent-bit
To verify the Elasticsearch index, we need the credentials first.
export ES_PASSWORD=$(kubectl get secret quickstart-es-elastic-user -n es-operator -o jsonpath='{.data.elastic}' | base64 --decode)To check indices, use the following command.
kubectl run curl-test --rm -it --restart=Never --image=curlimages/curl -- \
  -k -u elastic:$ES_PASSWORD https://quickstart-es-http.es-operator.svc:9200/_cat/indices?v
Now, the index is ready, so we can configure the Kibana dashboard to see the logs.
Step 4: Configure Kibana
Create a secret in the fluent namespace of the Elastic secret
kubectl get secret quickstart-es-elastic-user -n es-operator -o json | \
jq 'del(.metadata.namespace,.metadata.resourceVersion,.metadata.uid,.metadata.creationTimestamp)' | \
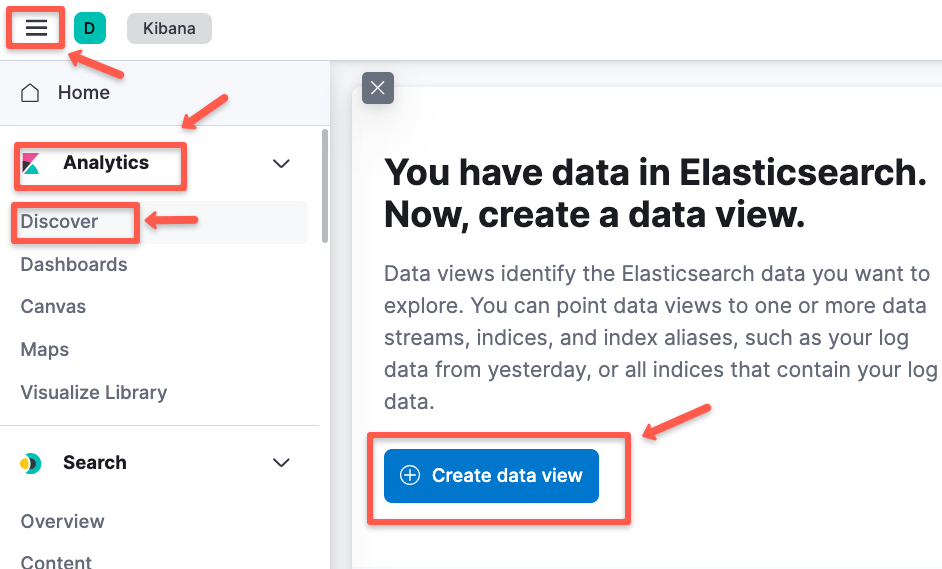
kubectl apply -n fluent -f -To see the logs in Kibana dashboard, you need to create a data view.
Navigatew to Analytics -> Discover and click "Create data view" to create a new one.
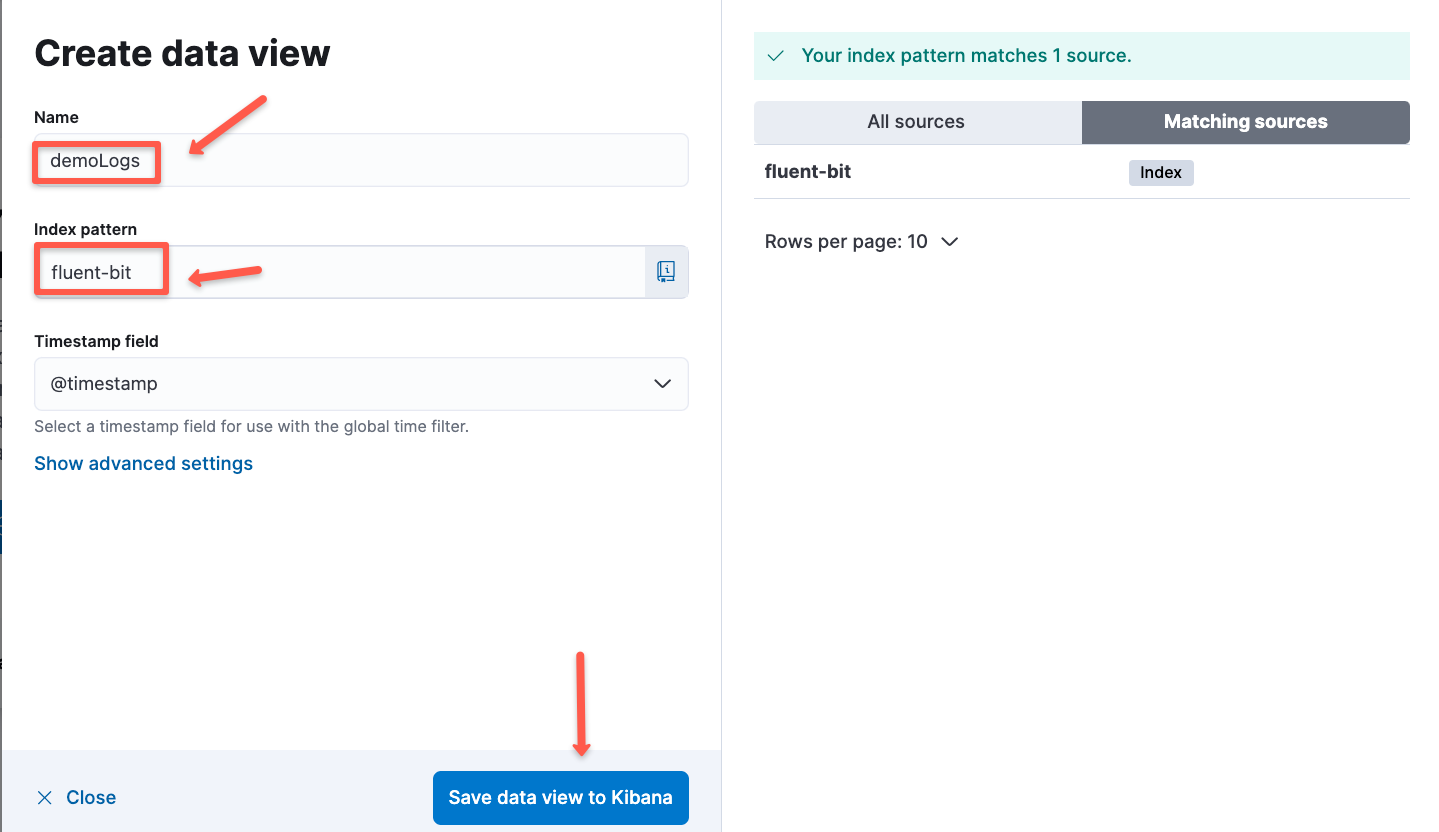
Then give a name for the dataview and select the Index patten and save the view.
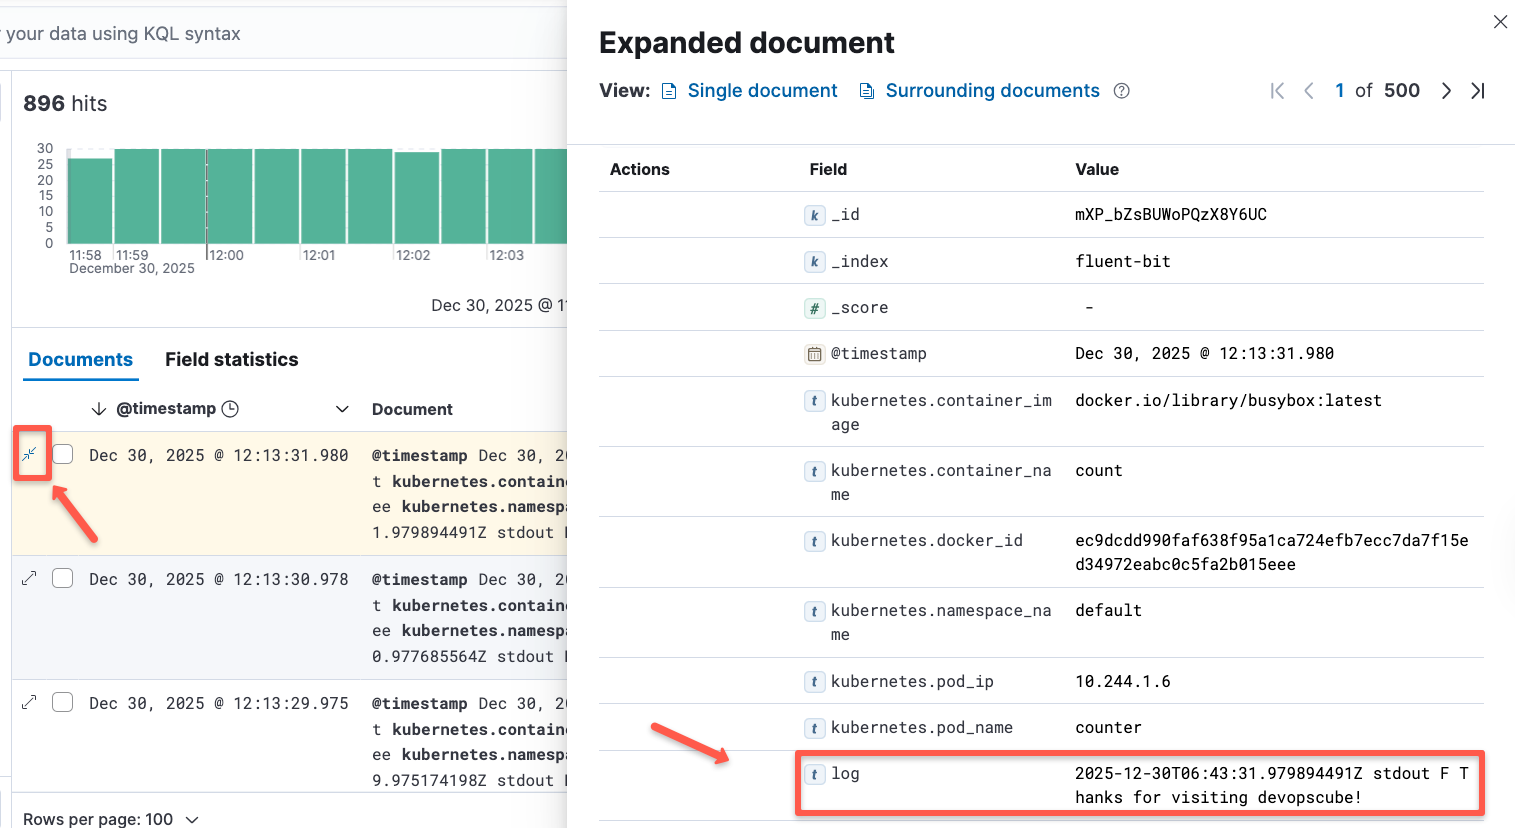
Once the dataview is created, you will be able to see the logs for the workload pods.
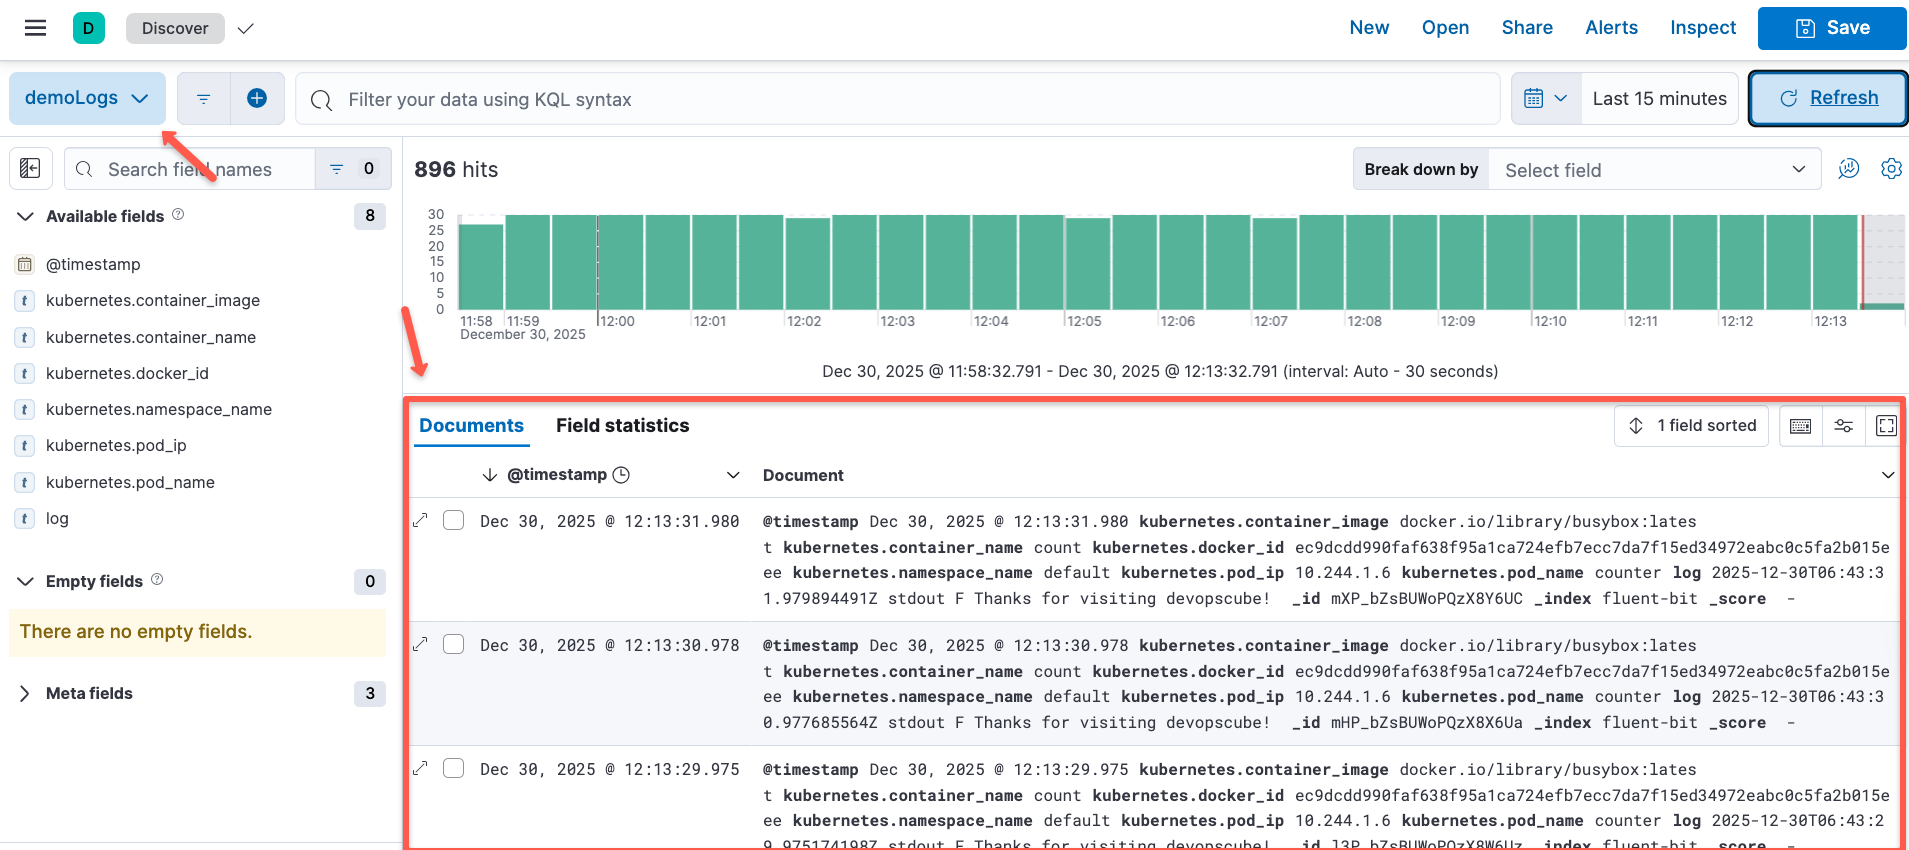
Here, you can see the same logs that we get in the Fluentbit pods.
This is how we can easily track the logs of our Kubernetes workload and is useful to identify the issues using the logs.
Kubernetes EFK Best Practices
- Elasticsearch uses heap memory extensively for filtering and caching for better query performances, so ample memory should be available for Elasticsearch.
Giving more than half of total memory to Elasticsearch could also leave too less memory for OS functions which could in turn hamper Elasticsearch's capabilities.
So be mindful of this! A 40-50% of total heap space to Elasticsearch is good enough. - Elasticsearch indices can fill up quickly so it's important to clean up old indices regularly. Kubernetes cron jobs can help you do this regularly in an automated fashion.
- Having data replicated across multiple nodes can help in disaster recovery and also improve query performance. By default, replication factor in elasticsearch is set to 1.
Consider playing around with this values according to your use case. Having atleast 2 is a good practise. - Data which is known to be accessed more frequently can be placed in different nodes with more resources allocated. This can be achieved by running a cronjob that moves the indices to different nodes at regular intervals.
Though this is an advance use case - it is good for a beginner to atleast have knowledge that something like this can be done. - In Elasticsearch, you an archive indices to low cost cloud storage such as aws-s3 and restore when you need data from those indices.
This is a best practise if you need to conserve logs for audit and compliance. - Having multiple nodes like master, data and client nodes with dedicated functionalities is good for high availability and fault tolerance.
Fluentd vs Fluent Bit
Most of them are still confused about choosing between Fluent and FluentBit. Here, I am providing a brief comparison to give you a better idea.
| Aspect | Fluent Bit | Fluentd |
|---|---|---|
| Language | C | Ruby + C |
| Memory Footprint | ~650 KB | ~40 MB |
| Plugins | 100+ | 700+ |
| Best For | Edge collection, Kubernetes nodes | Log aggregation, complex processing |
| Performance | High throughput, low latency | Moderate throughput, feature-rich |
Beyond EFK - Further Research
This guide was just a small use case of setting up the Elastic stack on Kubernetes. Elastic stack has tons of other features which help in logging and monitoring solutions.
For example, it can ship logs from virtual machines and managed services of various cloud providers. You can even ship logs from data engineering tools like Kafka into the Elastic Stack.
The elastic stack has other powerful components worth looking into, such as:
- Elastic Metrics: Ships metrics from multiple sources across your entire infrastructure and makes it available in elastic search and kibana.
- APM: Expands elastic stack capabilities and lets you analyze where exactly an application is spending time quickly fixing issues in production.
- Uptime: Helps in monitoring and analyzing availability issues across your apps and services before they start appearing in the production.
Explore and research them!
Conclusion
In his Kubernetes EFK setup guide, we learned how to configure the logging infrastructure on Kubernetes.
If you want to become a DevOps engineer, it is very important to understand all the concepts involved in the Kubernetes logging.
In the next part of this series, we are going to explore Kibana dashboards and visualization options.
In Kibana, it is a good practice to visualize data through graphs wherever possible as it gives a much more clear picture of your application state. So don't forget to check out the next part of this series.
Till then, keep learning and exploring.
