

In this blog, you will learn to securely access private EKS resources with the help of an OpenVPN server.
Setup Architecture and Workflow
When it comes to secure EKS implementation, the clusters needs to be in a fully private subnet.
When you deploy applications in a Private EKS cluster, you need a bastion host or a VPN setup to seamlessly access the applications in the cluster.
For example, lets say you deploy Prometheus or Loki stack in the cluster, to access the dashboards, you need to have access to the Internal Load Balancer.
Here is where OpenVPN server comes in to picture.
From our local workstations, the VPN server will create a secure, encrypted tunnel over the internet to communicate with the private networks in AWS cloud infrastrucure.
We will set up an OpenVPN self-hosted server on an EC2 instance and configure it to communicate with private subnets where the EKS cluster resides. This way, the resources on that private subnets cab be accessed from our local machine.
The following architecture diagram explains the private communication between the client (local workstation) and the AWS resources.
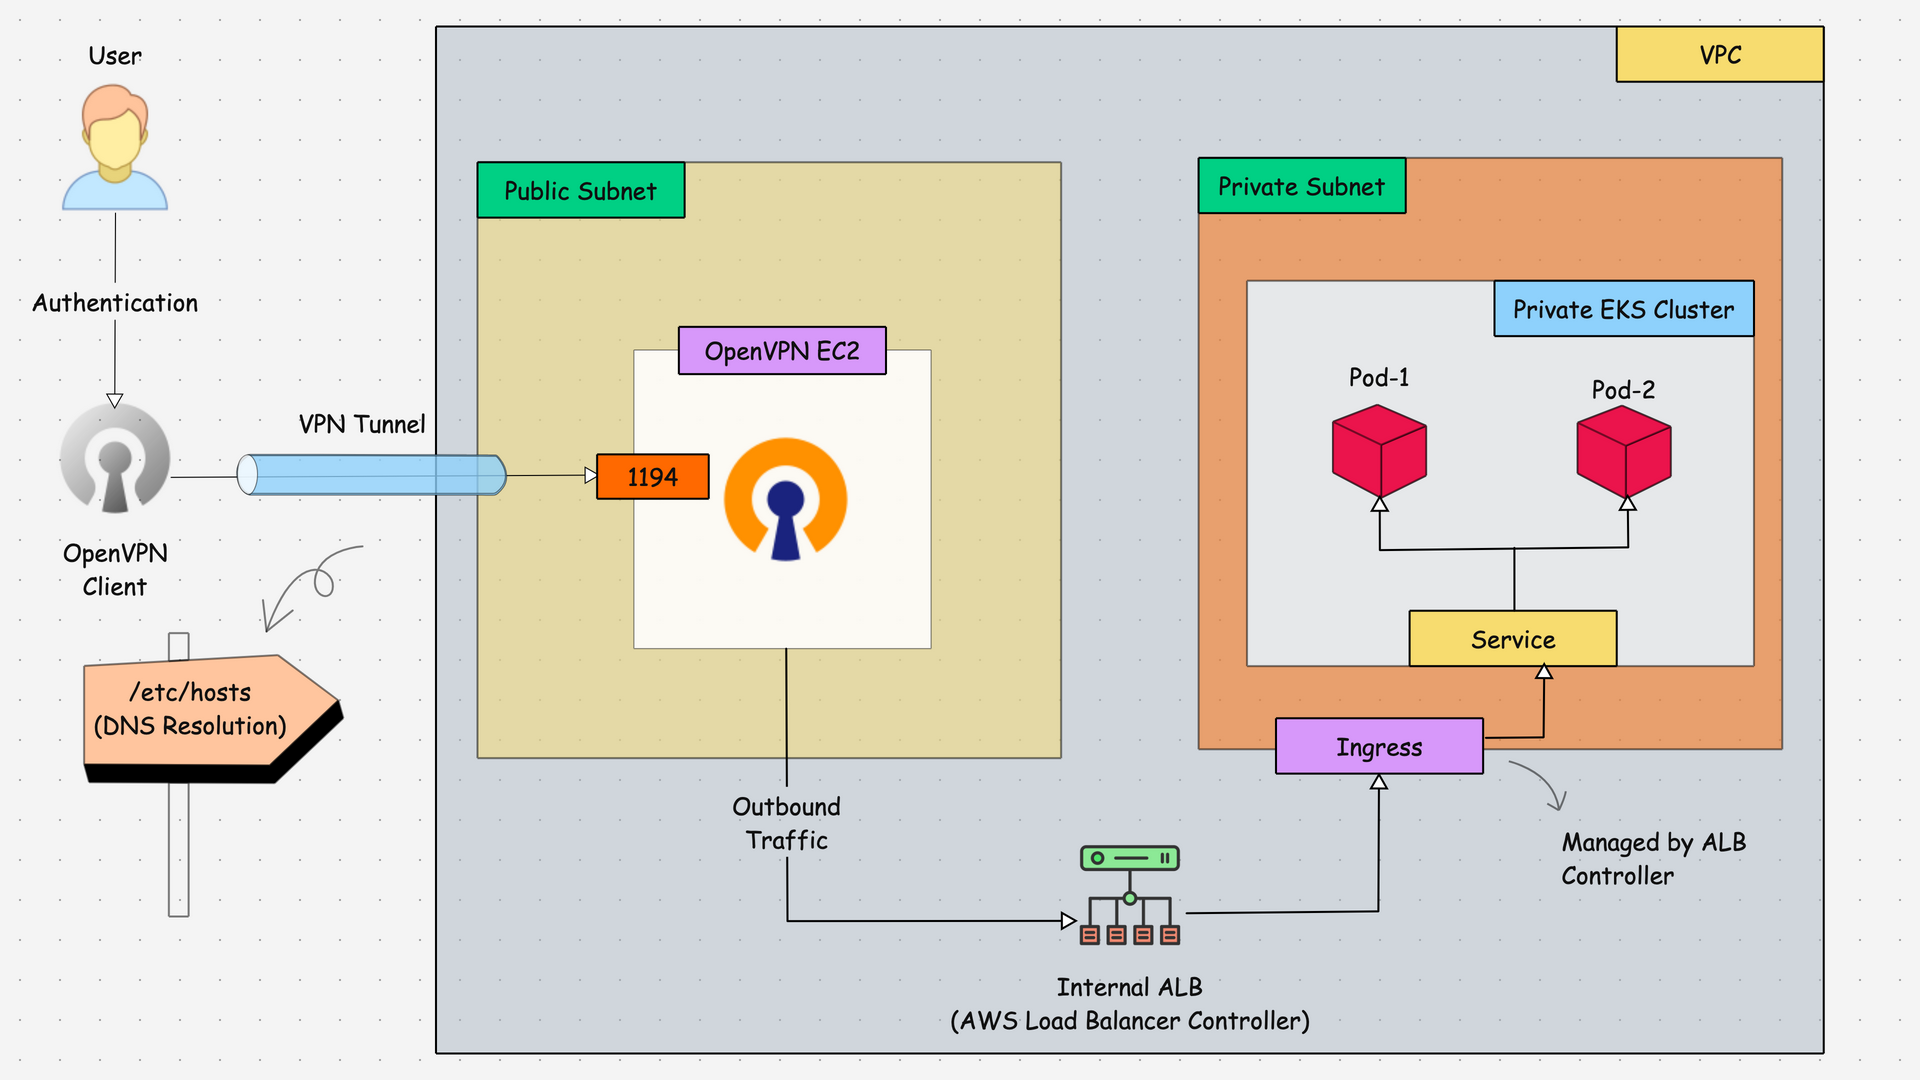
The above diagram explains,
- The OpenVPN community edition will be installed in the EC2 instance (Amazon Linux 2) with the public subnet, because the server needs internet access.
- After the installation of the VPN Server, we will generate a client configuration file for the connection implementation.
- Once the user (Client) gets the configuration file, it will be imported into the OpenVPN Client app to establish the connection to the VPN Server, so the connection will be established.
- Through the secure connection implemented, we can connect to the private EKS resources, which are implemented on private subnets.
Overall Setup
We will deploy the Prometheus stack on the private EKS cluster for testing purposes so that we will know how we are able to access its dashboard from our local machine.
But you can install anything, such as a private Nginx server pod, which is also ok for testing.
After the deployment, we will test the connection using the Node Port service as well as the internal load balancer with the help of the AWS Load Balancer Controller and Ingress object.
Setup Prerequisites
- A VPC with Public Subnets (Where OpenVPN gets deployed)
- A bastion host/jump server deployed in the EKS VPC to access to EKS cluster.
- A Running Private EKS cluster (>= v1.30)
- Helm installed and configured on the local system to deploy apps to EKS.
Set OpenVPN Server
We have covered the OpenVPN server setup in detail in a separate blog.
It covers the following topics,
- Setting up OpenVPN on Amazon Linux
- OpenVPN server configuration
- OpenVPN Client Cert Configuration
- Validating VPN Tunnel Configurations.
Refer: OpenVPN Server In EC2
Once you have the VPN server up and running in the public subnet, proceed to the Following.
Deploy a Bastion Server in EKS VPC
To directly access the private EKS cluster, we need a jump server on the same VPN with internet access.
So, we create an Ubuntu server on the same VPC of the EKS cluster, but the difference is that we use the public subnet instead.
Once the instance is created, you need to add the instance profile (IAM Role) with the required permission to access the cluster, or you can add the IAM user's credentials, such as the access key and secret access key for the cluster access.
Ensure that all the necessary tools, such as AWS CLI, Helm, Kubectl, and Eksctl, are bastion servers available in the cluster management.
Once every thing is set, use the following command to, update the kubeconfig to the bastion server.
aws eks update-kubeconfig --name <CLUSTER_NAME> --region <REGION>Note: Add a rule in Private EKS cluster's security group to enable port 443 to the bastion server for API access.Note: Add the instance profile or the IAM user, which is using on the bastion server for access should be updated on the EKS clusters access section.
Now, we can deploy the demo apps on the private EKS cluster for the testing.
Deploy Prometheus Stack in Private EKS Cluster
To achieve this, we need to expose the applications with Node Port service, so I am creating a new values.yaml file to deploy the Prometheus stack with Node Port service.
Create a values file for the Prometheus stack Helm deployment
cat <<EOF > node-port-values.yaml
grafana:
  service:
    type: NodePort
    nodePort: 30000

prometheus:
  service:
    type: NodePort
    nodePort: 30001

alertmanager:
  service:
    type: NodePort
    nodePort: 30002
EOF
To add the Prometheus Operator repo, use the following command.
helm repo add prometheus-community https://prometheus-community.github.io/helm-chartsTo install the Prometheus Operator stack with a custom values file, use the following command.
helm install prometheus prometheus-community/kube-prometheus-stack -n monitoring --create-namespace -f node-port-values.yamlOnce the installation is completed, you can see the status of the deployments and the services.
kubectl -n monitoring get po,svc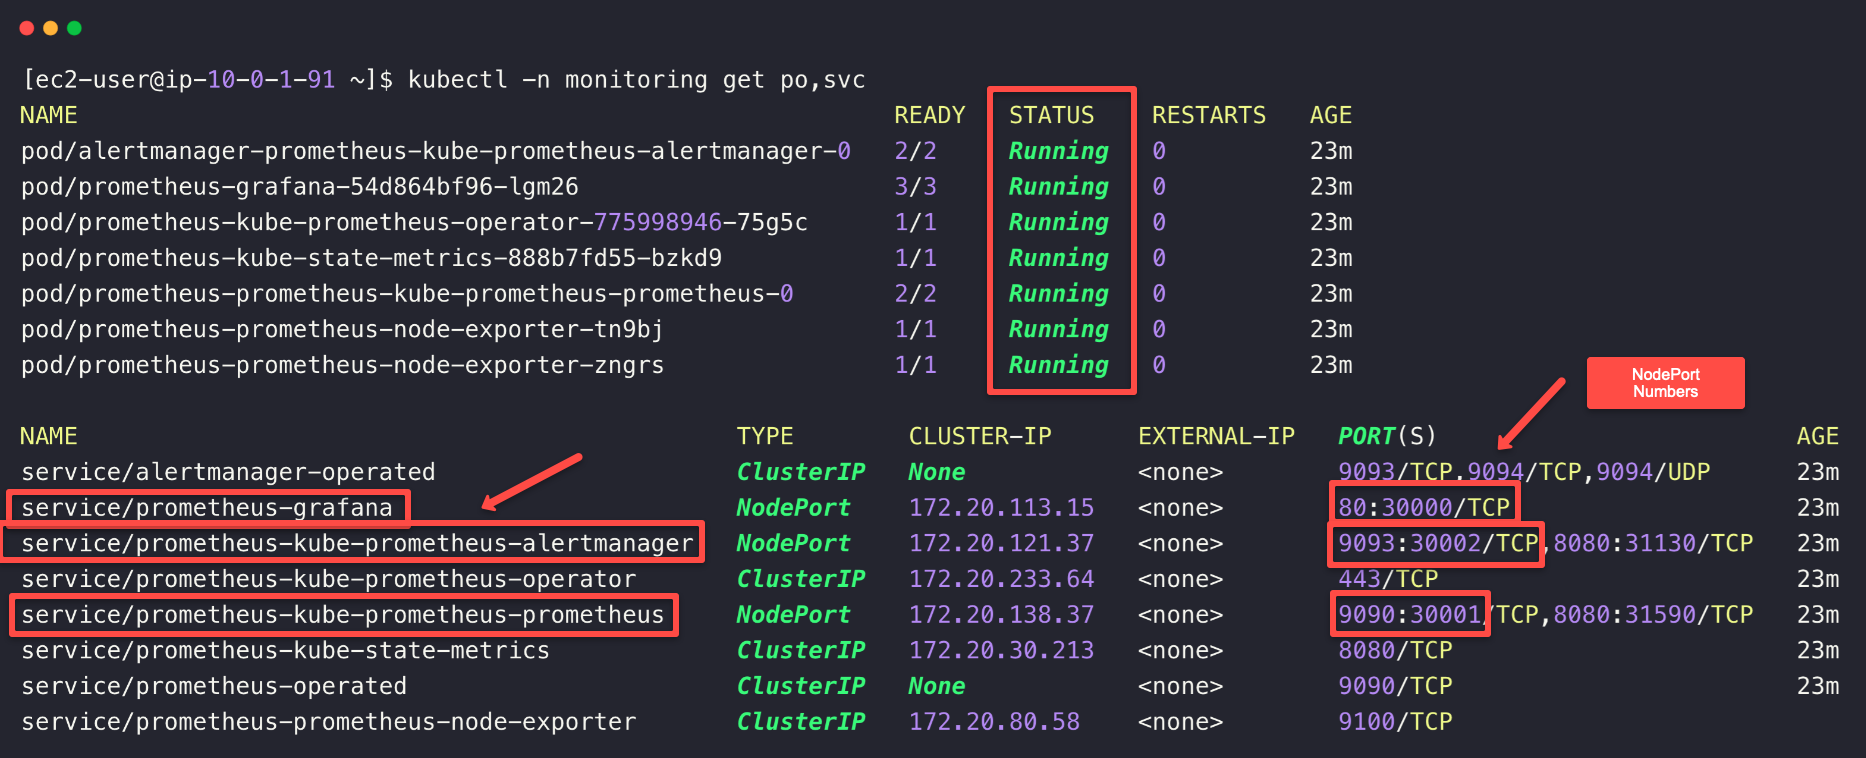
NodePort number. We need to enable these Ports on the Private EKS cluster security group to be accessed from OpenVPN server.
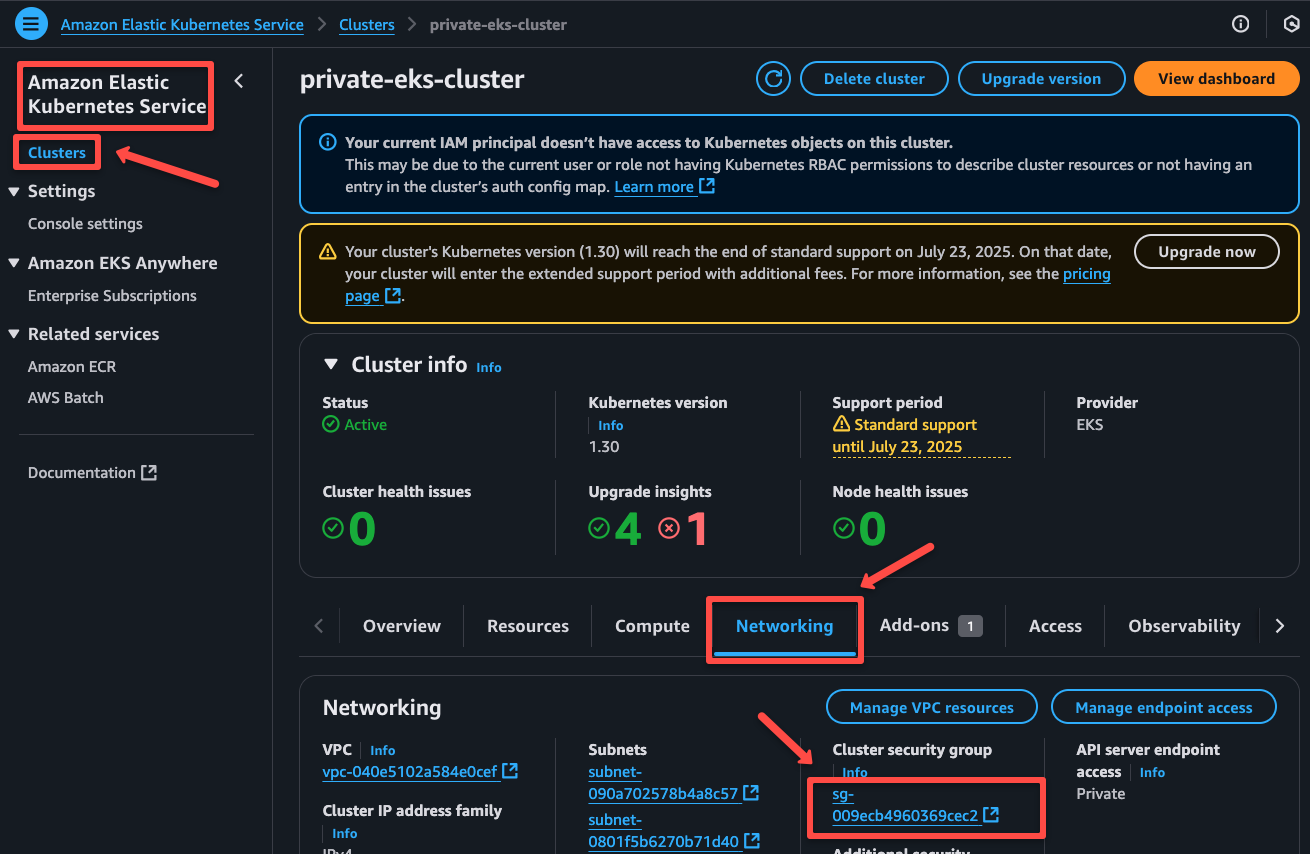
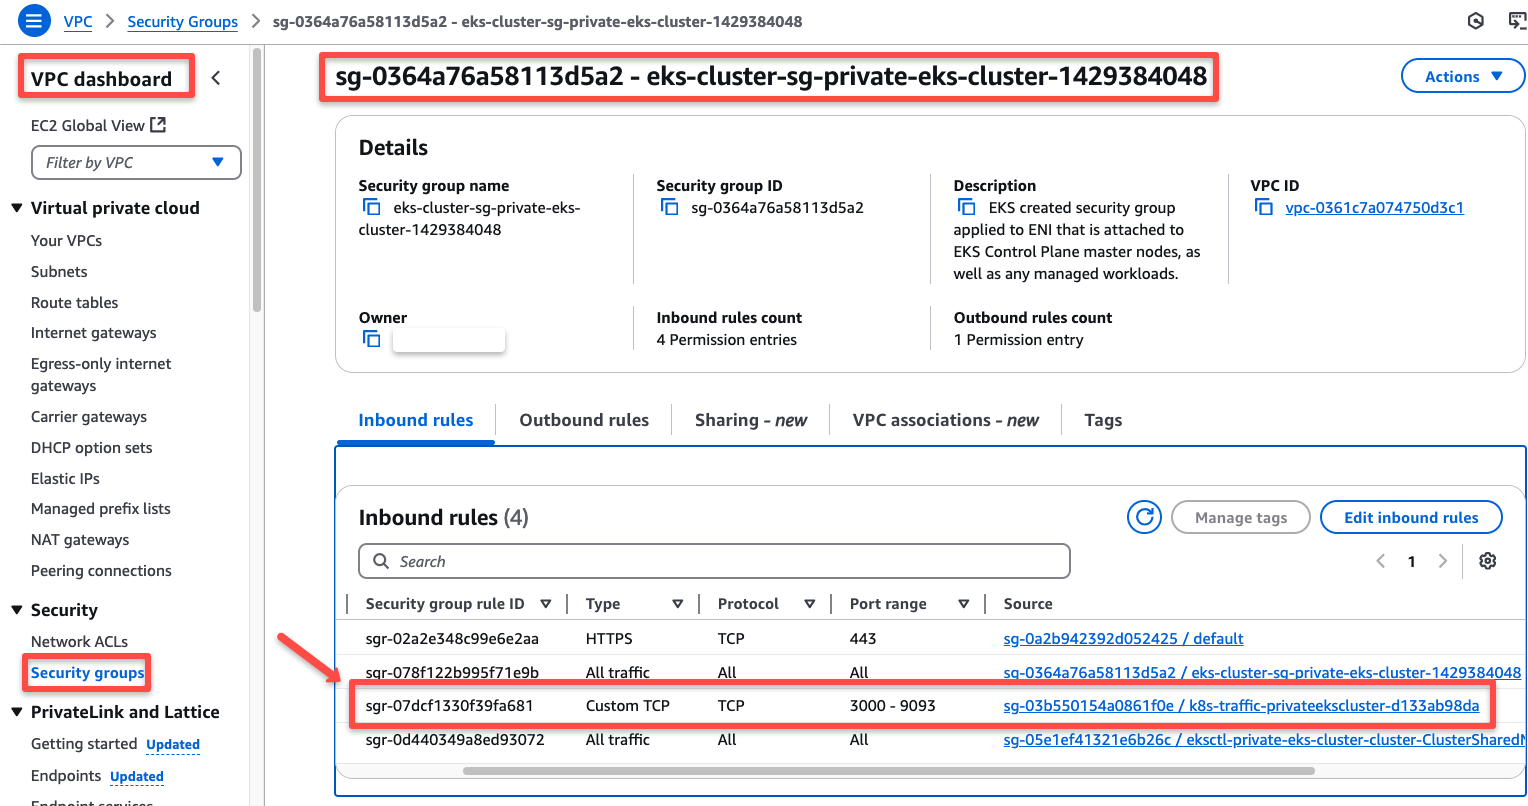
Navigate to the EKS dashboard and open the Networking section and click the cluster security group of the cluster.
Need to add three inbound rules for Grafana (30000), Prometheus (30001), and Alertmanager (30002) NodePorts.
As highlighted in the following image, we need to add the port, and in the source, you need to add the security group ID of the OpenVPN server. This will allow the OpenVPN server to access these ports on the EKS cluster.
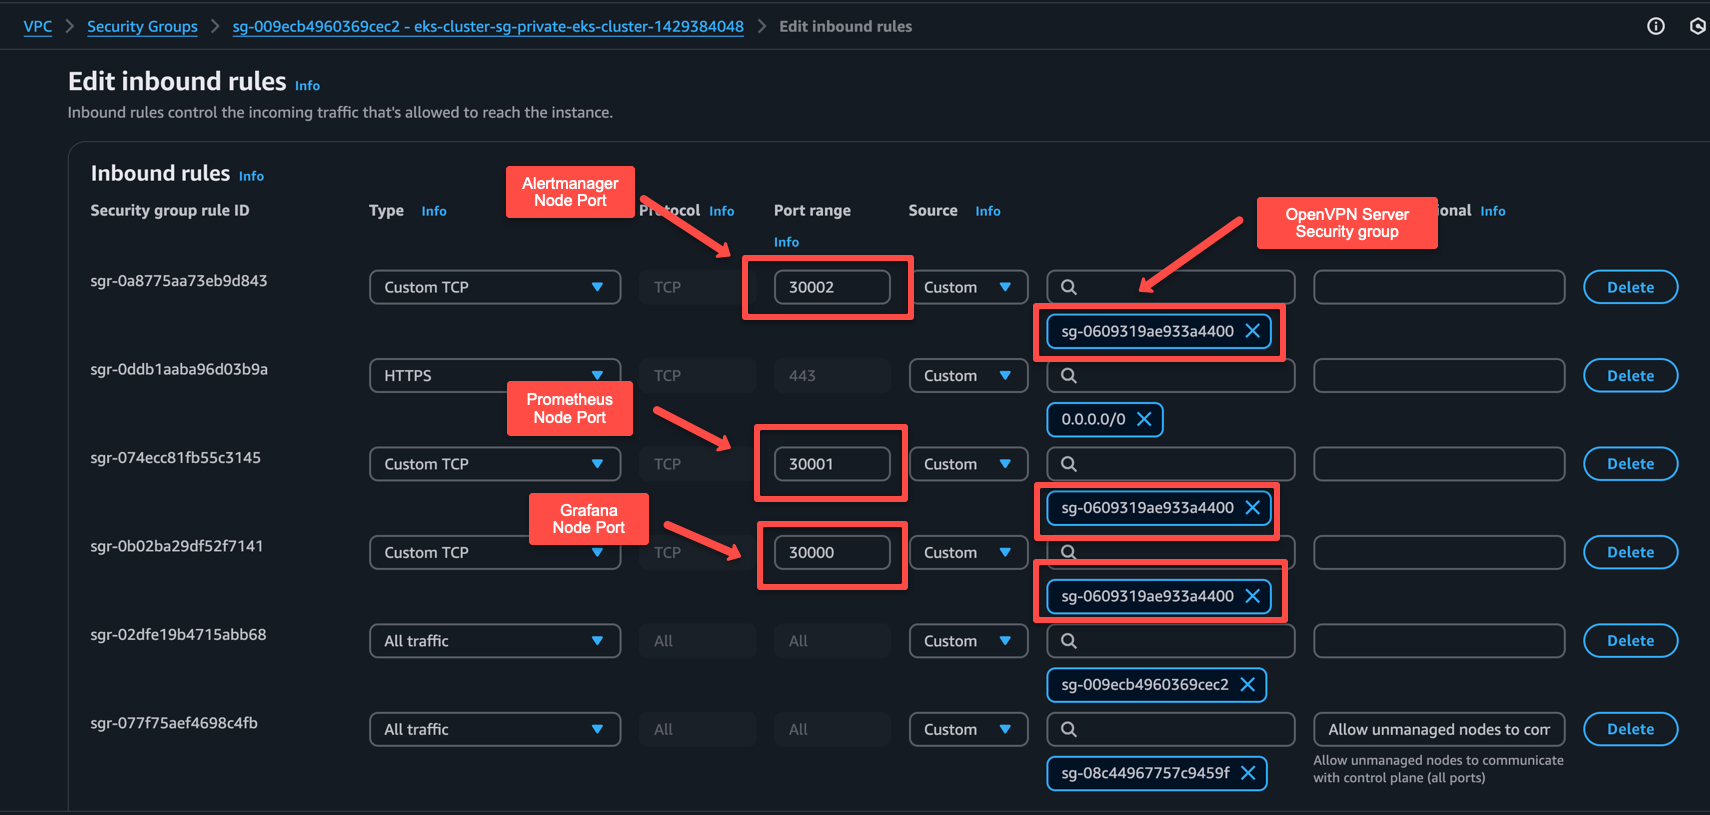
Save the security groups rules. Next step is to validate the connectivity from VPN.
Validate VPN to Cluster Connectivity
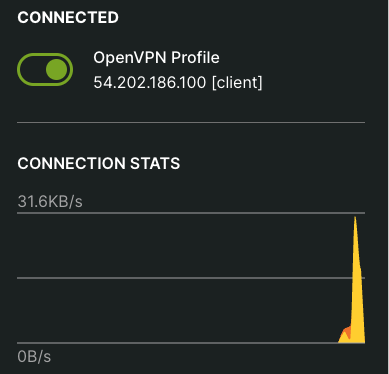
First , ensure the OpenVPN connection is active.
To test the connection, we need any of the EKS cluster node's private IP and the NodePort number of the service.
To get the node's IP, use the following kubectl command.
kubectl get no -o wide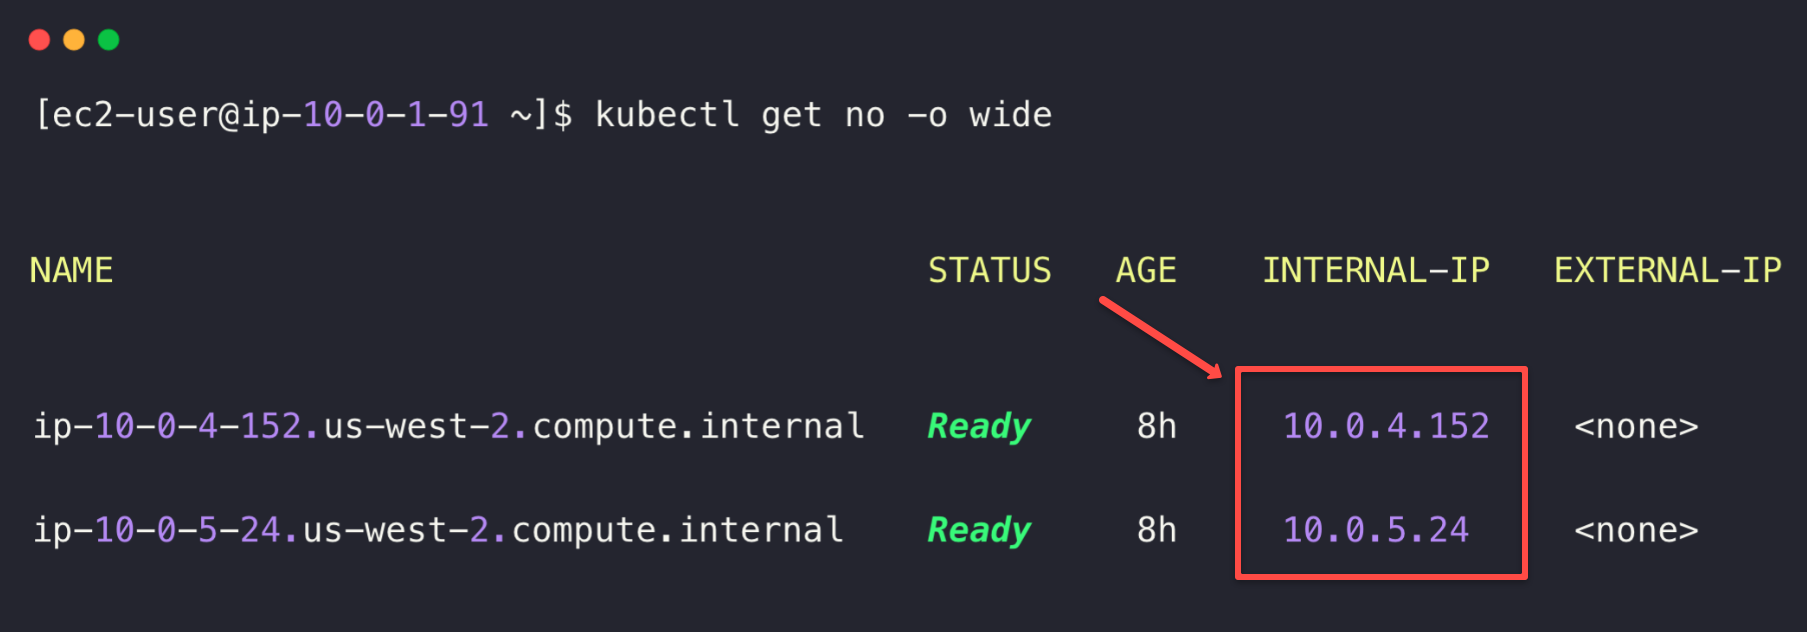
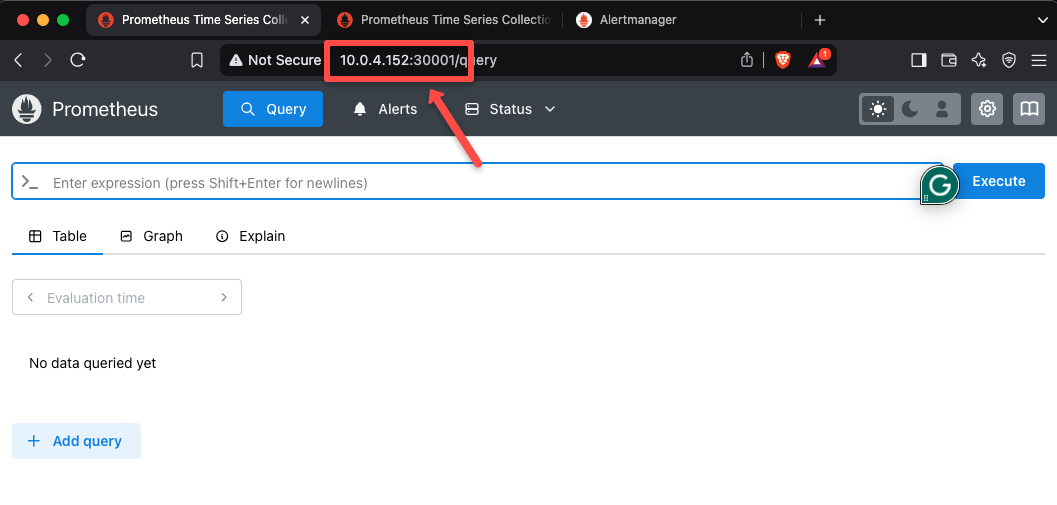
Now, lets try accessing the Prometheus dashboard.
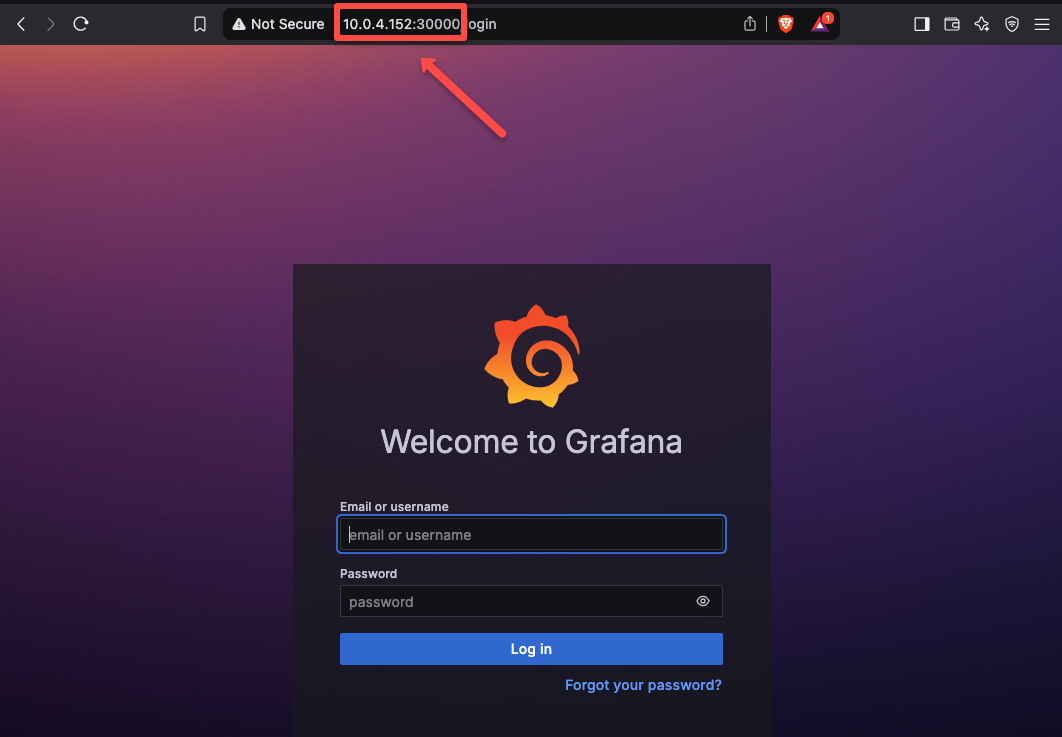
Open any of the web browsers from the local machine and paste the <NODE_IP>:30001
As shown below, you should be able to access the Prometheus dashboard using the Private IP of the EKS node.
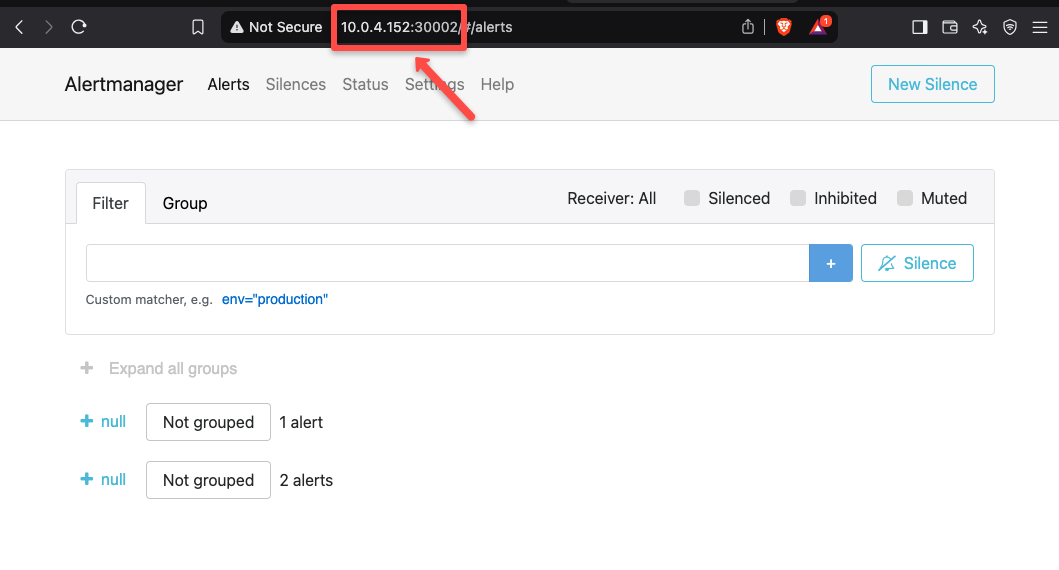
For Alertmanager Dashboard, access <NODE_IP>:30002
To access Grafana Dashboard, access <NODE_IP>:30003
Using the IP method is ok for the testing purposes.
As you might know the EKS nodes are ephemeral. Meaning when a node gets deleted and recreated, the IP will changed. So you cannot rely on worker node IPs.
To avoid this, we need to expose the services with an Internal Load Balancer. Then with the load balancer IP or DNS name, we can access the applications with the static endpoint without worrying about IP changes.
Expose Applications via an Internal AWS Load Balancer
Assuming you will have more than one applications to access, you will need a ingress based setup. Or else you will have to deploy one loadbalancer for each service which gets expensive.
For ingress to work, we need the AWS load balancer controller.
We have covered the installation and setup of the AWS Load Balancer Controller, in a different blog.
Refer: AWS Load Balancer Controller on EKS
kubernetes.io/role/internal-elb: 1Update Prometheus Service to Cluster IP
For this, we don't have to deploy the Prometheus stack with Node Port service, instead we can use the Cluster IP service, which is also the default deployment method.
To install the Prometheus stack with default configuration, use the following command.
helm install prometheus prometheus-community/kube-prometheus-stack -n monitoring --create-namespaceNow, we can check the services so that we can make sure the Prometheus components are deployed in ClusterIP services.
kubectl -n monitoring get po,svc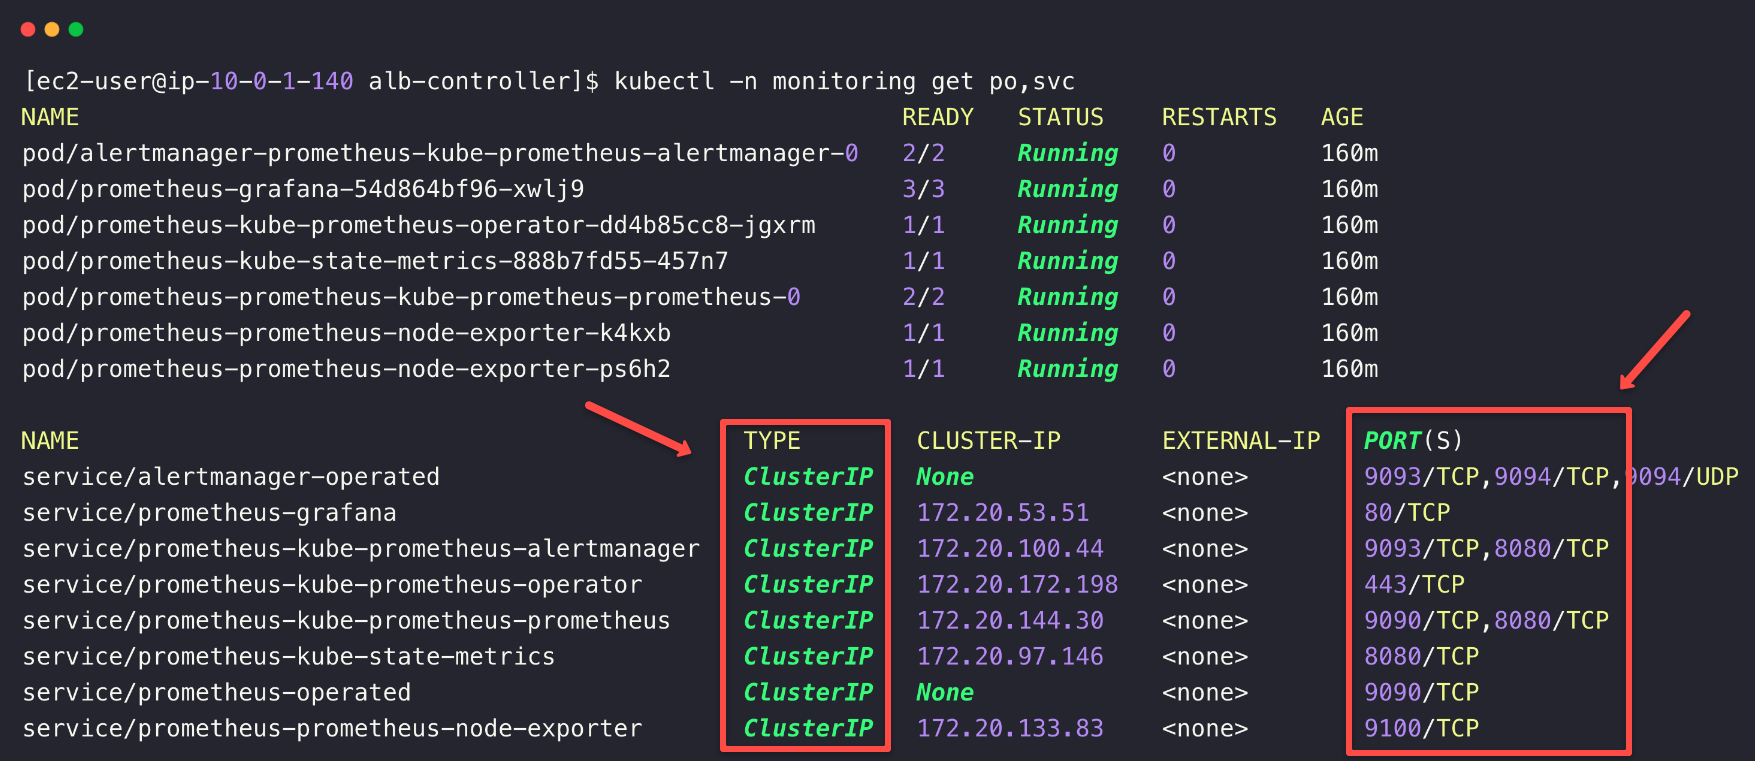
Once the AWS Load Balancer deployment is completed, an internal load balancer will automatically be provisioned when we deploy an ingress object.
Note down the Prometheus, Grafana, and Alertmanager service names and port numbers to create the ingress object.
Now, let's create an ingress object for the Prometheus stack.
cat <<EOF > ingress.yaml
apiVersion: networking.k8s.io/v1
kind: Ingress
metadata:
  name: monitoring-ingress
  namespace: monitoring
  annotations:
    alb.ingress.kubernetes.io/scheme: internal
    alb.ingress.kubernetes.io/target-type: ip
spec:
  ingressClassName: alb
  rules:
    - host: grafana.techiescamp.com
      http:
        paths:
          - path: /
            pathType: Prefix
            backend:
              service:
                name: prometheus-grafana
                port:
                  number: 80
    - host: prometheus.techeiscamp.com
      http:
        paths:
          - path: /
            pathType: Prefix
            backend:
              service:
                name: prometheus-kube-prometheus-prometheus
                port:
                  number: 9090
    - host: alertmanager.techiescamp.com
      http:
        paths:
          - path: /
            pathType: Prefix
            backend:
              service:
                name: prometheus-kube-prometheus-alertmanager
                port:
                  number: 9093
EOF
Here, I have used host names for each of the services, so we can easily remember the names.
Note: If you already have a domain in Route53 or GoDaddy, use that one for the application.
To deploy the Ingress object, use the following command.
kubectl apply -f ingress.yamlTo check the Ingress object,
kubectl -n monitoring get ingressTo describe the Ingress object.
kubectl -n monitoring describe ingress monitoring-ingress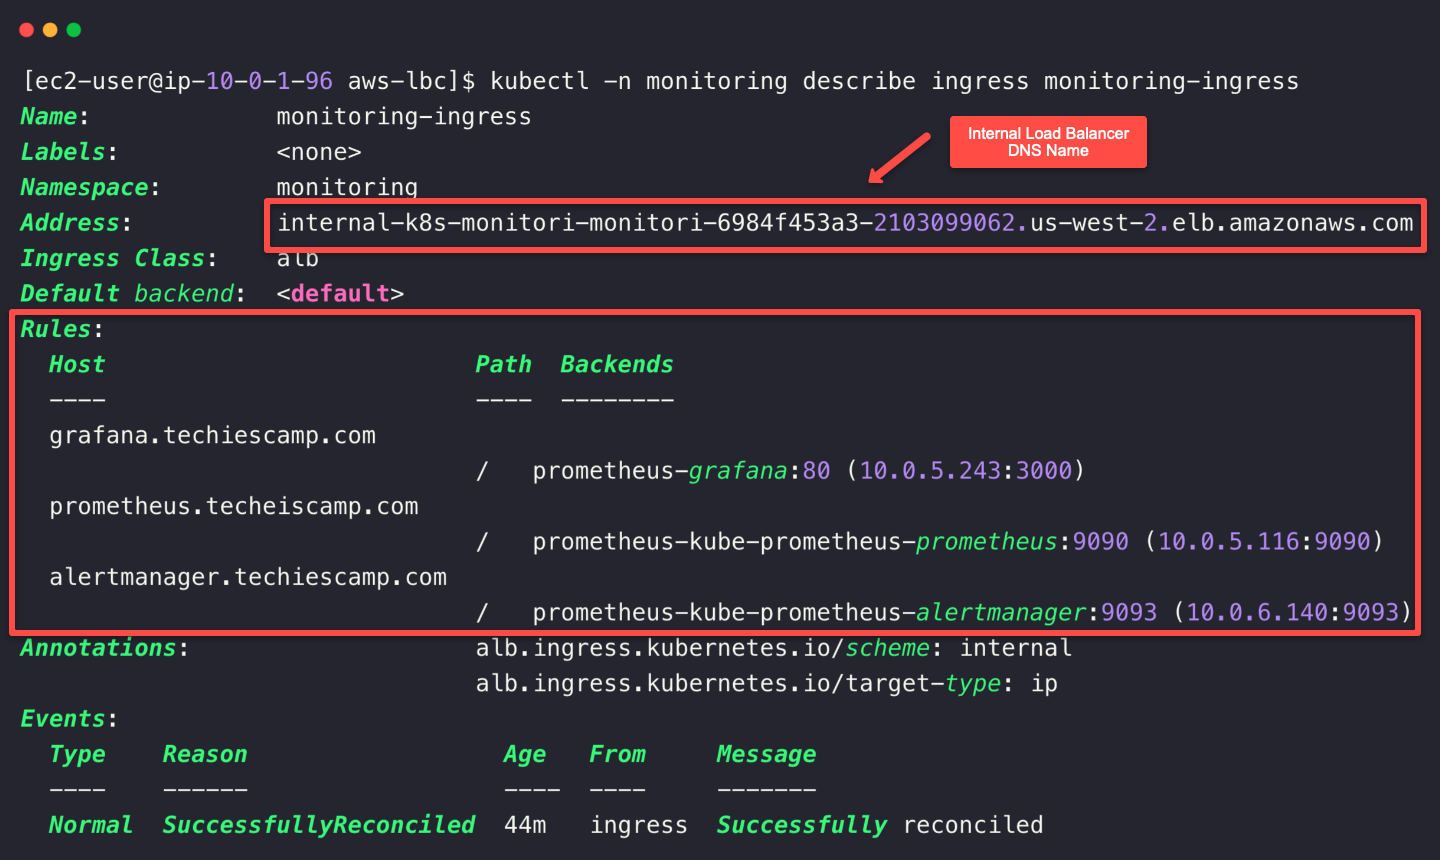
We can see that the Ingress is successfully created, which means the Internal Load Balancer was also automatically created.
Let's open the AWS console and ensure the Load Balancer is properly provisioned.
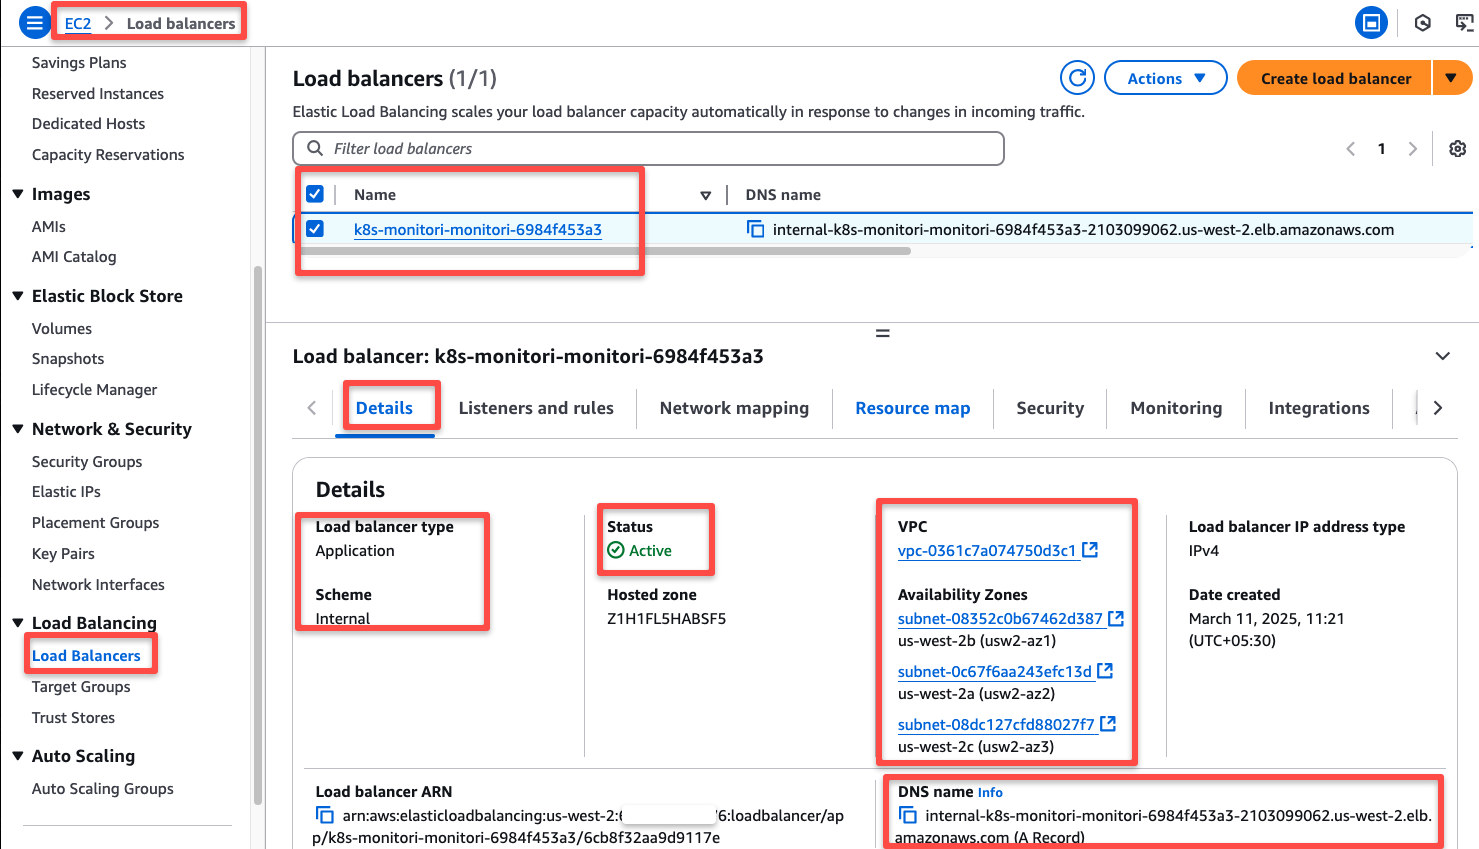
Note down the Internal Load Balancer DNS name for the upcoming configuration.
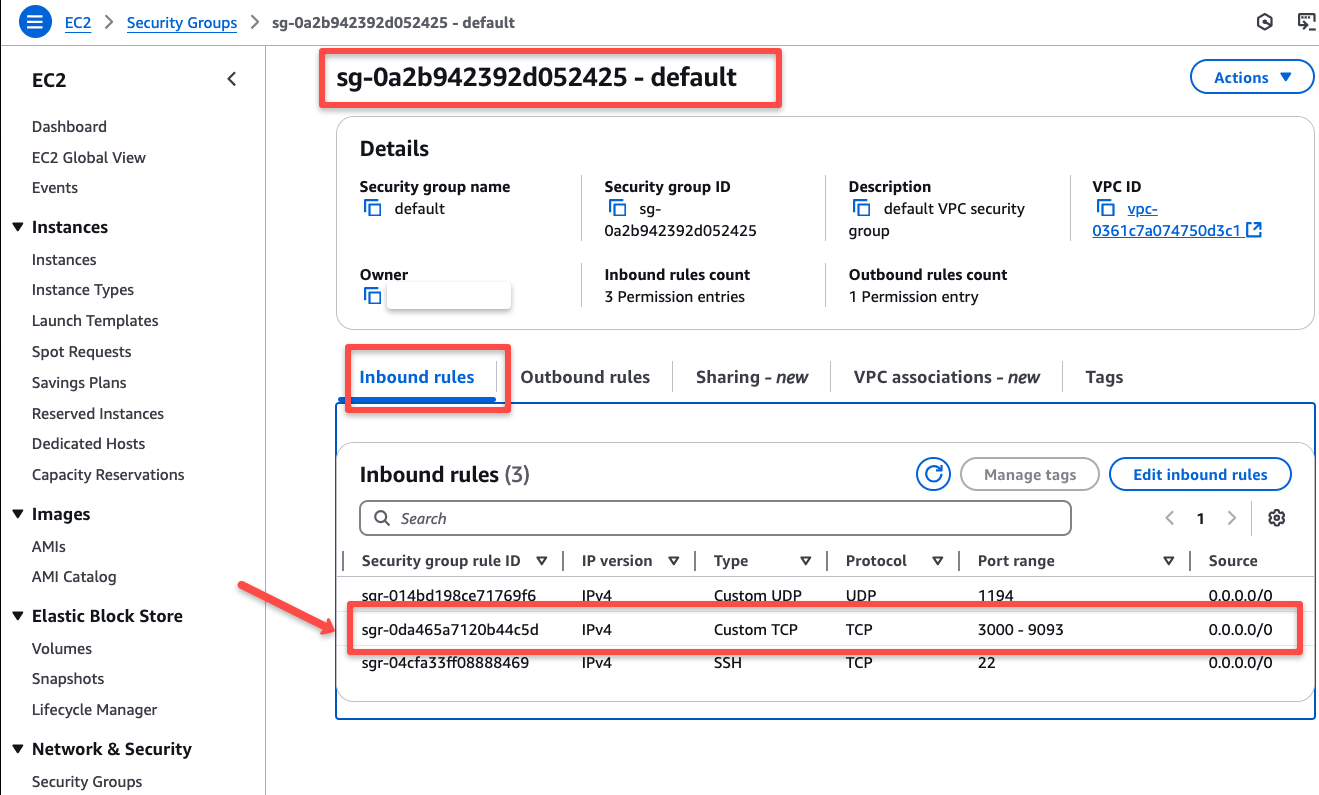
When we deploy the ingress and Load Balancer creation, a new rule will be added to the EKS cluster security group to expose the Ports of the ingress services.
We need to expose these same ports in the OpenVPN server's security group.
Local DNS Resolution for ILB
We can map the DNS records of the AWS Internal Load Balancer to the DNS servers if we have, or for testing purposes we can use the Local DNS resolution.
For this, first we need to identify the IP addresses of the Internal Load Balancer.
nslookup <INTERNAL_LOADBALANCER_DNS_NAME>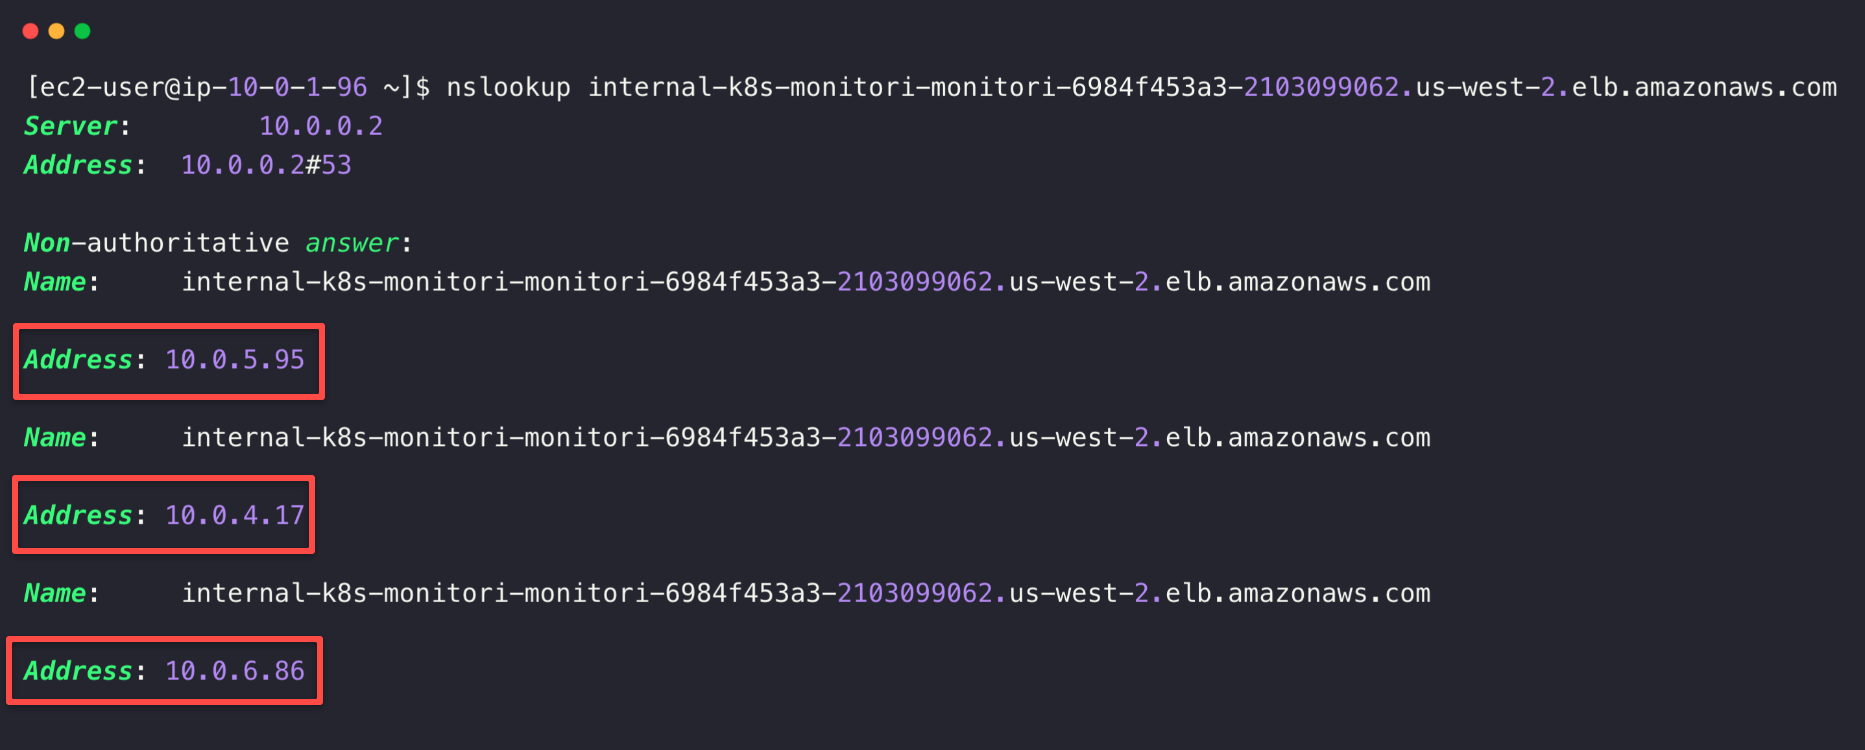
Copy the IP address and paste it to the /etc/hosts of your local machine and map the host names that we mentioned in the Ingress object.
sudo vim /etc/hosts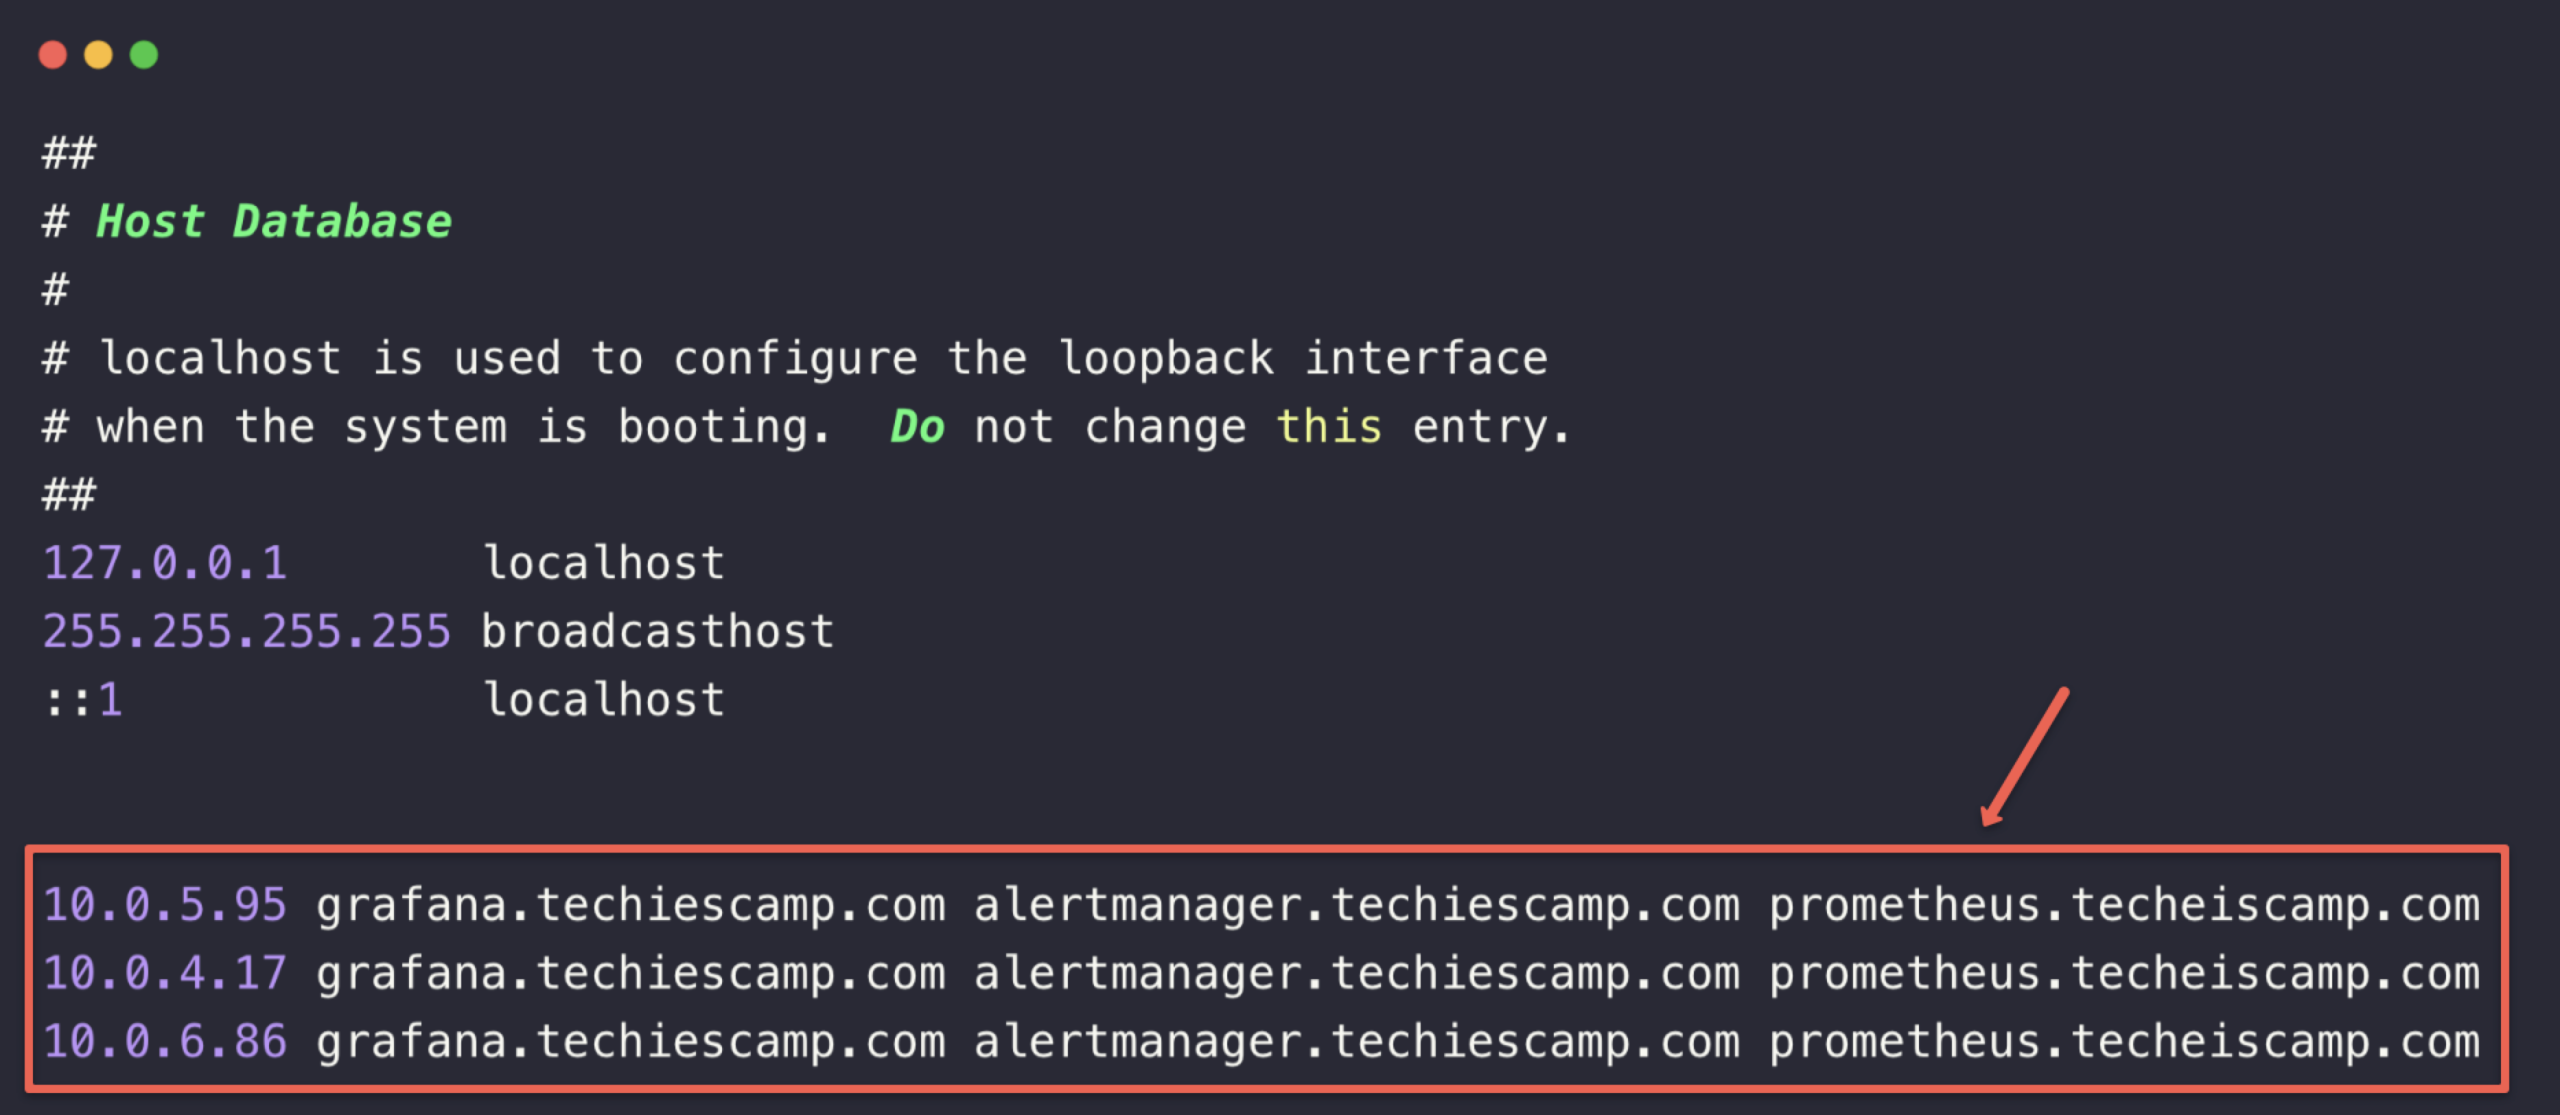
This will help to resolve the DNS query from the local machine.
Note: If you are using to map with DNS servers, make sure, you have private hosted zone.
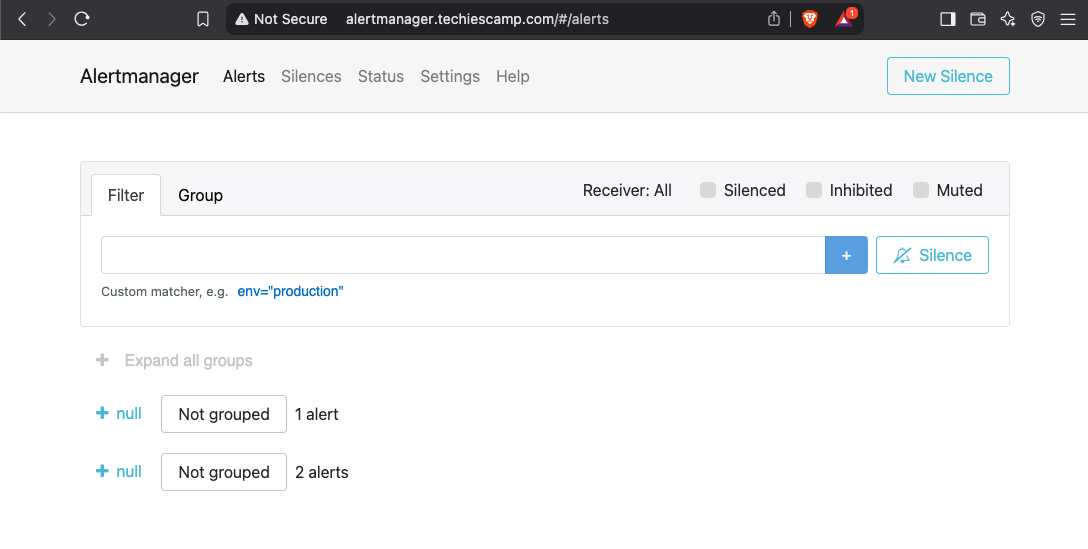
To access the dashboard, open any of the web browser and paste the hostname.
Prometheus Dashboard
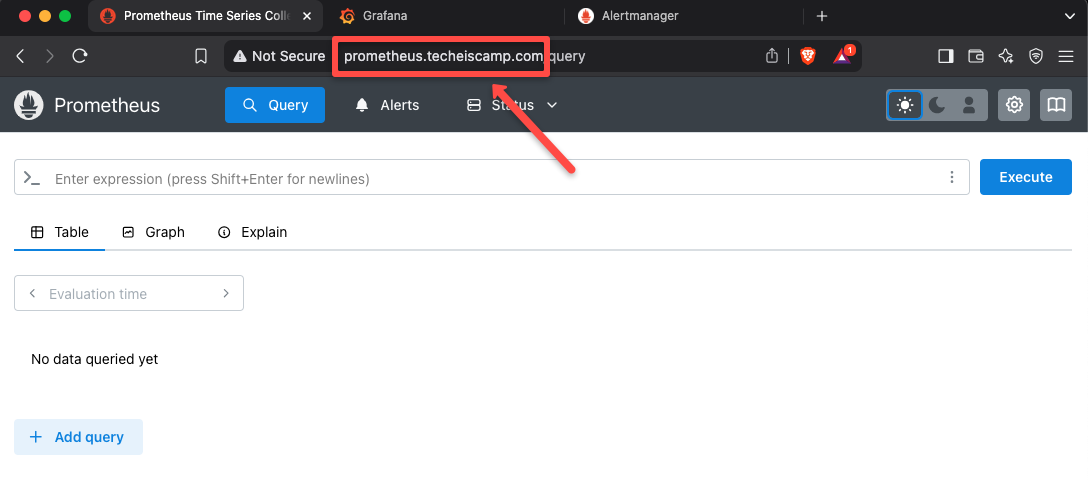
Grafana Dashboard
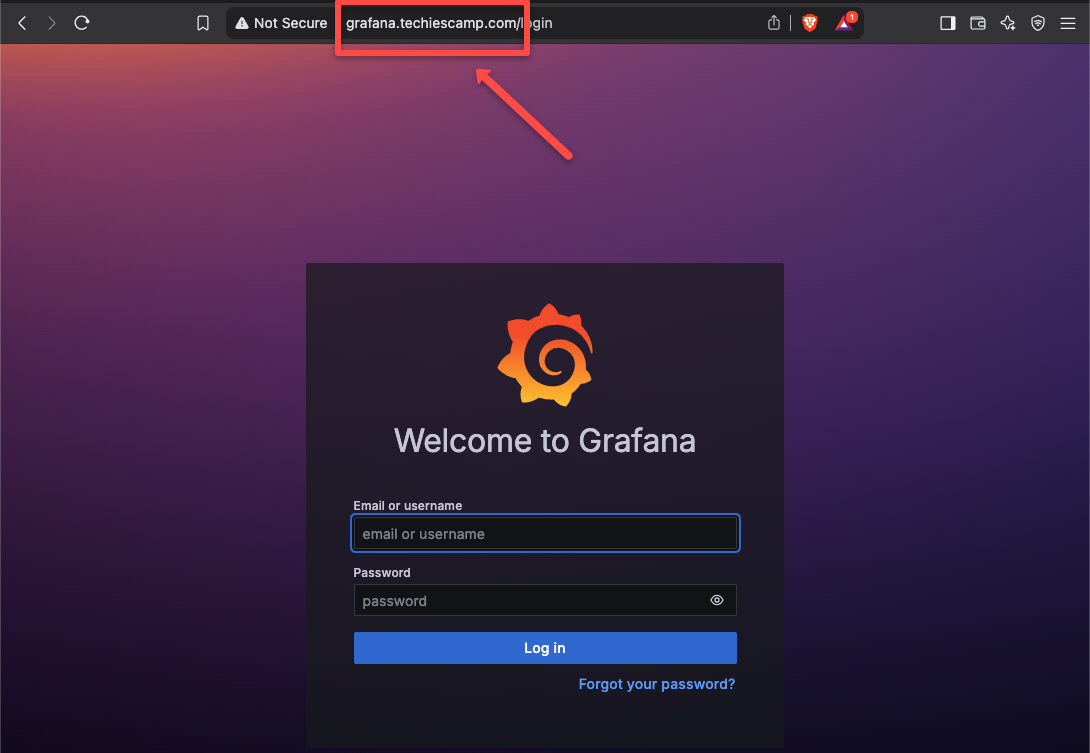
Alertmanager Dashboard
Conclusion
We have implemented the OpenVPN server to access the private EKS resources. This has created an encrypted tunnel over the Internet for secure communication.
This self-hosted VPN Server method is cost-effective for testing and small projects, especially since we are using the open-source version of OpenVPN, which has some limitations.
So if you want to implement for a big project or want the complete benefits, you can go with the enterprise edition or can use the AWS client VPN endpoint solution.
