

Node exporter is the best way to collect all the Linux server related metrics and statistics for monitoring.
Monitor Linux Servers Using Prometheus
In this guide, you will learn how to setup Prometheus node exporter on a Linux server to export all node level metrics to the Prometheus server.
Before You Begin
- Prometheus Node Exporter needs Prometheus server to be up and running. If you would like to setup Prometheus, please see the Prometheus setup guide for Linux.
- Port 9100 opened in server firewall as Prometheus reads metrics on this port.
Setup Node Exporter Binary
Step 1: Download the latest node exporter package. You should check the Prometheus downloads section for the latest version and update this command to get that package.
cd /tmp
curl -LO https://github.com/prometheus/node_exporter/releases/download/v0.18.1/node_exporter-0.18.1.linux-amd64.tar.gz
Step 2: Unpack the tarball
tar -xvf node_exporter-0.18.1.linux-amd64.tar.gzStep 3: Move the node export binary to /usr/local/bin
sudo mv node_exporter-0.18.1.linux-amd64/node_exporter /usr/local/bin/Create a Custom Node Exporter Service
Step 1: Create a node_exporter user to run the node exporter service.
sudo useradd -rs /bin/false node_exporterStep 2: Create a node_exporter service file under systems.
sudo vi /etc/systemd/system/node_exporter.serviceStep 3: Add the following service file content to the service file and save it.
[Unit]
Description=Node Exporter
After=network.target

[Service]
User=node_exporter
Group=node_exporter
Type=simple
ExecStart=/usr/local/bin/node_exporter

[Install]
WantedBy=multi-user.target
Step 4: Reload the system daemon and star the node exporter service.
sudo systemctl daemon-reload
sudo systemctl start node_exporter
Step 5: check the node exporter status to make sure it is running in the active state.
sudo systemctl status node_exporterStep 6: Enable the node exporter service to the system startup.
sudo systemctl enable node_exporterNow, node exporter would be exporting metrics on port 9100.
You can see all the server metrics by visiting your server URL on /metrics as shown below.
http://<server-IP>:9100/metricsConfigure the Server as Target on Prometheus Server
Now that we have the node exporter up and running on the server, we have to add this server a target on the Prometheus server configuration.
Note: This configuration should be done on the Prometheus server.
Step 1: Login to the Prometheus server and open the prometheus.yml file.
sudo vi /etc/prometheus/prometheus.ymlStep 2: Under the scrape config section add the node exporter target as shown below. Change 10.142.0.3 with your server IP where you have setup node exporter. Job name can be your server hostname or IP for identification purposes.
- job_name: 'node_exporter_metrics'
  scrape_interval: 5s
  static_configs:
    - targets: ['10.142.0.3:9100']
Step 3: Restart the prometheus service for the configuration changes to take place.
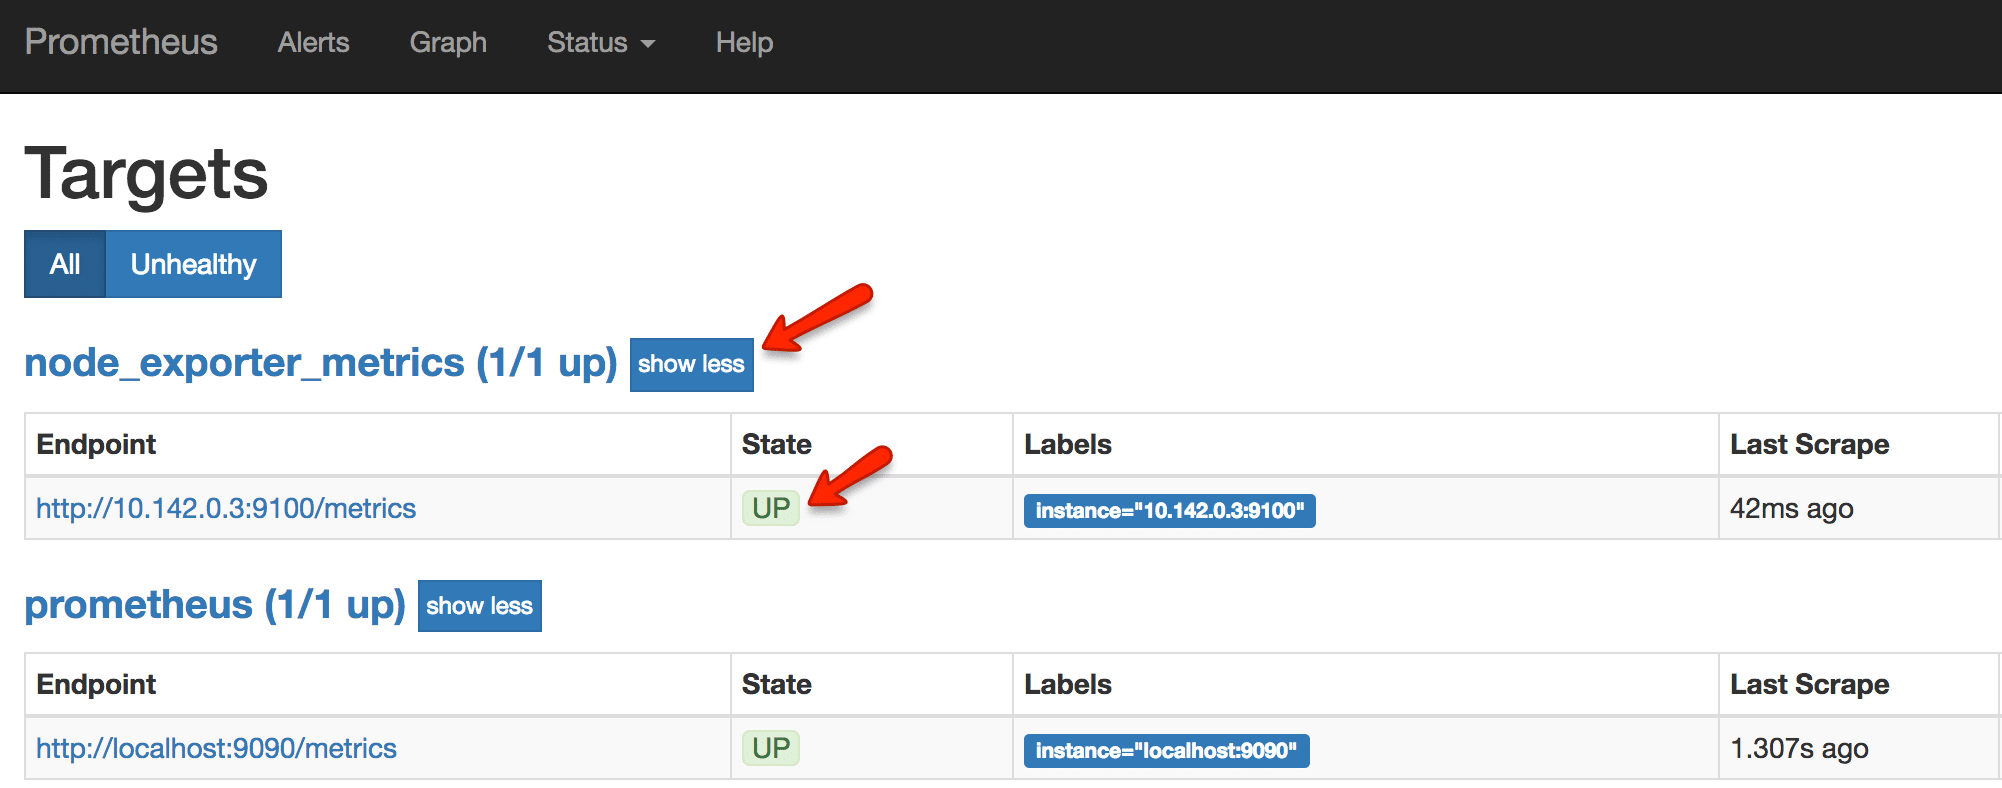
sudo systemctl restart prometheusNow, if you check the target in prometheus web UI (http://<prometheus-IP>:9090/targets) , you will be able to see the status as shown below.
Also, you can use the Prometheus expression browser to query for node related metrics. Following are the few key node metrics you can use to find its statistics.
node_memory_MemFree_bytes
node_cpu_seconds_total
node_filesystem_avail_bytes
rate(node_cpu_seconds_total{mode="system"}[1m])
rate(node_network_receive_bytes_total[1m])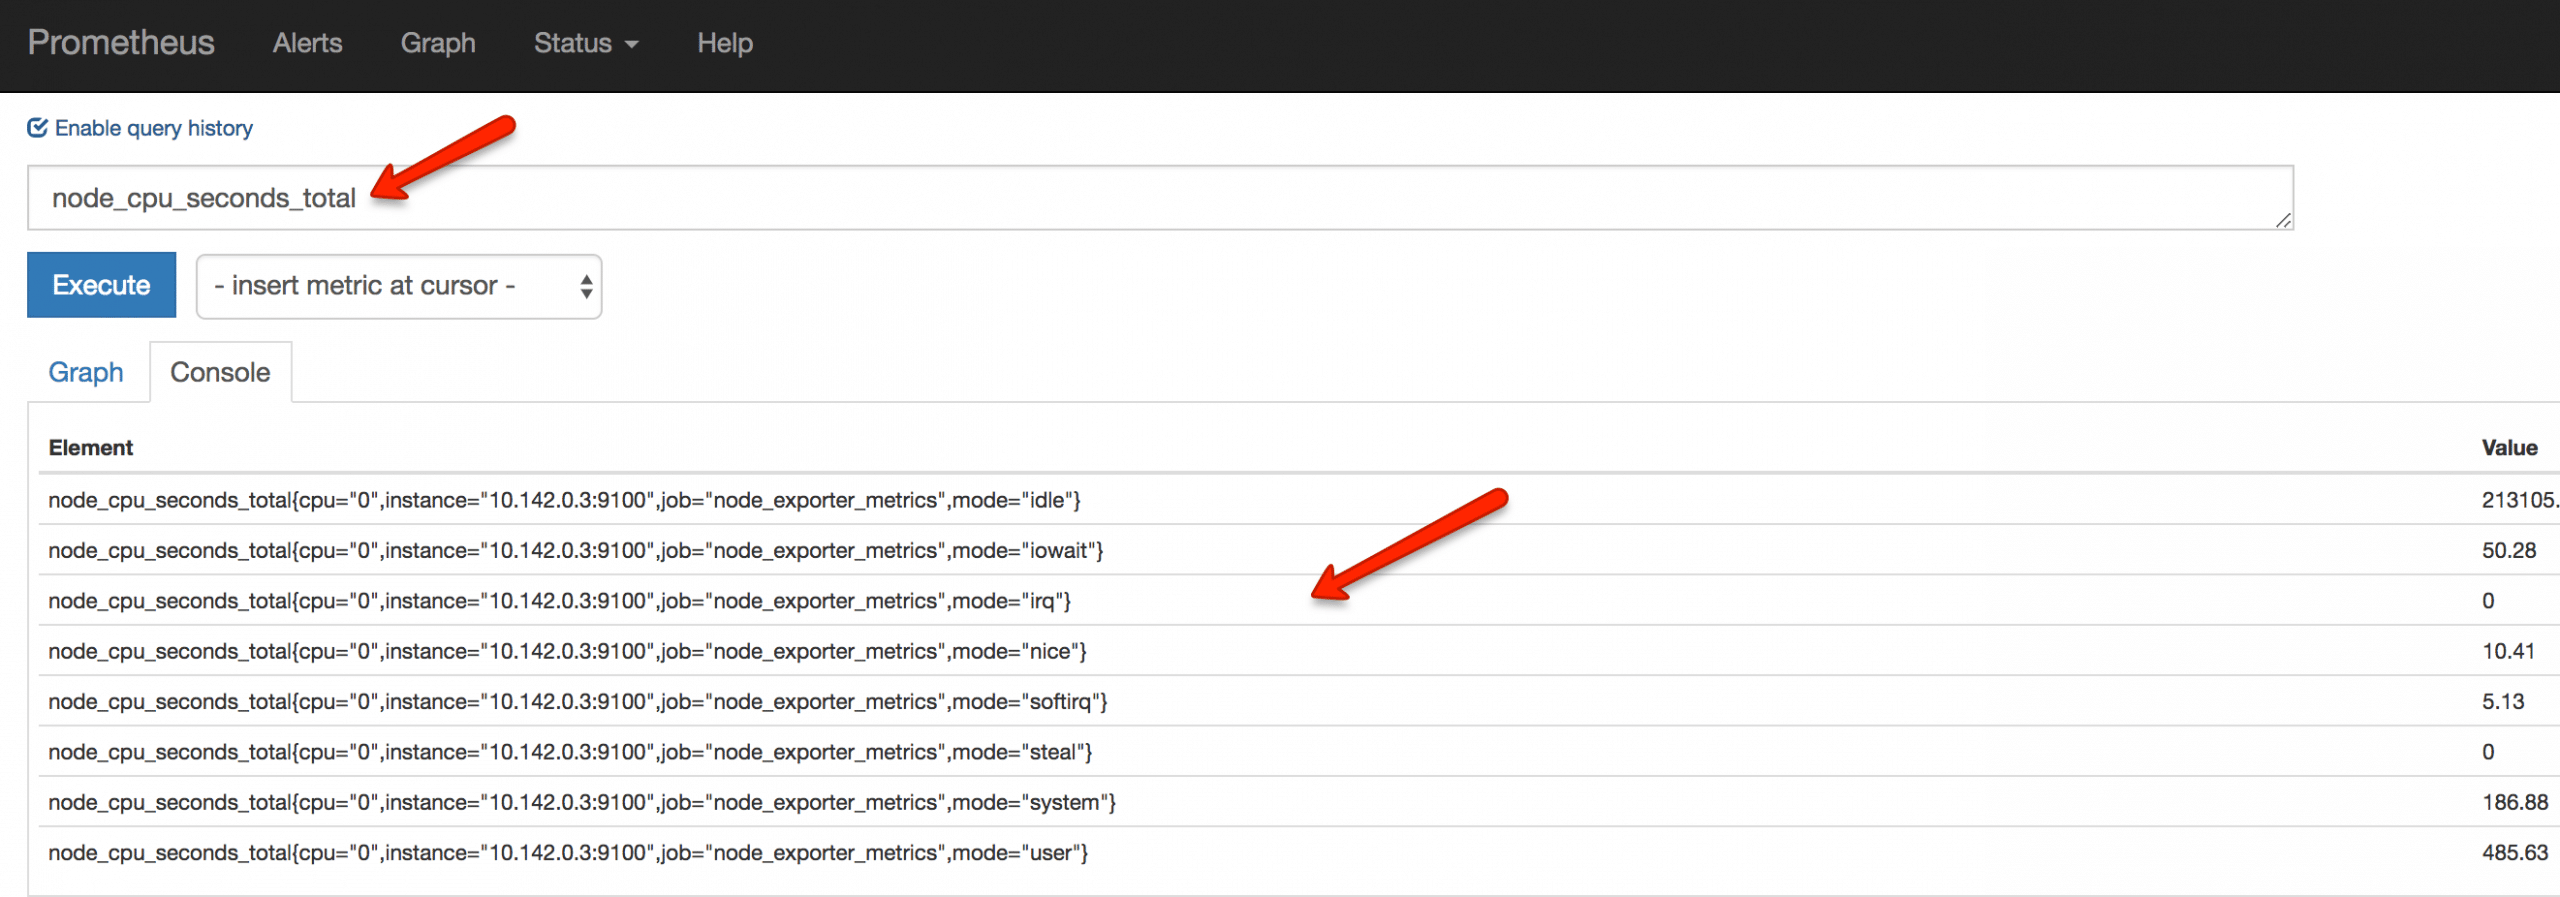
Follow "Integrate And Visualize Prometheus Metrics In Grafana" blog to visualize the node exporter metrics in Grafana.
