AlertManager is an open-source alerting system that works with the Prometheus Monitoring system. This blog is part of the Prometheus Kubernetes tutorial series.
In our previous posts, we have looked at the following.
In this guide, I will cover the Alert Manager setup and its integration with Prometheus.
Alertmanager on Kubernetes
Alert Manager setup has the following key configurations.
- A config map for AlertManager configuration
- A config Map for AlertManager alert templates
- Alert Manager Kubernetes Deployment
- Alert Manager service to access the web UI.
Important Setup Notes
You should have a working Prometheus setup up and running.
Prometheus should have the correct alert manager service endpoint in its config.yaml as shown below to send the alert to Alert Manager.
alerting:
   alertmanagers:
      - scheme: http
        static_configs:
        - targets:
          - "alertmanager.monitoring.svc:9093"
All the alerting rules have to be present on Prometheus config based on your needs. It should be created as part of the Prometheus config map with a file named prometheus.rules and added to the config.yaml in the following way.
rule_files:
      - /etc/prometheus/prometheus.rules
Alert manager alerts can be written based on the metrics you receive on Prometheus.
For receiving emails for alerts, you need to have a valid SMTP host in the alert manager config.yaml (smarthost parameter). You can customize the email template as per your needs in the Alert Template config map. We have given the generic template in this guide.
Let's get started with the setup.
Alertmanager Kubernetes Manifests
All the Kubernetes manifests used in this tutorial can be found in this Github link.
Clone the Github repository using the following command.
git clone https://github.com/bibinwilson/kubernetes-alert-manager.gitConfig Map for Alert Manager Configuration
Alert Manager reads its configuration from a config.yaml file. It contains the configuration of alert template path, email, and other alert receiving configurations.
In this setup, we are using email and slack webhook receivers. You can have a look at all the supported alert receivers from here.
Create a file named AlertManagerConfigmap.yaml and copy the following contents.
kind: ConfigMap
apiVersion: v1
metadata:
  name: alertmanager-config
  namespace: monitoring
data:
  config.yml: |-
    global:
    templates:
    - '/etc/alertmanager/*.tmpl'
    route:
      receiver: alert-emailer
      group_by: ['alertname', 'priority']
      group_wait: 10s
      repeat_interval: 30m
      routes:
        - receiver: slack_demo
        # Send severity=slack alerts to slack.
          match:
            severity: slack
          group_wait: 10s
          repeat_interval: 1m

    receivers:
    - name: alert-emailer
      email_configs:
      - to: demo@devopscube.com
        send_resolved: false
        from: from-email@email.com
        smarthost: smtp.eample.com:25
        require_tls: false
    - name: slack_demo
      slack_configs:
      - api_url: https://hooks.slack.com/services/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sz4Qk
        channel: '#devopscube-demo'
Let's create the config map using kubectl.
kubectl create -f AlertManagerConfigmap.yamlConfig Map for Alert Template
We need alert templates for all the receivers we use (email, Slack, etc). Alert manager will dynamically substitute the values and deliver alerts to the receivers based on the template. You can customize these templates based on your needs.
Create a file named AlertTemplateConfigMap.yaml and copy the contents from this file link ==> Alert Manager Template YAML
Create the configmap using kubectl.
kubectl create -f AlertTemplateConfigMap.yamlCreate a Deployment
In this deployment, we will mount the two config maps we created.
Create a file called Deployment.yaml with the following contents.
apiVersion: apps/v1
kind: Deployment
metadata:
  name: alertmanager
  namespace: monitoring
spec:
  replicas: 1
  selector:
    matchLabels:
      app: alertmanager
  template:
    metadata:
      name: alertmanager
      labels:
        app: alertmanager
    spec:
      containers:
      - name: alertmanager
        image: prom/alertmanager:latest
        args:
          - "--config.file=/etc/alertmanager/config.yml"
          - "--storage.path=/alertmanager"
        ports:
        - name: alertmanager
          containerPort: 9093
        resources:
            requests:
              cpu: 500m
              memory: 500M
            limits:
              cpu: 1
              memory: 1Gi
        volumeMounts:
        - name: config-volume
          mountPath: /etc/alertmanager
        - name: templates-volume
          mountPath: /etc/alertmanager-templates
        - name: alertmanager
          mountPath: /alertmanager
      volumes:
      - name: config-volume
        configMap:
          name: alertmanager-config
      - name: templates-volume
        configMap:
          name: alertmanager-templates
      - name: alertmanager
        emptyDir: {}
Create the alert manager deployment using kubectl.
kubectl create -f Deployment.yamlCreate the Alert Manager Service Endpoint
We need to expose the alert manager using NodePort or Load Balancer just to access the Web UI. Prometheus will talk to the alert manager using the internal service endpoint.
Create a Service.yaml file with the following contents.
apiVersion: v1
kind: Service
metadata:
  name: alertmanager
  namespace: monitoring
  annotations:
      prometheus.io/scrape: 'true'
      prometheus.io/port:   '9093'
spec:
  selector:
    app: alertmanager
  type: NodePort
  ports:
    - port: 9093
      targetPort: 9093
      nodePort: 31000
Create the service using kubectl.
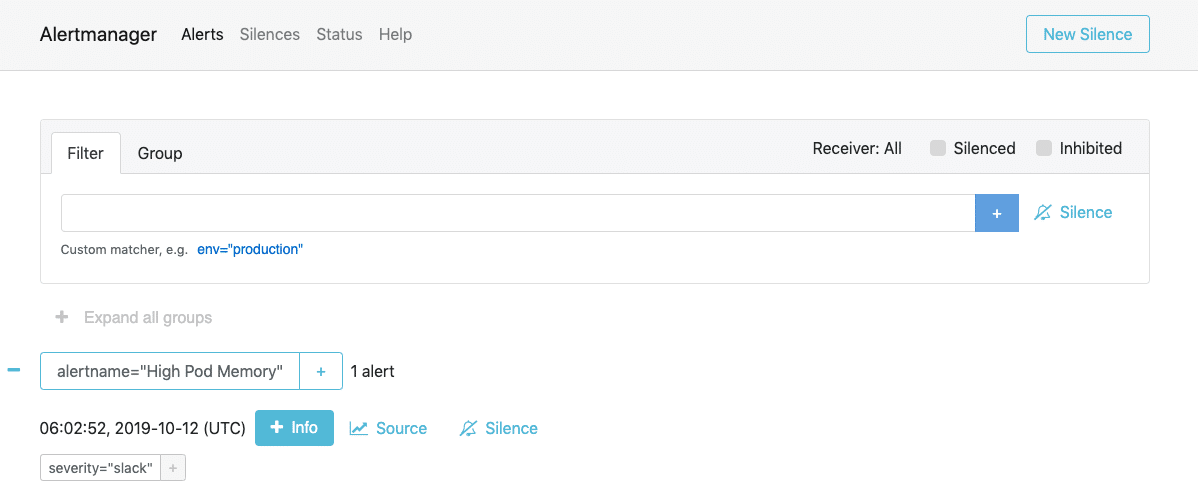
kubectl create -f Service.yamlNow, you will be able to access Alert Manager on Node Port 31000. For example,
http://35.114.150.153:31000